Best Enterprise Feedback Management Software - Page 4

How Many Enterprise Feedback Management Software Products Does G2 Track?

Total Products under this Category: 318

Category Stats (Sep 2026)

  • Average Rating: 4.5/5 (↓0.01 vs Aug 2026) The average rating of products in this category, based on all submitted ratings
  • Top Trending Product: ProProfs Survey Maker (+0.51%) - Among all products in this category, ProProfs Survey Maker recorded the largest rating increase compared to last month

Last updated: September 01, 2026

How Does G2 Rank Enterprise Feedback Management Software Products?

Why You Can Trust G2's Software Rankings:

  • 30 Analysts and Data Experts
  • 24,700+ Authentic Reviews
  • 318+ Products
  • Unbiased Rankings

G2's software rankings are built on verified user reviews, rigorous moderation, and a consistent research methodology maintained by a team of analysts and data experts. Each product is measured using the same transparent criteria, with no paid placement or vendor influence. While reviews reflect real user experiences, which can be subjective, they offer valuable insight into how software performs in the hands of professionals. Together, these inputs power the G2 Score, a standardized way to compare tools within every category.

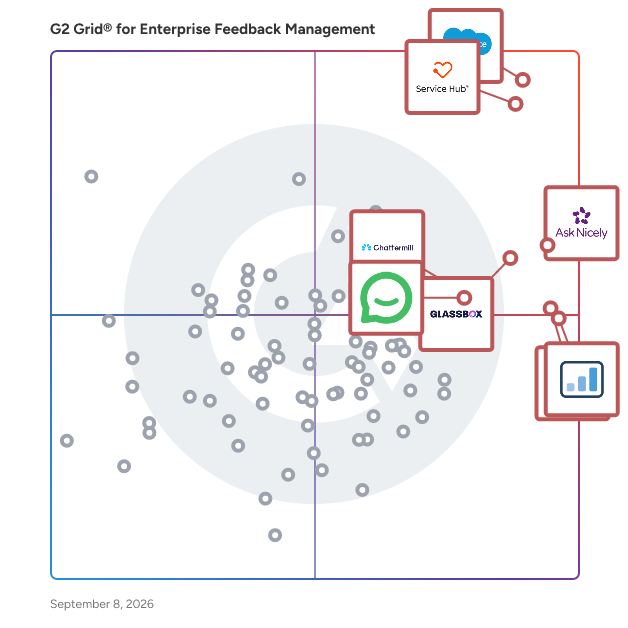
G2 Grid® for Enterprise Feedback Management Software

G2 Grid® for Enterprise Feedback Management Software plotting products by satisfaction and market presence

Highlighted products: Agentforce Service (formerly Salesforce Service Cloud), HubSpot Service Hub, AskNicely, Glassbox, Userback, ReputationStacker, Simplesat, and Chattermill.

Underlying data: [Grid® JSON](https://www.g2.com/categories/enterprise-feedback-management/grids.json?focus%5B%5D=agentforce-service-formerly-salesforce-service-cloud&focus%5B%5D=hubspot-service-hub&focus%5B%5D=asknicely&focus%5B%5D=glassbox&focus%5B%5D=userback&focus%5B%5D=reputationstacker&focus%5B%5D=simplesat&focus%5B%5D=chattermill)

Optimal

Optimal is a comprehensive user insights platform designed to support user research across the entire product development process. Tailored for enterprise organizations, Optimal helps teams make informed product decisions by connecting directly with users, from early discovery and concept validation to usability testing and post-launch optimization. The platform is particularly effective for cross-functional teams seeking to reduce development risk, align stakeholders, and deliver user-centered experiences at scale. Optimal serves product managers, designers, UX researchers, and others who need fast, reliable insights through structured user research. Its intuitive interface and AI-powered tools enable both researchers and non-researchers to contribute meaningfully, promoting research democratization without compromising quality. With flexible study design, AI and automation, and built-in participant recruitment, Optimal makes it easier to uncover user needs, test ideas early, validate navigation, and analyze qualitative feedback across multiple research efforts. Key capabilities of the Optimal platform include prototype testing and live website testing; AI-assisted surveys to quickly gather reliable feedback on user behaviors and preferences; and AI user research features that automatically extract insights, themes, and highlight reels from recorded interviews. Teams can also centralize qualitative data for streamlined analysis, structure content more effectively with card sorting and tree testing, and improve usability with first-click testing, and more. Participant recruitment is fully integrated, offering access to a global panel of over 100 million users across 150 countries, along with options for managed services or custom audiences. Trusted by global organizations including Apple, Netflix, Amazon, Spotify, Nike, and LEGO, Optimal empowers teams to conduct rigorous, scalable user research that informs strategic decisions and improves user satisfaction. By combining human insight with advanced AI user research capabilities, Optimal helps enterprises build better digital products, faster, smarter, and with greater confidence.

Average Rating: 4.3/5.0

Total Reviews: 70

How Do G2 Users Rate Optimal?

  • Ease of Use: 8.8/10 (Category avg: 9.1/10)
  • Brand Design Consistency: 5.8/10 (Category avg: 9.0/10)
  • Feedback Collection: 6.7/10 (Category avg: 9.2/10)
  • Feedback Aggregation: 10.0/10 (Category avg: 8.9/10)

Who Is the Company Behind Optimal?

  • Seller: Optimal
  • Company Website:
  • Year Founded: 2007
  • HQ Location: Wellington, NZ
  • Twitter: @optimalworkshop
    6,841 Twitter followers
  • LinkedIn® Page: www.linkedin.com
    101 employees on LinkedIn®

Who Uses This Product?

  • Who Uses This: Senior UX Researcher, UX Researcher
  • Top Industries: Design, Higher Education
  • Company Size: 39% Medium, 38% Large

What Do G2 Reviewers Say About Optimal?

AI-generated summary from verified user reviews

Pros
  • Users appreciate the outstanding ease of use of Optimal, allowing for quick survey creation with minimal setup.
  • Users appreciate the comprehensive suite of tools in Optimal, which simplifies research and enhances collaboration.
  • Users value the strong analytics capabilities of Optimal Workshop, which provide clear visuals and insights for research.
  • Users value the analysis efficiency of Optimal, which simplifies insights and enhances communication with stakeholders.
  • Users find the easy setup of Optimal highly intuitive, enabling quick adaptation and effective user research management.
Cons
  • Users find the missing features of Optimal, such as subgrouping, hinder their research capabilities and usability.
  • Users are frustrated with the high pricing issues and limited survey functionality that hampers their experience.
  • Users find Optimal to be expensive, especially given its limitations and the lack of distinct advantages over competitors.
  • Users report integration issues with Optimal, particularly with third-party tools like Figma, affecting functionality and workflow.
  • Users are frustrated by uploading issues with the qualitative insights tool, limiting their ability to consolidate research effectively.

What Are Recent G2 Reviews of Optimal?

What Are G2 Users Discussing About Optimal?

Customer Experience Solutions

Our platform powers a suite of next-generation customer experience solutions, including queue management, appointment booking, virtual queuing, video appointments, digital signage, wayfinding, customer feedback, and staffing management. It enables organisations to seamlessly manage and optimise omnichannel customer journeys while streamlining back-office processes through business process management (BPM). By incorporating predictive analytics, machine learning, and artificial intelligence, the platform helps organisations stay proactive, predictive, and productive, unlocking powerful capabilities that enhance customer experiences while reducing operational costs. Each module enables organisations to deliver a wide range of services through a single intuitive interface, helping maximise the value of every customer interaction across industries such as healthcare, financial services, education, retail, telecommunications, government, and more.

Average Rating: 4.6/5.0

Total Reviews: 32

How Do G2 Users Rate Customer Experience Solutions?

  • Ease of Use: 9.4/10 (Category avg: 9.1/10)
  • Brand Design Consistency: 8.2/10 (Category avg: 9.0/10)
  • Feedback Collection: 9.5/10 (Category avg: 9.2/10)
  • Feedback Aggregation: 8.3/10 (Category avg: 8.9/10)

Who Is the Company Behind Customer Experience Solutions?

  • Seller: ACF Technologies
  • Year Founded: 2003
  • HQ Location: Asheville, NC
  • Twitter: @ACF_Tech
    462 Twitter followers
  • LinkedIn® Page: www.linkedin.com
    179 employees on LinkedIn®

Who Uses This Product?

  • Top Industries: Information Technology and Services, Banking
  • Company Size: 39% Medium, 36% Large

What Are Recent G2 Reviews of Customer Experience Solutions?

What Are G2 Users Discussing About Customer Experience Solutions?

Chekkit

Chekkit is an all-in-one platform that helps local businesses grow faster with less effort. It combines AI-powered messaging and automation with the tools teams use every day—review management, business text messaging, groupchat, a centralized inbox, textable landline, customer surveys, competitive benchmarking, and more—so you can boost engagement, convert more leads, and outperform the competition from one place.

Average Rating: 4.9/5.0

Total Reviews: 154

How Do G2 Users Rate Chekkit?

  • Ease of Use: 9.6/10 (Category avg: 9.1/10)
  • Brand Design Consistency: 9.7/10 (Category avg: 9.0/10)
  • Feedback Collection: 8.9/10 (Category avg: 9.2/10)
  • Feedback Aggregation: 8.6/10 (Category avg: 8.9/10)

Who Is the Company Behind Chekkit?

  • Seller: Chekkit
  • Year Founded: 2016
  • HQ Location: Winnipeg
  • Twitter: @getchekkit
    204 Twitter followers
  • LinkedIn® Page: www.linkedin.com
    9 employees on LinkedIn®

Who Uses This Product?

  • Who Uses This: Owner, Manager
  • Top Industries: Retail, Luxury Goods & Jewelry
  • Company Size: 90% Small, 10% Medium

What Do G2 Reviewers Say About Chekkit?

AI-generated summary from verified user reviews

Pros
  • Users value the AI integration of Chekkit, enhancing their websites with unique chatbot capabilities for improved customer interaction.
  • Users appreciate the innovative AI chatbot feature of Chekkit, setting their website apart in the industry.
  • Users find the unique chatbot integration feature of Chekkit enhances their website's functionality and user engagement.
  • Users value the integration capabilities of Chekkit, allowing unique features like chatbots on their websites.
Cons
  • Users find the limited communication options of Chekkit frustrating, as responding to guests is only possible through text.
  • Users are frustrated by the limited chat functionality, only allowing responses to guests via text.
  • Users find the limited response options to guests via text to be restrictive and inconvenient.
  • Users find the poor chat functionality of Chekkit limiting, as text responses are the only option for communication.

What Are Recent G2 Reviews of Chekkit?

What Are G2 Users Discussing About Chekkit?

Planview Portfolios

Planview Portfolios is an enterprise strategic portfolio management software solution that helps PMO leaders, portfolio managers, and project teams connect organizational strategy to day-to-day work delivery across programs, resources, and investment decisions from a single platform. Formerly known as Planview Enterprise One, it sits within the strategic portfolio management and project portfolio management software categories and is built for large organizations managing complex, cross-functional initiative portfolios across multiple business units and delivery methodologies simultaneously. For practitioners, the platform provides a structured environment where incoming demand can be evaluated against available capacity, work can be planned and tracked across waterfall, agile, and hybrid approaches, and financial performance can be monitored at both the project and portfolio level. Role-based dashboards surface relevant data to each user type — from team members logging time to portfolio leaders reviewing investment performance — without requiring manual report assembly. Key features practitioners interact with regularly include: • Demand and investment management tools that allow teams to collect project and program requests, score them against business objectives, and model prioritization decisions before resources are committed • Scenario planning and what-if analysis capabilities that let portfolio managers compare alternative staffing, timing, and funding configurations to assess trade-offs and adapt plans when strategic priorities shift • Hybrid work delivery support that accommodates waterfall project schedules, agile team planning, and lean portfolio management approaches within the same governance framework — reducing the need for separate tools across delivery teams • Integrated financial tracking including budgeting, forecasting, cost actuals, and agile costing that connect planned spend to actual delivery activity across the full portfolio • Embedded AI capabilities including natural language querying, automated workflow triggers, and sentiment analysis on project status updates that surface emerging risks and reduce manual oversight effort Planview Portfolios connects to enterprise systems including SAP, Salesforce, Workday, ServiceNow, and Microsoft tools, and includes more than 200 out-of-the-box reports and visualizations.

Average Rating: 3.8/5.0

Total Reviews: 90

How Do G2 Users Rate Planview Portfolios?

  • Ease of Use: 6.7/10 (Category avg: 9.1/10)
  • Brand Design Consistency: 10.0/10 (Category avg: 9.0/10)
  • Feedback Collection: 10.0/10 (Category avg: 9.2/10)
  • Feedback Aggregation: 10.0/10 (Category avg: 8.9/10)

Who Is the Company Behind Planview Portfolios?

  • Seller: Planview
  • Company Website:
  • Year Founded: 1989
  • HQ Location: Austin, TX
  • Twitter: @Planview
    3,049 Twitter followers
  • LinkedIn® Page: www.linkedin.com
    1,834 employees on LinkedIn®

Who Uses This Product?

  • Top Industries: Information Technology and Services, Insurance
  • Company Size: 78% Large, 23% Medium

What Do G2 Reviewers Say About Planview Portfolios?

AI-generated summary from verified user reviews

Pros
  • Users value the robust project management capabilities of Planview Portfolios, enhancing resource and workflow management.
  • Users value the robust project tracking capabilities of Planview Portfolios, enhancing management and reporting efficiency.
  • Users value the automation features in Planview Portfolios, enhancing project management and reporting efficiency significantly.
  • Users value the custom fields feature in Planview Portfolios, enabling tailored workflows and enhanced reporting capabilities.
  • Users value the customizability of Planview Portfolios, enabling tailored workflows and personalized reporting options.
Cons
  • Users find the lengthy support process cumbersome, leading to delays in issue resolution with Planview Portfolios.
  • Users find the missing dynamic input features limits UX design and flexibility in data entry processes.
  • Users find the poor design of Planview Portfolios limits functionality and requires significant improvements in UX for better input management.
  • Users criticize the poor layout design of Planview Portfolios, affecting usability and functionality significantly.
  • Users feel the poor UI of Planview Portfolios hinders usability, lacking necessary dynamic interactions for enhanced experience.

What Are Recent G2 Reviews of Planview Portfolios?

What Are G2 Users Discussing About Planview Portfolios?

Mopinion

In order to succeed in a more complex and digitising world, you'll need a helping hand when it comes to finding out exactly what your customers want and need. Mopinion provides you with the European #1 Feedback Software for Web, App and Email. At Mopinion, we make it easy for you to discover missing insights and optimise digital experiences. You know what users are doing. Now find out why. Mopinion Products: - Mopinion for Websites: Deliver an exceptional website experience. Get the inside scoop on how your customers experience your website so that you can drive strategy and boost engagement. - Mopinion for Apps: Grab a hold of powerful in-app insights. Collect powerful feedback from your native apps with our flexible and easy-to-install SDKs for iOS and Android. - Mopinion for Email: Boost engagement within email campaigns. It’s not just about clicks or opens anymore. Start sending the right message to your audience. Insights & Action: Stay on top of your user feedback with AI-powered feedback summarisation, trend identification, and the best data visualisation and action management tools at your fingertips. Connect your favorite tools with Mopinion: Mopinion integrates seamlessly with your favourite applications. Expand your possibilities and connect your apps to Mopinion. Technology: Mopinion provides tons of connectors and agile cloud services for data integration, feedback management, and automation so you’re up and running fast. Because we’re built on the best technologies, Mopinion is the most trusted name when it comes to analysing customer feedback from your websites and apps. Security: We understand the value of data, and provide solid security at all levels. Our team will do the utmost to keep your data safe and protected, and that is why Mopinion is ISO 27001 certified. All data transferred to and from our servers is encrypted via a SSL connection. The Mopinion platform is hosted with the world’s leading data center providers. Our data center partners are SOC 2 Type II and ISO 27001 certified. Join over 1500+ enterprises with forward-thinking digital teams such as Air France-KLM, Bol, Colgate-Palmolive, the Dutch Government, Efteling, Engie, France Travail, Kaufland, KPN, Scania, TomTom, TSB Bank, Vattenfall and many more. Mopinion is part of Netigate: The European leading AI-powered Experience Management platform. We help enterprises turn customer and employee insights into business growth.

Average Rating: 4.1/5.0

Total Reviews: 27

How Do G2 Users Rate Mopinion?

  • Ease of Use: 8.1/10 (Category avg: 9.1/10)
  • Brand Design Consistency: 9.1/10 (Category avg: 9.0/10)
  • Feedback Collection: 8.6/10 (Category avg: 9.2/10)
  • Feedback Aggregation: 8.0/10 (Category avg: 8.9/10)

Who Is the Company Behind Mopinion?

  • Seller: Mopinion
  • Year Founded: 2013
  • HQ Location: Rotterdam, South Holland, Netherlands
  • LinkedIn® Page: www.linkedin.com
    26 employees on LinkedIn®

Who Uses This Product?

  • Top Industries: Retail
  • Company Size: 50% Medium, 29% Large

What Are Recent G2 Reviews of Mopinion?

What Are G2 Users Discussing About Mopinion?

Enghouse Insights

Enghouse Insights' Multi-Mode Data Collection platform is a comprehensive solution designed for market researchers and political polling specialists seeking to gather accurate and diverse data. By integrating multiple data collection methods—including online surveys (WAPI), phone interviews (CATI), non-agent phone interviews (IVR), and face-to-face interactions—the platform ensures a holistic representation of target audiences. This approach minimizes selection bias and accommodates varying respondent preferences, leading to more reliable and nuanced insights. Key Features and Functionality: - Enhanced Reach: Employing various data collection modes allows access to a broader and more diverse audience, facilitating comprehensive insights across different demographic groups. - Time and Cost Efficiency: The platform enables efficient resource allocation by selecting the most cost-effective and timely data collection methods tailored to specific project needs. - Optimized Response Rates: Offering multiple engagement options caters to individual respondent preferences, resulting in higher participation rates and more complete datasets. - Reduced Non-Response Bias: By providing various modes of participation, the platform mitigates non-response bias, ensuring a more representative sample and accurate insights. - Deeper Insights: Combining data from different collection modes captures unique perspectives, leading to a more profound understanding of complex issues and consumer behaviors. - Real-Time Monitoring: The platform offers real-time tracking of survey progress, response rates, and data quality, allowing for prompt adjustments to enhance data collection processes. - Improved Data Quality: Utilizing multiple data collection methods enables data triangulation, cross-referencing responses to validate and enhance data accuracy. - Geographical Coverage: The platform ensures comprehensive data collection across various regions, reducing bias from localized responses and providing a more accurate representation of the target population. Primary Value and User Solutions: The Multi-Mode Data Collection platform addresses the challenges of modern data gathering by offering a versatile and efficient solution that adapts to changing communication trends and respondent behaviors. It empowers organizations to make informed decisions based on high-quality, representative data, ultimately leading to more accurate insights and strategic advantages in market research and political polling.

Average Rating: 3.8/5.0

Total Reviews: 28

How Do G2 Users Rate Enghouse Insights?

  • Ease of Use: 8.3/10 (Category avg: 9.1/10)
  • Brand Design Consistency: 10.0/10 (Category avg: 9.0/10)
  • Feedback Collection: 10.0/10 (Category avg: 9.2/10)
  • Feedback Aggregation: 10.0/10 (Category avg: 8.9/10)

Who Is the Company Behind Enghouse Insights?

  • Seller: Enghouse Systems
  • Year Founded: 1984
  • HQ Location: Markham
  • Twitter: @EnghouseInterac
    2,418 Twitter followers
  • LinkedIn® Page: www.linkedin.com
    1,284 employees on LinkedIn®
  • Ownership: ENGH (TSE)

Who Uses This Product?

  • Top Industries: Telecommunications
  • Company Size: 45% Small, 42% Medium

What Do G2 Reviewers Say About Enghouse Insights?

AI-generated summary from verified user reviews

Pros
  • Users appreciate the real-time AI-powered analytics of Enghouse Insights, effectively unifying customer interactions across multiple channels.
  • Users find Enghouse Insights to have excellent ease of use that improves after initial setup, streamlining customer interaction data.
  • Users value the efficiency of Enghouse Insights in unifying customer interaction data across multiple channels seamlessly.
  • Users value the real-time AI-powered analytics of Enghouse Insights, effectively unifying customer interactions for better CX.
  • Users value the intuitive design of Enghouse Insights, which simplifies unifying and analyzing omnichannel customer interactions.
Cons
  • Users find the difficult learning curve of Enghouse Insights challenging initially, but it improves with regular use.
  • Users express concerns about integration issues that complicate the execution of Enghouse Insights effectively.
  • Users find the learning curve challenging initially but note it becomes easier with frequent use over time.
  • Users experience slow performance with Enghouse Insights, impacting efficiency, especially at enterprise scale.
  • Users find scalability and performance at enterprise scale challenging, particularly during the initial learning phase.

What Are Recent G2 Reviews of Enghouse Insights?

What Are G2 Users Discussing About Enghouse Insights?

ProProfs Survey Maker

ProProfs Survey Maker is SaaS-based survey software that helps businesses create attractive and personalized feedback surveys through professionally-designed themes. You can use a pre-made survey or create a customized survey to gather data that enables you to measure customer loyalty and satisfaction levels with ease. ProProfs survey maker offers a great survey design to fetch more accurate data. It helps you collect unbiased survey data on a diverse range of topics. More than 100 ready-made templates and over 1,000,000 thoughtfully crafted questions help you get information aligned with your business goals and objectives. Here the main offerings of this highly versatile tool: Surveys NPS Surveys In-App Surveys Popup surveys Forms such as SideBar forms Quizzes Polls Major Attractions of the ProProfs Survey Maker Get an overview of customer activity: The tool provides real-time reports in the form of graphs, charts, and other graphics. Boost customer retention: Everything is made visible on the powerful dashboard for you to compare and create an actionable strategy. Amp up your lead generation and conversions: Get a snapshot of the behaviors and attitudes of the customers. Multiple language support: Get information from customers from around the world. Expand customer outreach: The surveys can be shared across various platforms and social networks. Evaluate customer’s choice: The tool lets you conduct NPS surveys to see if a customer will choose your brand for his/her next buy or recommend any friend or colleague for the same. Gauge your website traffic and gather quick feedback: You can take advantage of the Popup survey, which can be strategically triggered in response to specific actions by the user. Multiple integrations: The survey maker can be integrated with Freshdesk, MailChimp, SalesForce, Constant Contact, Zendesk to capture customer’s details and gather more valuable data. If you face any issue during survey creation, you can take the help of the video tutorials and FAQs available in the help section.

Average Rating: 4.3/5.0

Total Reviews: 50

How Do G2 Users Rate ProProfs Survey Maker?

  • Ease of Use: 9.2/10 (Category avg: 9.1/10)
  • Brand Design Consistency: 8.8/10 (Category avg: 9.0/10)
  • Feedback Collection: 8.6/10 (Category avg: 9.2/10)
  • Feedback Aggregation: 8.1/10 (Category avg: 8.9/10)

Who Is the Company Behind ProProfs Survey Maker?

  • Seller: ProProfs
  • Year Founded: 2009
  • HQ Location: Los Angeles, CA
  • Twitter: @ProProfs
    4,731 Twitter followers
  • LinkedIn® Page: www.linkedin.com
    214 employees on LinkedIn®

Who Uses This Product?

  • Top Industries: Education Management
  • Company Size: 49% Medium, 34% Small

What Do G2 Reviewers Say About ProProfs Survey Maker?

AI-generated summary from verified user reviews

Pros
  • Users appreciate the ease of use of ProProfs Survey Maker, enabling quick setup and seamless integration with other tools.
  • Users love the easy setup of ProProfs Survey Maker, allowing quick survey creation just minutes after signing up.
  • Users appreciate the easy survey creation process in ProProfs Survey Maker, enjoying its user-friendly drag and drop features.
  • Users highlight the quick setup of ProProfs Survey Maker, enabling effortless creation of surveys in minutes.
  • Users appreciate the hassle-free setup of ProProfs Survey Maker, enabling quick and easy initiation of surveys and quizzes.
Cons
  • Users note the poor design of ProProfs Survey Maker, citing a dated and dense interface that hinders usability.
  • Users find the UI of ProProfs Survey Maker outdated and dense, detracting from the overall user experience.
  • Users find the cluttered interface of ProProfs Survey Maker to be overwhelming and less user-friendly.
  • Users find exporting issues with ProProfs Survey Maker, often requiring manual cleanup for data formatting.
  • Users report formatting issues with exported data needing manual cleanup, which can be frustrating during analysis.

What Are Recent G2 Reviews of ProProfs Survey Maker?

What Are G2 Users Discussing About ProProfs Survey Maker?

Netigate

Netigate is an AI-powered experience management platform that empowers enterprises to transform the voice of their customers and employees into tangible business growth. By collecting, analyzing, and acting on feedback in real time, organizations can uncover deep insights that drive smarter decisions, foster loyalty, and improve performance across every touchpoint. Our powerful, scalable solutions are trusted by over 1,500 of the world’s most respected brands—including Spotify, DB Schenker, Vodafone, Continental, and EnBW. Whether you're looking to improve customer satisfaction, boost employee engagement, or gain a holistic view of your organization’s experience landscape, Netigate delivers the tools and intelligence needed to make it happen. Founded in Stockholm, Sweden in 2005, Netigate has grown into a leading experience management partner across Europe. With additional offices in Oslo, Helsinki, and Frankfurt am Main, we have a strong and growing European presence. Our local teams bring regional expertise and provide personalized support tailored to the unique needs of each market and organization. What sets us apart is our combination of advanced AI technology with a human-centered approach. We believe that behind every data point is a real person—a customer or an employee whose voice deserves to be heard and understood. That’s why we’ve built a platform that not only delivers robust analytics, but also helps organizations take meaningful action based on real, actionable insights. Whether you're just getting started with experience management or looking to take your current efforts to the next level, Netigate is here to support your journey every step of the way. Want to learn how your organization can harness the power of feedback to drive business success? Book a demo with one of our specialists today.

Average Rating: 4.2/5.0

Total Reviews: 31

How Do G2 Users Rate Netigate?

  • Ease of Use: 8.8/10 (Category avg: 9.1/10)

Who Is the Company Behind Netigate?

  • Seller: Netigate
  • Year Founded: 2005
  • HQ Location: Stockholm, Stockholm County
  • Twitter: @Netigate
    868 Twitter followers
  • LinkedIn® Page: www.linkedin.com
    114 employees on LinkedIn®

Who Uses This Product?

  • Top Industries: Information Technology and Services
  • Company Size: 32% Large, 29% Medium

What Do G2 Reviewers Say About Netigate?

AI-generated summary from verified user reviews

Pros
  • Users love the intuitive design of Netigate, making survey creation and analysis very straightforward and user-friendly.
  • Users commend the ease of creation with Netigate, enabling intuitive survey design without technical skills.
  • Users appreciate the intuitive design and powerful features of Netigate, making professional surveys easy and efficient.
  • Users value the intuitive functionality of Netigate, enabling easy survey design and quick, insightful reporting.
  • Users value the intuitive survey creation in Netigate, enabling easy design with powerful functionality and customization options.
Cons
  • Users face initial setup complexity with Netigate, particularly when configuring role-based access and permissions across departments.
  • Users experience a steep learning curve with Netigate, making initial setup and advanced features challenging for newcomers.
  • Users note the limited customization of Netigate, which restricts tailoring surveys to specific requirements and enhances complexity.
  • Users report data inconsistency issues, especially during real-time synchronization, affecting overall reliability and user experience.
  • Users experience integration issues with limited third-party connections, affecting overall functionality and collaboration efficiency.

What Are Recent G2 Reviews of Netigate?

What Are G2 Users Discussing About Netigate?

Swell

Swell automatically gathers private and public feedback from patients and employees. With better feedback, practices can boost their online reputations, enhance the patient experience, and improve employee satisfaction.

Average Rating: 4.5/5.0

Total Reviews: 341

How Do G2 Users Rate Swell?

  • Ease of Use: 9.0/10 (Category avg: 9.1/10)
  • Brand Design Consistency: 9.3/10 (Category avg: 9.0/10)
  • Feedback Collection: 8.8/10 (Category avg: 9.2/10)
  • Feedback Aggregation: 8.6/10 (Category avg: 8.9/10)

Who Is the Company Behind Swell?

  • Seller: SocialSwell
  • Year Founded: 2016
  • HQ Location: Salt Lake City, Utah
  • Twitter: @Swell_Reviews
    2 Twitter followers
  • LinkedIn® Page: www.linkedin.com
    37 employees on LinkedIn®

Who Uses This Product?

  • Who Uses This: Office Manager, Owner
  • Top Industries: Hospital & Health Care, Health, Wellness and Fitness
  • Company Size: 87% Small, 12% Medium

What Are Recent G2 Reviews of Swell?

Alchemer Digital

Alchemer Digital helps you capture feedback and engage customers right where their experience happens—inside your app or on your website. Instead of waiting for feedback after the fact, you can ask, listen, and act in the moment. Trigger in-app and on-site surveys, prompts, and messages based on real customer behavior. Whether someone completes a key action, hits a friction point, or shows signs of churn, Alchemer Digital lets you reach them with the right message at the right time—without disrupting their experience. Go beyond basic feedback collection. With precise targeting and real-time delivery, you can uncover what’s driving engagement, identify issues before they turn into churn, and guide customers toward better outcomes while they’re still active. And because Alchemer Digital connects with your broader systems, feedback doesn’t sit in a dashboard. It flows to the right teams, triggers follow-ups, and supports closed-loop feedback—so you can respond quickly and keep improving. Built for product, marketing, and customer teams, Alchemer Digital makes it easy to improve engagement, increase retention, and turn everyday interactions into meaningful insights. This is why many of the largest brands in the world, including, CNN, JetBlue, eBay, Safeway, and FanDuel, engage their mobile customers with Alchemer Mobile.

Average Rating: 4.3/5.0

Total Reviews: 181

How Do G2 Users Rate Alchemer Digital?

  • Ease of Use: 8.6/10 (Category avg: 9.1/10)
  • Brand Design Consistency: 8.4/10 (Category avg: 9.0/10)
  • Feedback Collection: 8.8/10 (Category avg: 9.2/10)
  • Feedback Aggregation: 8.4/10 (Category avg: 8.9/10)

Who Is the Company Behind Alchemer Digital?

  • Seller: Alchemer
  • HQ Location: Louisville, CO
  • Twitter: @AlchemerHQ
    7,024 Twitter followers
  • LinkedIn® Page: www.linkedin.com
    232 employees on LinkedIn®

Who Uses This Product?

  • Who Uses This: Product Manager, Senior Product Manager
  • Top Industries: Telecommunications, Financial Services
  • Company Size: 45% Large, 38% Medium

What Are Recent G2 Reviews of Alchemer Digital?

What Are G2 Users Discussing About Alchemer Digital?

Kimoby

Kimoby is a Service Lane Operating System built for automotive dealership service departments. It consolidates two-way texting, inspections, V2C with AI-generated estimates, digital estimates with one-tap customer approval, mobile payments, in-person payment terminals, loaner fleet management, Voice AI agent for missed calls, CSI follow-up, and marketing campaigns into one platform. Kimoby integrates with CDK (with write-back), Reynolds and Reynolds, PBS, Tekion, DealerTrack, Autosoft, Serti, Dealer Vu, and Quorum. When a customer approves an estimate or makes a payment, it writes back to the DMS repair order automatically. Over 1,000 dealerships across in the United States and Canada use Kimoby. BMW Activities Fund approved vendor with exclusive myBMW app integration. VW eConnect and CMC approved. Ford Commitment Program qualifying vendor. Month-to-month contracts. No setup fee. No long-term commitment. Transparent pricing published at kimoby.com/pricing.

Average Rating: 4.8/5.0

Total Reviews: 66

How Do G2 Users Rate Kimoby?

  • Ease of Use: 9.6/10 (Category avg: 9.1/10)
  • Brand Design Consistency: 10.0/10 (Category avg: 9.0/10)
  • Feedback Collection: 10.0/10 (Category avg: 9.2/10)
  • Feedback Aggregation: 10.0/10 (Category avg: 8.9/10)

Who Is the Company Behind Kimoby?

  • Seller: Kimoby
  • Year Founded: 2013
  • HQ Location: Québec, CA
  • LinkedIn® Page: www.linkedin.com
    51 employees on LinkedIn®

Who Uses This Product?

  • Who Uses This: Service Advisor
  • Top Industries: Automotive
  • Company Size: 57% Small, 41% Medium

What Do G2 Reviewers Say About Kimoby?

AI-generated summary from verified user reviews

Pros
  • Users value the easy communication offered by Kimoby, simplifying interactions for tech-savvy individuals.
  • Users praise Kimoby for its ease of use, facilitating seamless communication for tech-savvy advisors and cellphone users.
  • Users love the time-saving benefits of Kimoby, allowing more focus on work instead of phone tag with customers.
Cons
  • Users feel the absence of a quick add customer button limits efficiency while navigating through Kimoby.
  • Users experience double texting issues with Kimoby, leading to confusion for guests after vehicle service completion.
  • Users face software glitches causing double text notifications, which disrupt communication with guests returning from the dealership.

What Are Recent G2 Reviews of Kimoby?

What Are G2 Users Discussing About Kimoby?

Pulse

Pulse is the world’s leading AI-native Feedback Intelligence Platform built for modern enterprises. In today’s digital-first world, customer feedback is scattered across endless channels — from support tickets, CRM notes, app store reviews, call transcripts, Slack channels, and social media chatter to D2C aggregator platforms. For product, customer success, and operations teams, this creates an overwhelming challenge: how to unify, prioritise, and act on fragmented signals at scale. Pulse solves this by transforming unstructured customer feedback into structured, revenue-driving intelligence. Powered by Agentic AI, the platform consolidates all feedback sources into a single source of truth, enriches them with business context (revenue, churn risk, NRR, CSAT, LTV, repeat orders), and drives AI-led workflows that help enterprises make smarter, faster, and more transparent decisions. For product teams, Pulse acts as a co-pilot for prioritisation and roadmap planning. It surfaces the most critical customer requests, links them to business outcomes, and even generates PRD drafts and roadmap hierarchies — helping teams move from feedback to execution seamlessly. For customer success teams, Pulse provides real-time alerts on at-risk accounts, churn signals, and recurring hotspots, enabling proactive resolution before revenue impact occurs. Instead of sifting through thousands of support tickets or NPS surveys, CS leaders gain instant clarity on the issues that matter most. For business operations teams in digital-native enterprises (e-commerce, fintech, food delivery, travel), Pulse helps uncover operational gaps like payment failures, onboarding bottlenecks, or logistics breakdowns by analyzing inputs from support desks, app reviews, loyalty programs, and call centers. These insights drive measurable improvements in efficiency, compliance, and customer satisfaction. Unlike traditional product analytics tools or CX-only solutions, Pulse is purpose-built as a cross-functional intelligence layer. It doesn’t just analyze feedback — it closes the loop with traceable workflows, collaboration features, and audit trails that ensure alignment across product, CX, marketing, operations, and leadership teams. Pulse is more than a tool — it’s a movement toward data-backed, customer-obsessed decision-making. As enterprises adopt AI across engineering and operations, Pulse ensures that customer feedback doesn’t remain the bottleneck. Instead, it becomes the fuel for building products customers love, delivering proactive experiences, and driving sustainable business growth.

Average Rating: 4.6/5.0

Total Reviews: 21

How Do G2 Users Rate Pulse?

  • Ease of Use: 8.0/10 (Category avg: 9.1/10)
  • Feedback Collection: 10.0/10 (Category avg: 9.2/10)
  • Feedback Aggregation: 10.0/10 (Category avg: 8.9/10)

Who Is the Company Behind Pulse?

Who Uses This Product?

  • Who Uses This: Product Manager
  • Top Industries: Computer Software, Construction
  • Company Size: 76% Medium, 10% Large

What Do G2 Reviewers Say About Pulse?

AI-generated summary from verified user reviews

Pros
  • Users value the ease of insights generation with Pulse, consolidating feedback and revealing key patterns effortlessly.
  • Users value the automation capabilities of Pulse, significantly reducing manual effort and streamlining workflow efficiency.
  • Users praise Pulse for its holistic customer insights, streamlining feedback and enhancing decision-making effortlessly.
  • Users highlight the efficiency of Pulse, streamlining insights and significantly reducing time spent on analysis and decision-making.
  • Users value the exceptional customer support of Pulse, enhancing efficiency in building customer experience programs.
Cons
  • Users find the cluttered interface of Pulse can be overwhelming, making navigation and insights difficult to manage.
  • Users report that integration issues occasionally hinder the efficiency of using Pulse with other tools.
  • Users find the limited tools of Pulse hinder immediate productivity and smooth onboarding experiences.

What Are Recent G2 Reviews of Pulse?

Centercode

Centercode is a user testing automation platform that transforms how you collect and analyze pre-release customer feedback. Our delta testing system uses intelligent technology to produce rapid results with minimal time investment. Imagine: continuous, up-to-the-minute customer insights ahead of every release. Centercode offers - Feedback automation, including sentiment-driven feedback forms, smart scoring, and workflows to eliminate the endless hours you spend copying and pasting feedback between tools. - Smart prioritization, which organizes your feedback based on its impact on product success and routes high-priority feedback to relevant teams automatically. - Tester automation, from finding testers to keeping them active in your projects. With fine-grained profiling, automated engagement, and community-building tools, your testers will love your tests as much as they love your product. - Project automation that automatically plans for you, manages tester engagement through machine learning, and distills results in easily digestible scores—ensuring your project’s success. - Turnkey dashboards and reports present robust analytics and scores. Centercode gets everyone speaking the same language and makes it simple to identify areas for improvement, communicate across teams, and demonstrate ROI. - Flexible APIs that enable anyone to create powerful integrations — no developer required. - The highest levels of security, reliability, privacy, and compliance so you can protect your customers and your organization. Centercode is GDPR and CCPA-compliant. 1 in 4 Fortune 100 companies relies on Centercode's powerful, data-centralized platform to bring customers to the product development table. Whether you're a solo act or a full-scale team, Centercode empowers you to create flexible projects, maintain high user participation rates, and produce continuous product insights to support high-speed development.

Average Rating: 4.3/5.0

Total Reviews: 108

How Do G2 Users Rate Centercode?

  • Ease of Use: 7.3/10 (Category avg: 9.1/10)
  • Brand Design Consistency: 8.6/10 (Category avg: 9.0/10)
  • Feedback Collection: 8.8/10 (Category avg: 9.2/10)
  • Feedback Aggregation: 8.3/10 (Category avg: 8.9/10)

Who Is the Company Behind Centercode?

  • Seller: Centercode
  • Year Founded: 2001
  • HQ Location: Laguna Hills, CA
  • Twitter: @Centercode
    1,830 Twitter followers
  • LinkedIn® Page: www.linkedin.com
    55 employees on LinkedIn®

Who Uses This Product?

  • Top Industries: Consumer Electronics, Computer Software
  • Company Size: 44% Large, 33% Medium

What Are Recent G2 Reviews of Centercode?

What Are G2 Users Discussing About Centercode?

unitQ

unitQ is the AI quality intelligence platform that unifies every customer signal into one system, connects it to your most critical business metrics, and tells every team exactly what to prioritize — before your KPIs move. Built on six purpose-built products in one platform, unitQ gives organizations everything they need to detect issues the moment they emerge, understand their business impact, benchmark quality against competitors, evaluate every support interaction, uncover qualitative insight at scale, and act on what customers are saying across social — all from a single source of truth. The result: product, engineering, CX, and leadership teams stop working from fragmented tools and different versions of customer reality — and start making faster, more confident decisions grounded in what customers are actually experiencing right now. The products millions of consumers love every day — including Pinterest, Adobe, PayPal, and Bumble — trust unitQ to close the gap between what customers experience and what companies know about it. Video: https://vimeo.com/1185696845/72c8d2dbbf?share=copy&fl=sv&fe=ci

Average Rating: 4.5/5.0

Total Reviews: 48

How Do G2 Users Rate unitQ?

  • Ease of Use: 8.5/10 (Category avg: 9.1/10)
  • Brand Design Consistency: 8.5/10 (Category avg: 9.0/10)
  • Feedback Collection: 9.1/10 (Category avg: 9.2/10)
  • Feedback Aggregation: 9.1/10 (Category avg: 8.9/10)

Who Is the Company Behind unitQ?

  • Seller: unitQ
  • Year Founded: 2018
  • HQ Location: Burlingame, California
  • Twitter: @unitqsoftware
    219 Twitter followers
  • LinkedIn® Page: www.linkedin.com
    50 employees on LinkedIn®

Who Uses This Product?

  • Top Industries: Information Technology and Services, Entertainment
  • Company Size: 54% Medium, 38% Large

What Do G2 Reviewers Say About unitQ?

AI-generated summary from verified user reviews

Pros
  • Users value the customizable and integrated insights from unitQ, making data-driven decisions across various business functions seamless.
  • Users commend the excellent customer support from unitQ, enhancing their experience and effective use of the platform.
  • Users find unitQ’s ease of use intuitive, requiring minimal training for effective feedback gathering across teams.
  • Users value the easy integrations of unitQ, enhancing collaboration and data analysis across various business functions.
  • Users value the efficient integration and customization of unitQ, enhancing collaboration and decision-making across teams.
Cons
  • Users experience occasional accuracy issues with data quality and timeline delays that affect the tool’s reliability.
  • Users find complex setup challenging, especially without local support for guidance in their time zone.
  • Users face challenges with dashboard setup issues and lack support during UK time zone for assistance.
  • Users experience occasional data inconsistencies that can affect reliability, despite the overall value of UnitQ.
  • Users experience occasional inconsistencies in data quality, which can detract from the overall reliability of unitQ.

What Are Recent G2 Reviews of unitQ?

Customer Thermometer

Customer Thermometer enables your customers to provide feedback in a quick and easy way by rating your service through a traffic light system. Their click leads them to a branded "thank you" page, on which they can leave additional comments, complete with social media buttons and a trackable hyper link. Use the software to respond directly to customers and measure your net promoter score. Survey are fully customizable and work on all mobile devices. Customer Thermometer surveys allow you to add your company logo and to choose from a wide range of icons, emoticons, traffic lights, numbers, check boxes and crosses. You can select seasonal icons as well as create your own branded icons. In each survey you ask one question. You then select 4 possible answers or add numbers for a voting question. Upload your desired contact list and send your emails there and then, or time them to go out at a later date. Email are sent via secure emails servers so that they don't end up in your recipients spam or junk folders. Watch your results come in in real-time and get access to individual respondent information so you can take appropriate action.

Average Rating: 3.9/5.0

Total Reviews: 16

How Do G2 Users Rate Customer Thermometer?

  • Ease of Use: 9.3/10 (Category avg: 9.1/10)

Who Is the Company Behind Customer Thermometer?

  • Seller: Customer Thermometer
  • Year Founded: 2010
  • HQ Location: Brighton, United Kingdom
  • Twitter: @CustThermometer
    1,229 Twitter followers
  • LinkedIn® Page: www.linkedin.com
    6 employees on LinkedIn®

Who Uses This Product?

  • Company Size: 56% Small, 31% Medium

What Are Recent G2 Reviews of Customer Thermometer?

What Are G2 Users Discussing About Customer Thermometer?

Inia Debnath
ID
Researched and written by Inia Debnath
Updated October 3, 2024