Best Heatmap Tools

How Many Heatmap Tools Products Does G2 Track?

Total Products under this Category: 86

Category Stats (Aug 2026)

  • Average Rating: 4.52/5 The average rating of products in this category, based on all submitted ratings
  • Top Trending Product: Hotjar by Contentsquare (+0.09%) - Among all products in this category, Hotjar by Contentsquare recorded the largest rating increase compared to last month

Last updated: August 11, 2026

How Does G2 Rank Heatmap Tools Products?

Why You Can Trust G2's Software Rankings:

  • 30 Analysts and Data Experts
  • 10,300+ Authentic Reviews
  • 86+ Products
  • Unbiased Rankings

G2's software rankings are built on verified user reviews, rigorous moderation, and a consistent research methodology maintained by a team of analysts and data experts. Each product is measured using the same transparent criteria, with no paid placement or vendor influence. While reviews reflect real user experiences, which can be subjective, they offer valuable insight into how software performs in the hands of professionals. Together, these inputs power the G2 Score, a standardized way to compare tools within every category.

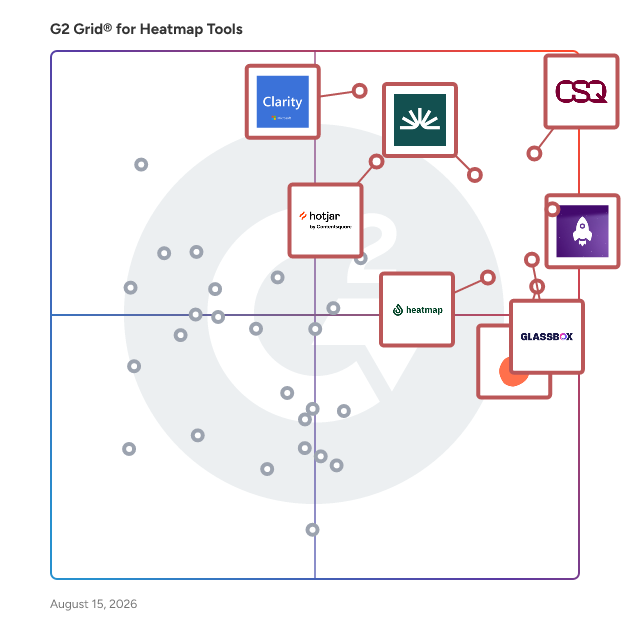
G2 Grid® for Heatmap Tools

G2 Grid® for Heatmap Tools plotting products by satisfaction and market presence

Highlighted products: Contentsquare, LogRocket, Fullstory, Microsoft Clarity, Glassbox, Lucky Orange, Hotjar by Contentsquare, and Heatmap.

Underlying data: [Grid® JSON](https://www.g2.com/categories/heatmap-tools/grids.json?focus%5B%5D=contentsquare&focus%5B%5D=logrocket&focus%5B%5D=fullstory&focus%5B%5D=microsoft-microsoft-clarity&focus%5B%5D=glassbox&focus%5B%5D=lucky-orange&focus%5B%5D=hotjar-by-contentsquare&focus%5B%5D=heatmap)

Sponsored

AgencyAnalytics

AgencyAnalytics is the only reporting and insights platform built for marketing agencies. Prove your value to clients, win back the hours you lose to manual reporting, and keep more of the clients you've worked hard to earn. Connect every client's marketing channels into live, customizable dashboards and report on SEO, PPC, social media, email, call tracking, ecommerce, local, and more, with 85+ integrations in one place. Automate report creation and scheduling so polished, accurate updates go out on time without the manual work. Benchmark performance, spot trends early, and use AI-powered insights to walk into client calls already knowing what's working and what to fix. Everything is fully white-labeled for your agency, so clients get their own branded login to the web or mobile app. Whether you're an established agency or just getting started, AgencyAnalytics offers flexible pricing that scales as you grow. Try it risk-free for 14 days, no credit card required.

Visit website

Contentsquare

Contentsquare is an AI-powered experience intelligence platform designed to help businesses understand customer behavior and optimize user engagement across digital channels. By capturing and analyzing high-fidelity behavioral and performance data from both web and mobile environments, Contentsquare provides teams with the insights necessary to enhance customer experiences, drive conversions, and ultimately increase customer lifetime value. This platform caters to a diverse range of industries and is particularly beneficial for enterprise brands looking to gain a deeper understanding of their customers. With over 2,000 trusted clients, Contentsquare is utilized by marketing, product, and UX teams to identify the reasons behind customer engagement or abandonment. The platform's ability to transform complex data into actionable insights allows organizations to make informed decisions that improve user experiences and boost overall performance. Contentsquare distinguishes itself from traditional analytics solutions by not only reporting on what has happened but also providing explanations for why certain behaviors occur. This is achieved through immersive visualizations that illustrate user journeys and interactions, coupled with AI-powered insights that highlight key trends and anomalies. The platform encompasses various analytical components, including Experience Analytics, Experience Monitoring, Product Analytics, and Voice of Customer, creating a comprehensive ecosystem for understanding customer dynamics. Key features of Contentsquare include its ability to visualize user interactions in real-time, monitor website performance, and analyze product usage patterns. These features empower teams to pinpoint areas of friction within the customer journey, enabling them to implement targeted improvements. Additionally, the Voice of Customer functionality allows businesses to gather and analyze customer feedback, further enriching the understanding of user needs and preferences. By leveraging these insights, organizations can reduce customer frustration, enhance satisfaction, and foster long-term loyalty. In summary, Contentsquare stands out in the experience intelligence category by offering a holistic approach to understanding customer behavior. Its combination of advanced analytics, AI-driven insights, and user-friendly visualizations equips teams with the tools they need to optimize digital experiences effectively. As businesses continue to navigate the complexities of customer engagement, Contentsquare provides a robust solution for driving meaningful improvements and achieving strategic objectives.

Average Rating: 4.6/5.0

Total Reviews: 631

How Do G2 Users Rate Contentsquare?

  • Data Quantification: 9.0/10 (Category avg: 8.6/10)
  • Monitoring: 8.9/10 (Category avg: 8.8/10)
  • Has the product been a good partner in doing business?: 9.2/10 (Category avg: 9.2/10)
  • Webpage Element Analysis: 9.2/10 (Category avg: 8.8/10)

Who Is the Company Behind Contentsquare?

  • Seller: Contentsquare
  • Company Website:
  • Year Founded: 2012
  • HQ Location: Paris
  • Twitter: @Contentsquare
    6,548 Twitter followers
  • LinkedIn® Page: www.linkedin.com
    1,687 employees on LinkedIn®

Who Uses This Product?

  • Who Uses This: Digital Analyst, Digital Experience Manager
  • Top Industries: Retail, Apparel & Fashion
  • Company Size: 45% Large, 33% Medium

What Do G2 Reviewers Say About Contentsquare?

AI-generated summary from verified user reviews

Pros
  • Users value the powerful insights from Contentsquare, enhancing customer journeys and driving digital marketing success.
  • Users value the effortless user behavior tracking and insightful analytics that drive data-informed decisions with Contentsquare.
  • Users find Contentsquare exceptionally easy to use, allowing seamless tracking and analysis of user behavior and engagement.
  • Users highly value the insightful customer understanding provided by Contentsquare, enhancing our eCommerce strategies effectively.
  • Users value the comprehensive journey analysis provided by Contentsquare, enhancing insights into customer behaviors and experiences.
Cons
  • Users find a lack of missing features for qualitative feedback integration and traffic analysis in Contentsquare.
  • Users find the complex features of Contentsquare overwhelming, complicating usability and setup for effective application.
  • Users find the implementation process challenging, especially when tracking additional data and managing URL mappings effectively.
  • Users find the steep learning curve of Contentsquare challenging, often requiring significant time and effort to master.
  • Users face a steep learning curve due to complex mappings and confusing UI, making mastery challenging.

What Are Recent G2 Reviews of Contentsquare?

What Are G2 Users Discussing About Contentsquare?

LogRocket

LogRocket is an AI session replay and product analytics tool that helps digital teams understand why users are having bad experiences and ship fixes more quickly. At the core of the platform is Galileo, LogRocket’s AI that continuously watches session replays from real users, reads support tickets, listens to customer calls, and tracks product changes to surface user struggles and technical issues automatically. LogRocket then routes these fixes into the development workflow (including AI coding tools such as Cursor and Claude Code) to help teams fix issues faster. LogRocket is used by engineers, product managers, and UX teams building web and mobile applications. Galileo surfaces issues proactively, so instead of going into the platform to look for problems, teams are alerted to what matters most and handed the context they need to act. Core capabilities include: - Session replay: Pixel-perfect recordings of user sessions captured alongside console logs, network requests, Redux state, and performance data, giving engineers the context needed to reproduce issues without guesswork. - Error and performance monitoring: Automatic capture of JavaScript errors, network failures, and performance degradation, surfaced alongside the session in which they occurred. - Product analytics: Funnel analysis, user segmentation, feature usage tracking, and retention metrics, built on the same session data used for debugging. - Workflow integrations: Connects with tools including Jira, GitHub, Datadog, and Intercom, routing issues identified in LogRocket into existing development and support workflows. - MCP server: Allows AI agents to connect directly to LogRocket, enabling them to watch real session replays and gain context on the user experience. LogRocket supports modern web frameworks, including React, Angular, and Vue, as well as native iOS and Android applications. LogRocket is shortening the distance between identifying a user problem and shipping a fix. The platform integrates with AI coding tools such as Cursor and Claude Code, allowing issues identified in the platform to be passed directly to an AI agent as a fully-loaded coding task, complete with session replay, error context, and reproduction steps.

Average Rating: 4.6/5.0

Total Reviews: 2,383

How Do G2 Users Rate LogRocket?

  • Data Quantification: 7.9/10 (Category avg: 8.6/10)
  • Monitoring: 8.9/10 (Category avg: 8.8/10)
  • Has the product been a good partner in doing business?: 9.1/10 (Category avg: 9.2/10)
  • Webpage Element Analysis: 8.3/10 (Category avg: 8.8/10)

Who Is the Company Behind LogRocket?

  • Seller: LogRocket, Inc.
  • Company Website:
  • Year Founded: 2016
  • HQ Location: Boston, Massachusetts
  • Twitter: @LogRocket
    14,756 Twitter followers
  • LinkedIn® Page: www.linkedin.com
    429 employees on LinkedIn®

Who Uses This Product?

  • Who Uses This: Software Engineer, CTO
  • Top Industries: Computer Software, Information Technology and Services
  • Company Size: 60% Small, 30% Medium

What Do G2 Reviewers Say About LogRocket?

AI-generated summary from verified user reviews

Pros
  • Users find Session Replay invaluable for understanding user interactions, enhancing troubleshooting and support effectiveness.
  • Users commend LogRocket's ease of use, ensuring quick integration and efficient troubleshooting for teams of all skill levels.
  • Users value the powerful insights from LogRocket, enhancing collaboration and streamlining the debugging process effectively.
  • Users appreciate the insightful user interactions tracking of LogRocket, enhancing their understanding of customer behavior.
  • Users value the searchable user behavior tracking in LogRocket, enhancing troubleshooting and improving product quality.
Cons
  • Users often face unavailability of sessions, making it difficult to verify actions taken during use.
  • Users find the missing features of LogRocket limiting, particularly regarding location-specific session management and network tracking.
  • Users find filtering issues in LogRocket, making it difficult to query elements by ids or classes effectively.
  • Users find LogRocket's pricing to be expensive, especially when compared to free self-hosted alternatives.
  • Users find search difficulty challenging, as tracking user clicks and time ranges complicates the overall experience.

What Are Recent G2 Reviews of LogRocket?

Fullstory

Fullstory is a behavioral data and analytics platform that helps technology leaders and digital experience teams understand their digital story so they can drive better digital experiences. Customer-centric enterprises rely on Fullstory to uncover and eliminate the friction buried between clicks and across workflows, turning frustrated visitors and employees into unwavering advocates. From proactively highlighting areas for optimization to triggering real-time personalization that genuinely resonates, Fullstory’s behavioral data with agentic AI provides deeper and more immediately actionable insights beyond conventional web and product analytics. While other tools require extensive manual tagging that can lead to missed insights, Fullstory automatically collects, structures, and enriches the full spectrum of behavioral data from digital activities. Diagnostics on what users play and pause, what they copy and paste, where they zoom in & out, what apps are in use, then translates those behaviors into actions, insights, and recommendations, all aiding to improve customer and employee journeys. Agentic AI proactively highlights issues and provides recommendations to eliminate gaps in the digital experience, driving improved business outcomes. With a deeper understanding of customer and employee journeys, Fullstory provides the context needed to improve digital experiences, accelerate decision-making, and create human-centered experiences that drive revenue and reduce spend, faster.

Average Rating: 4.5/5.0

Total Reviews: 1,033

How Do G2 Users Rate Fullstory?

  • Data Quantification: 8.1/10 (Category avg: 8.6/10)
  • Monitoring: 8.7/10 (Category avg: 8.8/10)
  • Has the product been a good partner in doing business?: 9.0/10 (Category avg: 9.2/10)
  • Webpage Element Analysis: 8.7/10 (Category avg: 8.8/10)

Who Is the Company Behind Fullstory?

  • Seller: Fullstory
  • Company Website:
  • Year Founded: 2014
  • HQ Location: Atlanta, GA
  • Twitter: @fullstory
    4,890 Twitter followers
  • LinkedIn® Page: www.linkedin.com
    559 employees on LinkedIn®

Who Uses This Product?

  • Who Uses This: Product Manager, Senior Product Manager
  • Top Industries: Computer Software, Information Technology and Services
  • Company Size: 44% Medium, 37% Small

What Do G2 Reviewers Say About Fullstory?

AI-generated summary from verified user reviews

Pros
  • Users appreciate the intuitive UI of Fullstory, finding it easy to use and effective for analytics tasks.
  • Users appreciate the intuitive UI of Fullstory, which simplifies dashboard setup and enhances usability significantly.
  • Users commend Fullstory's top-notch customer support, enhancing confidence and ease of use for analytics and insights.
  • Users value the ease of use and insightful analytics from Fullstory, enhancing their understanding of user behavior.
  • Users value the robust data analytics in FullStory, providing deep insights into customer behavior and experiences.
Cons
  • Users note a significant learning curve with Fullstory, though support teams help navigate the complexities effectively.
  • Users find the lack of customization and difficult data sharing to be a significant limitation of Fullstory.
  • Users note the missing features in Fullstory that hinder effective user flow and functionality across applications.
  • Users find difficulty in data governance and customization, making it challenging to leverage Fullstory's full capabilities.
  • Users find the limited features of Fullstory restrict their ability to track user flows and share data effectively.

What Are Recent G2 Reviews of Fullstory?

What Are G2 Users Discussing About Fullstory?

Microsoft Clarity

Clarity is a free, easy-to-use tool that captures how real people actually use your site. Setup is easy, and you'll start getting data in minutes. With advanced heatmaps, session recordings, and powerful user insights you will be able to get a deep understanding of user behavior on your website or mobile app. Experience a game-changing addition of Copilot in Microsoft Clarity. This cutting-edge artificial intelligence feature generates key session takeaways in natural language, saving you time and boosting productivity. Microsoft Clarity features include: Instant heatmaps, session recordings, powerful insights, Google Analytics integration, mobile sdk, and Copilot.

Average Rating: 4.5/5.0

Total Reviews: 55

How Do G2 Users Rate Microsoft Clarity?

  • Data Quantification: 7.8/10 (Category avg: 8.6/10)
  • Monitoring: 8.6/10 (Category avg: 8.8/10)
  • Has the product been a good partner in doing business?: 9.4/10 (Category avg: 9.2/10)
  • Webpage Element Analysis: 8.3/10 (Category avg: 8.8/10)

Who Is the Company Behind Microsoft Clarity?

  • Seller: Microsoft
  • Year Founded: 1975
  • HQ Location: Redmond, Washington
  • Twitter: @microsoft
    13,091,739 Twitter followers
  • LinkedIn® Page: www.linkedin.com
    231,632 employees on LinkedIn®
  • Ownership: MSFT

Who Uses This Product?

  • Top Industries: Information Technology and Services, Computer Software
  • Company Size: 64% Small, 25% Medium

What Do G2 Reviewers Say About Microsoft Clarity?

AI-generated summary from verified user reviews

Pros
  • Users appreciate the clear and visual insights from Microsoft Clarity that enhance understanding of user behavior effectively.
  • Users appreciate the convenient and friendly interface of Microsoft Clarity, enhancing their overall experience effortlessly.
  • Users appreciate the clear visual insights provided by Microsoft Clarity, enhancing understanding of user behavior and intent.
  • Users value the clear visual insights from session recordings in Microsoft Clarity, enhancing understanding of user behavior.
  • Users value the user behavior tracking in Microsoft Clarity, enabling them to quickly identify and resolve usability issues.
Cons
  • Users find the filtering issues in Microsoft Clarity cumbersome, affecting the precision and ease of analysis.
  • Users find limited analysis capabilities in Microsoft Clarity, lacking depth in reporting and advanced user journey mapping.
  • Users find the limited reporting capabilities of Microsoft Clarity restricts deeper insights for effective analysis.
  • Users report encountering recording issues that hinder analysis of user interactions and cause delays.
  • Users find the customization difficulty in Clarity limits their ability to tailor reports to specific needs effectively.

What Are Recent G2 Reviews of Microsoft Clarity?

What Are G2 Users Discussing About Microsoft Clarity?

Glassbox

Glassbox is a customer intelligence and digital experience analytics platform designed to help enterprises understand, optimize, and enhance the customer experience and digital accessibility of their digital channels. One of the standout features of Glassbox is its capability to securely capture 100% of user sessions across both web and mobile applications. This end-to-end visibility allows teams to analyze every step of the customer journey, effectively pinpointing friction points and enabling real-time action. By utilizing advanced artificial intelligence, Glassbox captures and analyzes data from every online interaction, providing businesses with a comprehensive view of customer behavior and preferences. This wealth of data empowers organizations to act swiftly, transforming raw data into actionable insights that improve both the customer experience and the conversion rate. Large global enterprises in sectors such as finance, insurance, and healthcare, Glassbox serves as a vital tool for uncovering the root causes of customer challenges. It assists organizations in remediating customer experience issues and creating digital journeys that are inclusive, seamless, and engaging. The platform’s AI-powered insights not only enhance accessibility monitoring but also incorporate fraud prevention capabilities, giving organizations the agility to respond to issues within minutes and adapt to the evolving needs of their customers. Glassbox has been recognized by G2 as a leader in customer intelligence solutions and product analytics, reflecting its effectiveness in delivering the clarity and confidence that enterprises require. By providing a robust framework for creating compliant, accessible, and impactful digital experiences, Glassbox stands out in its category, offering unique selling points that cater to the diverse needs of its users. With its focus on data-driven decision-making and customer-centric strategies, Glassbox is positioned as a crucial ally for organizations aiming to thrive in the digital landscape.

Average Rating: 4.9/5.0

Total Reviews: 788

How Do G2 Users Rate Glassbox?

  • Data Quantification: 9.9/10 (Category avg: 8.6/10)
  • Monitoring: 9.9/10 (Category avg: 8.8/10)
  • Has the product been a good partner in doing business?: 9.9/10 (Category avg: 9.2/10)
  • Webpage Element Analysis: 9.9/10 (Category avg: 8.8/10)

Who Is the Company Behind Glassbox?

  • Seller: Glassbox
  • Company Website:
  • Year Founded: 2010
  • HQ Location: London
  • Twitter: @GlassboxDigital
    1,803 Twitter followers
  • LinkedIn® Page: www.linkedin.com
    280 employees on LinkedIn®

Who Uses This Product?

  • Who Uses This: Digital Analyst, Product Owner
  • Top Industries: Financial Services, Insurance
  • Company Size: 77% Large, 18% Medium

What Do G2 Reviewers Say About Glassbox?

AI-generated summary from verified user reviews

Pros
  • Users value the ease of use of Glassbox, enabling immediate access to insights for timely decision-making.
  • Users find the session replay feature invaluable for resolving customer issues and improving overall experience effectively.
  • Users value the immediate insights from Glassbox, enabling timely interventions and identification of revenue opportunities.
  • Users find the visibility into customer interactions with Glassbox invaluable for troubleshooting and enhancing user experience.
  • Users value Glassbox for its exceptional customer understanding, enabling effective troubleshooting and validation of customer information.
Cons
  • Users are frustrated by session issues, including split links, limited history access, and slow query responses.
  • Users find the navigation icons unintuitive, leading to confusion when navigating the Glassbox interface.
  • Users report session management issues such as slow loading times and frequent session expirations that hinder usability.
  • Users find the learning curve steep, requiring additional training and better documentation to effectively navigate Glassbox.
  • Users desire improved customization options in reporting and funnel creation within Glassbox for enhanced functionality.

What Are Recent G2 Reviews of Glassbox?

What Are G2 Users Discussing About Glassbox?

Lucky Orange

Lucky Orange’s powerful suite of website analytics tools including website heatmaps and session recordings coupled with its Discovery AI assistant make it easy to pinpoint opportunities to optimize your website. Making sense of your website analytics has never been easier thanks to Lucky Orange’s Discovery AI. You don’t have to spend weeks figuring out how to use a new website analytics platform. Simply start asking Discovery questions about your website performance, such as which traffic source drives the most conversions, what pages have the highest visitor frustration or what do customers who don’t convert have in common. Discovery will give you answers to all of these questions and more based on actual visitor interactions with your website. It will guide you to different tools inside Lucky Orange, like dynamic heatmaps, session recordings, funnels and more, where you can see examples of these visitor interactions for yourself. This software is particularly beneficial for website owners, agencies, digital marketers, and e-commerce businesses seeking to improve their conversion rates. With over half a million websites utilizing its features, Lucky Orange serves a diverse audience, from digital agencies to small startups to large enterprises. Lucky Orange is a Shopify Plus certified partner and offers 1-click installation through Shopify It’s also available on the BigCommerce, Wordpress and Square marketplaces. The platform is designed to address specific use cases, such as analyzing user behavior, reducing cart abandonment, and optimizing website performance.One of the standout features of Lucky Orange is its Session Recordings and Dynamic Heatmaps, which allow users to visualize how visitors interact with their website. By tracking clicks, scrolls, and taps, users can pinpoint obstacles that may hinder conversions. The Optimizable Segments feature enables businesses to focus on individual visitor journeys, providing insights into the experiences of frustrated or confused users. A newly added Optimizable Segment for AI Referrals lets you quickly find sessions where visitors came to your site from popular AI search engines like Google Gemini, OpenAI's ChatGPT, Perplexity, Claude and Microsoft Co-Pilot. Additionally, Dynamic Heatmaps offer a broader perspective on overall engagement, helping businesses understand which elements attract attention and which do not. The Scroll Heatmap feature further assists in determining whether visitors are scrolling down far enough to encounter key calls to action. To combat cart abandonment, Lucky Orange integrates Surveys, Announcements and Live Chat functionality, allowing businesses to engage with visitors in real-time. If a visitor appears to be struggling, the Live Chat feature enables immediate assistance, potentially guiding them toward a purchase. The Announcements tool enhances this capability by allowing users to create pop-ups for upsell opportunities, discounts, or product reviews, fostering a more interactive shopping experience. Users can also survey customers to learn first-hand the reasons keeping them from converting. Furthermore, the Page Insights feature provides critical performance metrics for each page on a website. By highlighting visitor frustration events and user engagement levels, businesses can quickly identify bottlenecks in user experience. The activity snapshot includes essential statistics such as bounces, unique visitors, and form submissions, enabling users to compare performance over various timeframes. This comprehensive data empowers businesses to make informed decisions and implement targeted strategies for improvement.

Average Rating: 4.6/5.0

Total Reviews: 378

How Do G2 Users Rate Lucky Orange?

  • Data Quantification: 8.2/10 (Category avg: 8.6/10)
  • Monitoring: 9.0/10 (Category avg: 8.8/10)
  • Has the product been a good partner in doing business?: 9.2/10 (Category avg: 9.2/10)
  • Webpage Element Analysis: 8.5/10 (Category avg: 8.8/10)

Who Is the Company Behind Lucky Orange?

  • Seller: Lucky Orange
  • Company Website:
  • Year Founded: 2012
  • HQ Location: Overland Park, KS
  • Twitter: @luckyorange
    10,607 Twitter followers
  • LinkedIn® Page: www.linkedin.com
    23 employees on LinkedIn®

Who Uses This Product?

  • Who Uses This: Owner, CEO
  • Top Industries: Retail, Marketing and Advertising
  • Company Size: 82% Small, 13% Medium

What Do G2 Reviewers Say About Lucky Orange?

AI-generated summary from verified user reviews

Pros
  • Users value the insightful analytics from Lucky Orange, enhancing website performance and improving customer experiences effectively.
  • Users value the Session Replay feature of Lucky Orange for enhancing website analysis and user experience improvement.
  • Users commend the easy setup of Lucky Orange, finding it convenient and straightforward for enhancing customer engagement.
  • Users find the heatmap feature in Lucky Orange invaluable for understanding customer behavior and improving user experience.
  • Users love the ease of use of Lucky Orange, providing clear insights into customer behavior without complexity.
Cons
  • Users face recording issues with navigation, data loading, and playback options, leading to a frustrating experience.
  • Users find Lucky Orange too expensive for small businesses and beginners needing essential customer insights.
  • Users are frustrated by the limitations of the free plan, restricting functionality and data retention capabilities.
  • Users highlight plan limitations with Lucky Orange, especially regarding unexpected tier upgrades and restrictions on free plans.
  • Users experience slow loading times for the heatmap feature, impacting their overall satisfaction with Lucky Orange.

What Are Recent G2 Reviews of Lucky Orange?

What Are G2 Users Discussing About Lucky Orange?
Hotjar by Contentsquare

Hotjar by Contentsquare is a digital experience insights platform designed to help individuals, startups, and growing businesses understand what their website or web app visitors are doing — and why. Trusted by over 1 million websites across 180+ countries, it is the go-to behavior analytics tool for teams who want fast, actionable insights without needing a data analyst or a complex setup. At the core of the platform are three product areas: Observe, Ask, and Engage. Observe tools — including Heatmaps and Session Recordings — let you see exactly how users interact with your website. Heatmaps visualize where people click, scroll, and move, helping you spot areas of friction or missed opportunity at a glance. Session Recordings capture real user journeys so you can watch individual visits, identify behavior trends, and uncover bugs with console tracking. Ask tools — including Surveys and a Feedback Widget — bring the voice of your customers directly into the product experience. Run on-site or external surveys, trigger them at the right moment in the user journey, and choose from 30+ pre-built templates covering topics like churn, NPS, product satisfaction, and content relevance. Engage streamlines the entire user research process from end to end: recruit participants, schedule sessions, conduct interviews, and get automatic recordings and transcripts — all in one place. What sets Hotjar by Contentsquare apart is its combination of depth and simplicity. The tools are intuitive enough for marketers, designers, and product managers to use independently, yet powerful enough to surface meaningful insights that drive real decisions. Hotjar complements your existing analytics stack — tools like Google Analytics or Mixpanel — by adding the qualitative layer that explains the numbers.

Average Rating: 4.3/5.0

Total Reviews: 332

How Do G2 Users Rate Hotjar by Contentsquare?

  • Data Quantification: 8.1/10 (Category avg: 8.6/10)
  • Monitoring: 8.7/10 (Category avg: 8.8/10)
  • Has the product been a good partner in doing business?: 8.7/10 (Category avg: 9.2/10)
  • Webpage Element Analysis: 8.9/10 (Category avg: 8.8/10)

Who Is the Company Behind Hotjar by Contentsquare?

  • Seller: Contentsquare
  • Year Founded: 2012
  • HQ Location: Paris
  • Twitter: @Contentsquare
    6,548 Twitter followers
  • LinkedIn® Page: www.linkedin.com
    1,687 employees on LinkedIn®

Who Uses This Product?

  • Who Uses This: Product Manager, Digital Marketing Specialist
  • Top Industries: Marketing and Advertising, Computer Software
  • Company Size: 52% Small, 37% Medium

What Do G2 Reviewers Say About Hotjar by Contentsquare?

AI-generated summary from verified user reviews

Pros
  • Users find Hotjar's interface easy to use, appreciating its clear insights into user interactions and UX improvements.
  • Users value Hotjar's clear user interaction insights through heatmaps, enhancing understanding of UX across devices.
  • Users value the clear overview of user interactions provided by Hotjar's heatmaps, enhancing their understanding of UX issues.
  • Users find Hotjar incredibly helpful for understanding user interactions, allowing for quick identification and resolution of UX issues.
  • Users value the session replay feature of Hotjar for its intuitive insights into user interactions and UX improvements.
Cons
  • Users find the analytics features limited and encounter issues with session recording quotas and data filtering.
  • Users experience missing features with Hotjar, particularly in heatmaps and advanced analytics capabilities.
  • Users find the difficult filtering of session recordings can hinder detailed analysis and cause frustration during reviews.
  • Users find the pricing expensive, especially as costs rise with increased usage and the need for multiple features.
  • Users face filtering issues with Hotjar, as advanced options are needed for better data management.

What Are Recent G2 Reviews of Hotjar by Contentsquare?

What Are G2 Users Discussing About Hotjar by Contentsquare?

Heatmap

Heatmap is the premier on-site behavioral analytics platform for ecommerce. It uniquely links user behavior to revenue, showing brands exactly where they're losing or making money and how to optimize for maximum profit.

Average Rating: 4.8/5.0

Total Reviews: 43

How Do G2 Users Rate Heatmap?

  • Data Quantification: 9.3/10 (Category avg: 8.6/10)
  • Monitoring: 9.3/10 (Category avg: 8.8/10)
  • Has the product been a good partner in doing business?: 8.8/10 (Category avg: 9.2/10)
  • Webpage Element Analysis: 9.2/10 (Category avg: 8.8/10)

Who Is the Company Behind Heatmap?

  • Seller: HeatMap
  • Year Founded: 2023
  • HQ Location: New York City, US
  • Twitter: @heatmapme
    887 Twitter followers
  • LinkedIn® Page: www.linkedin.com
    34 employees on LinkedIn®

Who Uses This Product?

  • Top Industries: Food & Beverages, Marketing and Advertising
  • Company Size: 67% Small, 30% Medium

What Do G2 Reviewers Say About Heatmap?

AI-generated summary from verified user reviews

Pros
  • Users value the insightful visual data provided by Heatmap, enhancing customer experience and operational efficiency effortlessly.
  • Users value the ease of use of the Heatmap, finding it simple to implement and interpret data quickly.
  • Users commend the quick and effective customer support of Heatmap, enhancing their experience and customization needs.
  • Users value the visual clarity and training benefits from session recordings provided by Heatmap, enhancing their understanding of customer behavior.
  • Users appreciate the easy setup of Heatmap, enabling quick implementation and understanding of user engagement.
Cons
  • Users note filtering issues with Heatmap, wishing for more advanced segmentation options and custom filters.
  • Users find the limited reporting options insufficient for their needs, requiring custom solutions for specific data tracking.
  • Users find dashboard customizability lacking, making it hard to track specific metrics without additional effort.
  • Users find export limitations minor but acknowledge they require extra steps for detailed visualizations and niche analysis.
  • Users find the limited features of Heatmap challenge their reporting needs and fail to cater to diverse client demands.

What Are Recent G2 Reviews of Heatmap?

What Are G2 Users Discussing About Heatmap?

Mouseflow

Mouseflow: Affordable Behavioral Analytics for UX Friction & CRO Mouseflow is the intuitive and affordable behavioral analytics platform that cuts the fluff to reveal the truth behind user behavior. We empower businesses with data-driven behavioral analytics, helping brands like eCommerce, SaaS, and enterprise brands understand why visitors are struggling, turning complex data into actionable insights that drive revenue and growth. Since essential tools like heatmaps and friction detection come out-of-the-box, you don't need an engineering degree to get quick value. How Mouseflow Helps You Optimize Faster: We’re here to toughen up your website – and your bottom line. • Automated UX Friction Detection Detect and fix conversion killers automatically with +7 friction events and our Friction Score—focus on changes that truly matter. • Affordable User Journey Mapping Analyze effortlessly how users move from, to, and between any page. Stop struggling to track user paths; we help you give them a shortcut to checkout. • Session Replays that Listen Watch user journeys unfold with session replays to see the truth behind clicks and turn data into powerful solutions. • Heatmaps Built for Scale Get 7 types of heatmaps, generated automatically for every page. This visibility is provided right out-of-the-box. • Conversion Funnels, Forms, & Analytics Pinpoint exact drop-off points using funnels and form analytics to increase conversions. • Real-Time Feedback Campaigns Understand visitor intent by asking the right questions at the right time. • Advanced Filtering, Segmentation, and Customization Advanced filtering and segmentation is available in every plan, supporting your experimentation roadmaps with the precision you need. Mouseflow is trusted by 210,000+ teams to analyze millions of visitor sessions, unlocking the fastest path to growth. We believe in making analytics approachable and fun, packed with “aha” moments. Are you ready to reveal the truth behind your user experience?

Average Rating: 4.6/5.0

Total Reviews: 688

How Do G2 Users Rate Mouseflow?

  • Data Quantification: 8.2/10 (Category avg: 8.6/10)
  • Monitoring: 8.7/10 (Category avg: 8.8/10)
  • Has the product been a good partner in doing business?: 8.9/10 (Category avg: 9.2/10)
  • Webpage Element Analysis: 8.4/10 (Category avg: 8.8/10)

Who Is the Company Behind Mouseflow?

  • Seller: Mouseflow
  • Company Website:
  • Year Founded: 2010
  • HQ Location: Copenhagen, Denmark
  • Twitter: @mouseflow
    1,736 Twitter followers
  • LinkedIn® Page: www.linkedin.com
    55 employees on LinkedIn®

Who Uses This Product?

  • Who Uses This: CEO, Owner
  • Top Industries: Marketing and Advertising, Computer Software
  • Company Size: 68% Small, 23% Medium

What Do G2 Reviewers Say About Mouseflow?

AI-generated summary from verified user reviews

Pros
  • Users love the ease of use of Mouseflow, facilitating insightful analytics and quick adjustments for effective marketing strategies.
  • Users value the easy qualitative insights from Mouseflow, significantly enhancing marketing analytics and user engagement strategies.
  • Users value the insightful heatmaps of Mouseflow, enhancing understanding of user behavior and driving conversions.
  • Users love the Session Replay feature of Mouseflow for gaining insights into user behavior and improving engagement.
  • Users find the easy setup of Mouseflow beneficial, enabling quick integration and effective tracking of user behavior.
Cons
  • Users find the missing features in Mouseflow limiting, especially regarding its outdated plugins and survey options.
  • Users face limitations in plugin updates and features, affecting overall functionality and user experience with Mouseflow.
  • Users find Mouseflow to be expensive, especially for small businesses with limited budgets and traffic volumes.
  • Users report data inaccuracy in Mouseflow, citing issues with loading and discrepancies in click tracking.
  • Users experience filtering issues in Mouseflow, making it difficult to navigate and locate important session recordings.

What Are Recent G2 Reviews of Mouseflow?

What Are G2 Users Discussing About Mouseflow?

Plerdy

Plerdy CRO, SEO & A/B Testing Tools — a powerful toolkit designed to enhance conversions, refine user experience, and optimize your online store’s performance. 🚀 A/B Testing Tool With Plerdy's A/B Testing Tool, you can test variations of your website’s elements effortlessly. It’s ideal for e-commerce and online businesses that want to improve user interactions and increase conversions. Set up A/B tests quickly, check real-time data, and use insights to make informed, data-backed decisions. 🔥 Heatmaps Plerdy's dynamic heatmaps give you a detailed view of how users interact with your website. Track scroll depth, cursor movement, clicks, and even text selection. This breakdown by traffic source or device helps you fine-tune usability and increase engagement. 💬 Pop-Up Forms & NPS Plerdy’s customizable pop-up forms help you engage with your audience. Capture feedback, gather leads, or share targeted messages with over 25 customization options. Create engaging experiences by tailoring forms to different segments, helping boost your connection with users. 🔍 SEO Checker Boost your SEO without impacting your website’s loading speed. Plerdy’s SEO Checker offers daily automated audits, comprehensive reports, and insights aligned with Google’s mobile-first indexing. This tool lets you stay updated on SEO status, visibility, and site performance improvements. 🎥 Session Replay Understand user journeys better with Plerdy’s session replay. View actual user interactions, segment recordings by traffic channels or devices, and reveal insights that can help refine the user experience across your website. 📊 Conversion Rate and Events Track key events automatically with Plerdy’s conversion tools. Build conversion funnels, identify drop-off points, and take steps to optimize the user journey, leading to higher conversions and an improved overall experience. 💼 Sales Performance (E-commerce Tracking) For e-commerce businesses, Plerdy’s sales performance tracking reveals how users interact with your products. Spot non-performing items and adjust your strategy to maximize sales and profitability. 🛠 Customization and Integration Plerdy is designed to fit into your existing systems seamlessly. Customize the tools according to your needs and integrate them with your workflows, ensuring an efficient optimization process. With Plerdy, you get all the essentials to elevate your site’s performance, boost conversions, and improve SEO. Try these tools to better understand user behavior and make data-driven improvements. 🌟

Average Rating: 4.7/5.0

Total Reviews: 317

How Do G2 Users Rate Plerdy?

  • Data Quantification: 9.1/10 (Category avg: 8.6/10)
  • Monitoring: 9.2/10 (Category avg: 8.8/10)
  • Has the product been a good partner in doing business?: 9.5/10 (Category avg: 9.2/10)
  • Webpage Element Analysis: 9.3/10 (Category avg: 8.8/10)

Who Is the Company Behind Plerdy?

  • Seller: Plerdy
  • Year Founded: 2017
  • HQ Location: Lviv, Lvivska
  • Twitter: @plerdy_com
    111 Twitter followers
  • LinkedIn® Page: www.linkedin.com
    13 employees on LinkedIn®

Who Uses This Product?

  • Who Uses This: Owner, CEO
  • Top Industries: Marketing and Advertising, Information Technology and Services
  • Company Size: 90% Small, 6% Medium

What Do G2 Reviewers Say About Plerdy?

AI-generated summary from verified user reviews

Pros
  • Users love the insights from heatmaps in Plerdy, finding it a valuable resource for visitor behavior analysis.
  • Users find Plerdy's ease of use exceptional, with intuitive features streamlining website optimization effortlessly.
  • Users value Plerdy for its deep insights into user behavior, enhancing website optimization and overall experience.
  • Users value the comprehensive SEO optimization features of Plerdy, enhancing their understanding of user behavior effectively.
  • Users find Plerdy's easy setup process smooth and appreciate the responsive support provided when needed.
Cons
  • Users find the learning curve steep due to numerous features and overwhelming dashboard, complicating navigation initially.
  • Users find Plerdy's steep learning curve challenging, especially with advanced features and a busy dashboard.
  • Users find the complexity of Plerdy challenging due to its multitude of features and less intuitive interface.
  • Users desire a smoother and simpler interface for Plerdy, as current UI choices can be puzzling.
  • Users find Plerdy's interface not intuitive, with a busy dashboard and features that require effort to understand.

What Are Recent G2 Reviews of Plerdy?

What Are G2 Users Discussing About Plerdy?

Smartlook

Smartlook is an analytics solution for websites, iOS/Android apps, and various app frameworks, that answers the "whys" behind your users' actions. Learn more about our features ↩️ Brands can easily understand how customers precisely interact with their website and app by: - Watching recordings of every user, and seeing exactly what they see, down to the same resolution. - Using automatically tracked events generated within the website/app, from tapping a button to typing text. - Building conversion funnels and finding out where most of their users are leaving the website/app (and seeing what they did before they left). - Creating heatmaps of visitors’ clicks, scrolls, and moves, to highlight popular elements. Smartlook cuts out all the guesswork and gathers brands’ app data together on one central dashboard, which enables sharing and collaborating with colleagues. This means clear, data-driven decision-making for product managers, marketers, UX designers, and developers to constantly improve each website and app by reducing churn rates, boosting conversions, identifying and fixing bugs, and improving UX.

Average Rating: 4.6/5.0

Total Reviews: 837

How Do G2 Users Rate Smartlook?

  • Data Quantification: 8.5/10 (Category avg: 8.6/10)
  • Monitoring: 9.0/10 (Category avg: 8.8/10)
  • Has the product been a good partner in doing business?: 9.0/10 (Category avg: 9.2/10)
  • Webpage Element Analysis: 8.7/10 (Category avg: 8.8/10)

Who Is the Company Behind Smartlook?

  • Seller: Cisco
  • Year Founded: 1984
  • HQ Location: San Jose, CA
  • Twitter: @Cisco
    720,366 Twitter followers
  • LinkedIn® Page: www.linkedin.com
    95,545 employees on LinkedIn®
  • Ownership: NASDAQ:CSCO

Who Uses This Product?

  • Who Uses This: CEO, Owner
  • Top Industries: Computer Software, Marketing and Advertising
  • Company Size: 85% Small, 12% Medium

What Do G2 Reviewers Say About Smartlook?

AI-generated summary from verified user reviews

Pros
  • Users praise the analytics capabilities of Smartlook, especially for visualizing user behavior and enhancing decision-making.
  • Users appreciate the ease of use of Smartlook, highlighting its intuitive interface and effective analytics tools.
  • Users appreciate the intuitive interface and custom dashboards of Smartlook, enhancing focus on key metrics and user behavior.
  • Users praise the clean and attractive interface of Smartlook, enhancing navigation and focusing on essential metrics.
  • Users value the affordable pricing of Smartlook, especially appreciating the useful free plan for trials.
Cons
  • Users find the cluttered interface can be overwhelming, hindering the overall user experience with Smartlook.
  • Users find the complex features of Smartlook, like creating heat maps, challenging and restricting for free plans.
  • Users often experience dashboard issues, such as an overloaded interface and occasional visual glitches, affecting usability.
  • Users are frustrated by the limited 1-month data retention and difficulties in creating and maintaining heat maps.
  • Users find the delays in tracking record duration and heat map creation hinder their experience with Smartlook.

What Are Recent G2 Reviews of Smartlook?

What Are G2 Users Discussing About Smartlook?

Silktide

Silktide is an all-in-one platform for analyzing and improving websites. It combines tools for accessibility, content quality, marketing performance, legal compliance, and user behavior—making it easier for organizations to understand and enhance their entire web presence from one place. Silktide automatically scans your website and highlights issues across a wide range of areas: from broken links and slow-loading pages to inaccessible design elements, outdated content, and poor SEO. It also checks for GDPR compliance, cookie notices, and mobile responsiveness—giving teams a complete picture of what needs fixing, and how to fix it. Used by governments, universities, enterprises, and more, Silktide makes complex web standards easier to manage. Everyone from developers to marketers can see what matters to them via intuitive dashboards, role-specific recommendations, and scheduled reporting. Key features include: * Accessibility testing based on WCAG standards, with visual guides and easy-to-follow fixes * Content optimization covering spelling, grammar, readability, and link quality * SEO and marketing audits for metadata, discoverability, and keyword usage * Heatmaps and analytics to track how users interact with your pages—from clicks to scroll depth (requires installing a tracking script) * Performance insights around speed, mobile usability, and UX quality * Legal and compliance checks, including cookie notices and HTML validity Silktide also offers tools for workflow management, task assignment, and trend tracking, so teams can collaborate and demonstrate improvement over time. Most of the platform runs directly in the browser—setup is minimal, with just a small code snippet to be added to your site if you use our analytics and heatmaps functionality. Whether you run one website or manage hundreds, Silktide helps you understand what’s working, what isn’t, and how to make it better.

Average Rating: 4.8/5.0

Total Reviews: 283

How Do G2 Users Rate Silktide?

  • Data Quantification: 8.8/10 (Category avg: 8.6/10)
  • Monitoring: 9.3/10 (Category avg: 8.8/10)
  • Has the product been a good partner in doing business?: 9.7/10 (Category avg: 9.2/10)
  • Webpage Element Analysis: 9.3/10 (Category avg: 8.8/10)

Who Is the Company Behind Silktide?

  • Seller: Silktide
  • Company Website:
  • Year Founded: 2001
  • HQ Location: United Kingdom
  • LinkedIn® Page: www.linkedin.com
    62 employees on LinkedIn®

Who Uses This Product?

  • Who Uses This: Web Developer
  • Top Industries: Government Administration, Higher Education
  • Company Size: 44% Large, 35% Medium

What Do G2 Reviewers Say About Silktide?

AI-generated summary from verified user reviews

Pros
  • Users find Silktide's ease of use exceptional, benefiting from its intuitive interface and comprehensive support resources.
  • Users highly value the ease of use and effectiveness of Silktide in improving accessibility on their websites.
  • Users value the robust accessibility features of Silktide, facilitating significant improvements in website compliance and ease of use.
  • Users commend Silktide's exceptional customer support, particularly appreciating the guidance from dedicated team members like Chris and Susan.
  • Users praise the exceptional support from Silktide's team, significantly enhancing their experience and accessibility outcomes.
Cons
  • Users find the complex usability of Silktide can be daunting, requiring time and additional workflow adjustments.
  • Users note a limited features set in Silktide, wishing for more specialized options like an Accessibility-only module.
  • Users express concerns about missing features, including inadequate notifications and limited dashboard customization options.
  • Users report a lack of clarity in communication and settings, impacting efficiency and overall experience with Silktide.
  • Users find the difficult navigation in Silktide can complicate their experience and hinder effective usage.

What Are Recent G2 Reviews of Silktide?

What Are G2 Users Discussing About Silktide?

Yandex.Metrica

Yandex.Metrica is a comprehensive and free web analytics service developed by Yandex, designed to help website owners and marketers gain deep insights into user behavior and site performance. By implementing a simple JavaScript tag on their websites, users can collect detailed data on audience demographics, traffic sources, and user interactions, enabling data-driven decisions to enhance user experience and optimize conversion rates. Key Features and Functionality: - Session Replay: Allows viewing of individual user sessions to understand navigation patterns and identify usability issues. - Heatmaps: Visual representations of user clicks, scrolls, and mouse movements to highlight areas of interest and potential improvement. - Form Analytics: Analyzes user interactions with forms to detect drop-off points and optimize form completion rates. - Real-Time Data: Provides up-to-the-minute reporting on website traffic and user behavior. - Advanced Segmentation: Enables filtering and analysis of specific visitor cohorts based on behavior, traffic sources, device types, and custom parameters. - Integration with Yandex.Direct: Links with Yandex's advertising platform to track ad performance and conversion rates. Primary Value and Solutions Provided: Yandex.Metrica addresses the critical need for detailed behavioral analytics by offering tools that go beyond traditional metrics. It helps businesses identify friction points in user journeys, understand content effectiveness, and test site changes through features like heatmaps and session replays. By providing these insights without traffic volume limitations or usage-based pricing restrictions, Yandex.Metrica empowers organizations to make informed optimizations that enhance user engagement and drive business growth.

Average Rating: 4.2/5.0

Total Reviews: 34

How Do G2 Users Rate Yandex.Metrica?

  • Data Quantification: 8.0/10 (Category avg: 8.6/10)
  • Monitoring: 8.8/10 (Category avg: 8.8/10)
  • Has the product been a good partner in doing business?: 8.2/10 (Category avg: 9.2/10)
  • Webpage Element Analysis: 8.3/10 (Category avg: 8.8/10)

Who Is the Company Behind Yandex.Metrica?

  • Seller: Yandex Ads
  • Year Founded: 2004
  • HQ Location: Dubai
  • LinkedIn® Page: www.linkedin.com
    18 employees on LinkedIn®
  • Ownership: AppMetrica
  • Total Revenue (USD mm): $218,344

Who Uses This Product?

  • Top Industries: Marketing and Advertising
  • Company Size: 68% Small, 24% Medium

What Do G2 Reviewers Say About Yandex.Metrica?

AI-generated summary from verified user reviews

Pros
  • Users find the ease of use of Yandex.Metrica remarkable, enabling quick setup and intuitive insights for improving UX.
  • Users find the easy setup of Yandex.Metrica quick and effortless, enabling immediate data flow for analysis.
  • Users love the Session Replay and Heatmaps of Yandex.Metrica, enhancing UX and boosting conversion rates effortlessly.
  • Users value the easy charts in Yandex.Metrica, simplifying data visualization for online business setups.
  • Users value the clarity of Heatmaps in identifying click areas, enhancing user experience and improving conversion rates.
Cons
  • Users note the data inaccuracy in Yandex.Metrica, which may lead to unreliable analysis despite overall satisfaction.
  • Users find the cluttered interface frustrating, requesting a more intuitive design for easier data navigation.
  • Users find the interface cluttered and non-intuitive, wishing for a simpler design for better usability.
  • Users find the interface not intuitive, describing it as cluttered and complicated for a smooth experience.
  • Users find the interface cluttered and messy, wishing for a more intuitive and simplified design for better usability.

What Are Recent G2 Reviews of Yandex.Metrica?

What Are G2 Users Discussing About Yandex.Metrica?

Zoho PageSense

Zoho PageSense is a conversion optimization and personalization platform, designed to boost website conversions and revenue by tracking the visitor journey. The platform combines the power of web analytics, A/B testing, and personalization to help you make informed business decisions. See how many visitors come to your website, understand their behavior, and offer them a personalized website experience—all of this without having to juggle between multiple apps. With PageSense, you can Track key website metrics Measure vital stats of your website to study its performance over time and across segments. Build a conversion funnel and see which part of your website has a significant drop-off. Analyze visitor behavior Find what really interests your visitors, where your visitors click, and how far down they scroll. Go further and see how visitors interact with forms on your website. Optimize website conversions Run A/B and Split URL tests to understand how different elements of a page resonate with your audience. The intuitive visual editor lets you create website variations in a snap. Personalize user experience Deliver personalized experiences for every visitor based on their demographics and interests. From weather-based targeting to journey-based offering, give your visitors the best website experience ever. Gather customer feedback Your customers are your best data sources. Conduct polls and gather responses to know what they think about your business. To know more, visit: https://www.zoho.com/pagesense/

Average Rating: 4.1/5.0

Total Reviews: 38

How Do G2 Users Rate Zoho PageSense?

  • Data Quantification: 8.9/10 (Category avg: 8.6/10)
  • Monitoring: 8.9/10 (Category avg: 8.8/10)
  • Has the product been a good partner in doing business?: 8.7/10 (Category avg: 9.2/10)
  • Webpage Element Analysis: 8.7/10 (Category avg: 8.8/10)

Who Is the Company Behind Zoho PageSense?

  • Seller: Zoho
  • Year Founded: 1996
  • HQ Location: Austin, TX
  • Twitter: @Zoho
    137,880 Twitter followers
  • LinkedIn® Page: www.linkedin.com
    30,766 employees on LinkedIn®
  • Phone: +1 (888) 900-9646

Who Uses This Product?

  • Top Industries: Marketing and Advertising
  • Company Size: 54% Small, 28% Medium

What Do G2 Reviewers Say About Zoho PageSense?

AI-generated summary from verified user reviews

Pros
  • Users value the comprehensive feature set of Zoho PageSense, enhancing their experience with customizable dashboards and reports.
  • Users appreciate the centralization of management in Zoho PageSense, making daily tasks efficient within a single ecosystem.
  • Users admire the customizable dashboards of Zoho PageSense, enhancing their ability to tailor analytics to needs.
  • Users value the ease of use of Zoho PageSense, finding it simple to create reports and dashboards.
  • Users value the customizable dashboards in Zoho PageSense, enhancing their experience with tailored insights.
Cons
  • Users experience communication delays that hinder timely decision-making and disrupt insights from the analytics.
  • Users experience occasional reporting delays in Zoho PageSense, impacting timely decision-making and insights.
  • Users experience occasional reporting delays with Zoho PageSense, impacting their overall efficiency and analysis.
  • Users experience inadequate analytics with basic customer segmentation and occasional reporting delays affecting insights.
  • Users experience decision paralysis due to multiple integrations, negatively impacting their overall user experience with Zoho PageSense.

What Are Recent G2 Reviews of Zoho PageSense?

Browsee

Browsee - Stop Guessing 🤦‍♀️, Start Acting 💪 ✔ AI Tags on sessions - With 5% of sessions, understand 100% of user issues ✔ Page Story - Get actionable insights to improve your landing pages ✔ User Board - Identify users to analyze engagement and understand their problems. Get direct session URLs in your chat tools! ✔ Add Your Own Graphs - Quick analytics for Clicks, Pages, Segments, and Referrals. ✔ Create Funnels and Segments on User Actions - No code required ✔ Limited Recordings for Safety and Pricing - Pick and Choose what to record and what not to record ✔ Free forever plan

Average Rating: 4.9/5.0

Total Reviews: 13

How Do G2 Users Rate Browsee?

  • Data Quantification: 8.7/10 (Category avg: 8.6/10)
  • Monitoring: 8.7/10 (Category avg: 8.8/10)
  • Has the product been a good partner in doing business?: 10.0/10 (Category avg: 9.2/10)
  • Webpage Element Analysis: 8.7/10 (Category avg: 8.8/10)

Who Is the Company Behind Browsee?

  • Seller: Browsee
  • HQ Location: New Delhi, Delhi
  • Twitter: @gonelf
    10,412 Twitter followers
  • LinkedIn® Page: www.linkedin.com
    5 employees on LinkedIn®

Who Uses This Product?

  • Top Industries: Information Technology and Services
  • Company Size: 46% Medium, 46% Small

What Are Recent G2 Reviews of Browsee?

What Are G2 Users Discussing About Browsee?

Alanna Iwuh
A
Researched and written by Alanna Iwuh
Updated October 3, 2024