Best IT Alerting Software - Page 2

How Many IT Alerting Software Products Does G2 Track?

Total Products under this Category: 130

Category Stats (Oct 2026)

  • Average Rating: 4.55/5 (↑0.01 vs Sep 2026) The average rating of products in this category, based on all submitted ratings
  • Top Trending Product: Dash0 (+2.32%) - Among all products in this category, Dash0 recorded the largest rating increase compared to last month

Last updated: October 01, 2026

How Does G2 Rank IT Alerting Software Products?

Why You Can Trust G2's Software Rankings:

  • 30 Analysts and Data Experts
  • 14,900+ Authentic Reviews
  • 130+ Products
  • Unbiased Rankings

G2's software rankings are built on verified user reviews, rigorous moderation, and a consistent research methodology maintained by a team of analysts and data experts. Each product is measured using the same transparent criteria, with no paid placement or vendor influence. While reviews reflect real user experiences, which can be subjective, they offer valuable insight into how software performs in the hands of professionals. Together, these inputs power the G2 Score, a standardized way to compare tools within every category.

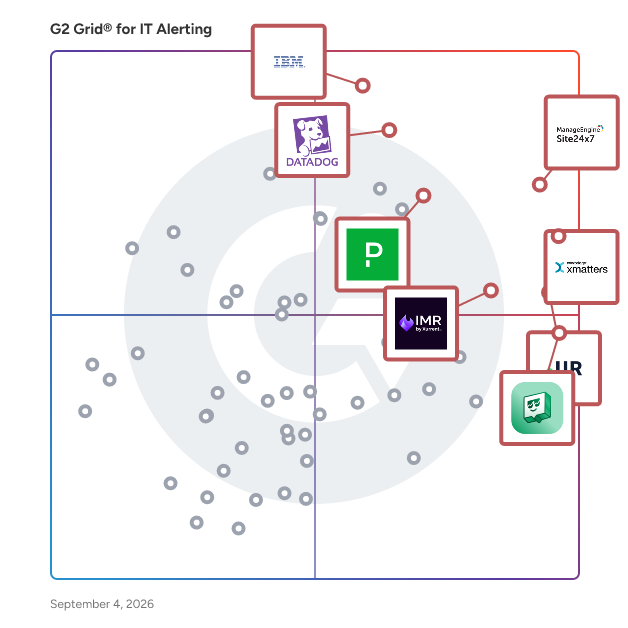
G2 Grid® for IT Alerting Software

G2 Grid® for IT Alerting Software plotting products by satisfaction and market presence

Highlighted products: Site24x7, xMatters, IBM Instana, Datadog, UptimeRobot, PagerDuty, Uptime.com, and Xurrent IMR.

Underlying data: [Grid® JSON](https://www.g2.com/categories/it-alerting/grids.json?focus%5B%5D=site24x7&focus%5B%5D=xmatters&focus%5B%5D=ibm-instana&focus%5B%5D=datadog&focus%5B%5D=uptimerobot&focus%5B%5D=pagerduty&focus%5B%5D=uptime-com&focus%5B%5D=xurrent-imr)

incident.io

incident.io is the software reliability platform trusted by engineering teams at Netflix, Etsy, and over 2,000 companies that can't afford downtime. Software ships faster than ever, and keeping it reliable has become the real constraint on how fast a team can move. incident.io connects the full reliability lifecycle in one platform (On-Call, Investigations, Incident Response, and Status Pages) so context flows across every step instead of getting lost between disconnected tools. At the center is Nexus, a living AI model of your production environment built entirely from your own data: your runbooks, your services, and every incident you've ever run. Nexus gets smarter every time you use the platform, and it powers Investigations, our agentic root cause analysis. The moment an alert fires, Investigations reasons across your telemetry, deploys, and past incidents, then hands your team a root-cause hypothesis with the evidence, before anyone has opened a laptop. The incident.io agent works everywhere your team already does, from Slack and Teams to web, mobile, and MCP, both when you ask it and on its own in the background. It's a platform with an agent, not just an agent, so the essential work of running incidents, paging the right people, and keeping stakeholders updated keeps happening reliably. The result is a shift from simply managing incidents to continuously improving reliability. The best teams don't just respond to failure faster. They detect issues before customers do, resolve them with fewer people pulled in, and stop the same incidents from recurring. Every incident makes the system smarter, so reliability compounds. From the SRE to the support rep to the CTO, teams spend less time firefighting and more time building software their customers trust.

Average Rating: 4.8/5.0

Total Reviews: 233

How Do G2 Users Rate incident.io?

  • Has the product been a good partner in doing business?: 9.7/10 (Category avg: 9.0/10)
  • Quality of Support: 9.8/10 (Category avg: 9.0/10)
  • Ease of Use: 9.4/10 (Category avg: 8.9/10)
  • Ease of Admin: 9.1/10 (Category avg: 8.7/10)

Who Is the Company Behind incident.io?

  • Seller: incident.io
  • Company Website:
  • Year Founded: 2021
  • HQ Location: New York, US
  • Twitter: @incident_io
    3,684 Twitter followers
  • LinkedIn® Page: www.linkedin.com
    218 employees on LinkedIn®

Who Uses This Product?

  • Who Uses This: Senior Software Engineer, Site Reliability Engineer
  • Top Industries: Computer Software, Financial Services
  • Company Size: 64% Medium, 22% Large

What Do G2 Reviewers Say About incident.io?

AI-generated summary from verified user reviews

Pros
  • Users admire the ease of use of incident.io, which streamlines incident management and enhances overall efficiency.
  • Users highlight the helpful and responsive customer support of incident.io, enhancing the overall experience significantly.
  • Users find the Slack integration invaluable for simplifying incident management and keeping teams informed effortlessly.
  • Users highlight the seamless integrations of incident.io, enhancing incident management and collaboration across teams.
  • Users appreciate the excellent customer satisfaction with incident.io, praising its ease of use and effective integration.
Cons
  • Users highlight the missing features in incident.io, particularly in reporting capabilities and SLA tracking.
  • Users express frustration over limited features, wishing for enhanced customization and broader functionality in incident.io.
  • Users find feature issues with catalog creation and limited API capabilities hinder effective incident management in incident.io.
  • Users report integration issues with incident.io, often requiring manual steps and lacking mature connections to other tools.
  • Users find the setup and configuration confusing, especially regarding escalation paths and the UI's frequent changes.

What Are Recent G2 Reviews of incident.io?

What Are G2 Users Discussing About incident.io?

Amazon Simple Notification Service (SNS)

Amazon Simple Notification Service (SNS) is a fully managed messaging service that enables the decoupling of microservices, distributed systems, and serverless applications. It facilitates the seamless transmission of messages from publishers to subscribers through a publish/subscribe (pub/sub) model, supporting a variety of communication protocols. Key Features and Functionality: - Multiple Protocol Support: SNS delivers messages to various endpoints, including Amazon SQS queues, AWS Lambda functions, HTTP/S webhooks, email, SMS, and mobile push notifications. - Message Filtering: Subscribers can define filter policies to receive only relevant messages, reducing unnecessary processing. - Message Batching: Supports publishing multiple messages in a single API request, optimizing throughput and reducing costs. - Message Durability: Ensures high availability by storing messages across multiple, geographically separated servers and data centers. - Security Features: Offers message encryption using AWS Key Management Service (KMS) and supports private communication channels via AWS PrivateLink. Primary Value and User Solutions: Amazon SNS simplifies the development of event-driven applications by providing a reliable and scalable messaging infrastructure. It enables real-time communication between decoupled components, enhancing system resilience and scalability. By supporting multiple delivery protocols and offering features like message filtering and batching, SNS allows developers to build efficient and cost-effective applications. Its integration with other AWS services further streamlines workflows, making it a versatile solution for various messaging needs.

Average Rating: 4.3/5.0

Total Reviews: 85

How Do G2 Users Rate Amazon Simple Notification Service (SNS)?

  • Has the product been a good partner in doing business?: 8.6/10 (Category avg: 9.0/10)
  • Quality of Support: 8.7/10 (Category avg: 9.0/10)
  • Ease of Use: 8.5/10 (Category avg: 8.9/10)
  • Ease of Admin: 8.6/10 (Category avg: 8.7/10)

Who Is the Company Behind Amazon Simple Notification Service (SNS)?

  • Seller: Amazon Web Services (AWS)
  • Year Founded: 2006
  • HQ Location: Seattle, WA
  • Twitter: @awscloud
    2,232,483 Twitter followers
  • LinkedIn® Page: www.linkedin.com
    147,094 employees on LinkedIn®
  • Ownership: NASDAQ: AMZN

Who Uses This Product?

  • Who Uses This: Software Engineer
  • Top Industries: Information Technology and Services, Computer Software
  • Company Size: 44% Small, 30% Medium

What Do G2 Reviewers Say About Amazon Simple Notification Service (SNS)?

AI-generated summary from verified user reviews

Pros
  • Users appreciate the high availability and scalability of Amazon SNS Cloud Storage, ensuring efficient data management and cost savings.
  • Users value the cost-saving features of Amazon SNS, enhancing efficiency through affordable data management options.
  • Users value the high scalability of Amazon SNS, enabling efficient handling of large data through robust features.
  • Users value the enhanced security features of Amazon SNS, ensuring robust protection for their messaging needs.
  • Users find Amazon SNS to be easy to use, simplifying notifications and enhancing team collaboration effectively.
Cons
  • Users find the complexity of AWS services challenging, especially for those new to cloud storage and configuration.
  • Users experience a steep learning curve with AWS Cloud Storage, making it challenging for newcomers to navigate effectively.
  • Users find AWS Cloud Storage's complexity overwhelming, particularly for those new to cloud storage or AWS services.
  • Users note that the complex and unpredictable pricing of AWS Cloud Storage can lead to unexpected expenses.
  • Users experience slow performance with Amazon SNS, encountering delays and unexpected logouts during job processing.

What Are Recent G2 Reviews of Amazon Simple Notification Service (SNS)?

What Are G2 Users Discussing About Amazon Simple Notification Service (SNS)?

ITOC360

ITOC360: AI-First Incident Orchestration Platform ITOC360 is an AI-First Incident Orchestration Platform that helps IT and operations teams detect, route, and resolve incidents faster, with less manual effort and fewer missed alerts. What ITOC360 Does ITOC360 centralizes alert ingestion from your entire monitoring stack and uses AI to suppress noise, correlate related events, and identify what actually needs human attention. When a real incident is detected, the platform automatically triggers the right response: notifying the right people through their preferred channels, executing runbooks, and escalating based on defined policies. Key Capabilities AI-Powered Alert Correlation reduces alert noise by grouping related events into a single incident, so on-call engineers can focus on root causes rather than symptoms. Intelligent On-Call Scheduling lets you manage rotations, overrides, and escalation policies across teams and time zones from a single interface. Multi-Channel Notification Delivery reaches responders through their preferred channels (call, SMS, email, or push) with configurable escalation paths. Automated Runbook Execution triggers predefined remediation steps automatically at incident creation to reduce time-to-resolve. Bi-Directional Integrations connect with your existing observability, ITSM, and communication tools without requiring a rip-and-replace. Real-Time Incident Timeline provides a full audit trail of every alert, action, and response for postmortem analysis and compliance reporting. Who Uses ITOC360 ITOC360 is built for DevOps, SRE, and IT operations teams at organizations that run business-critical systems and cannot afford slow, fragmented incident response. It supports both small on-call teams and large enterprise operations centers. Why Teams Choose ITOC360 Traditional on-call tools simply route alerts. ITOC360 orchestrates the entire incident lifecycle. By combining AI-driven triage with automated workflows and flexible notification preferences, teams reduce mean time to acknowledge (MTTA) and mean time to resolve (MTTR) without adding headcount.

Average Rating: 5.0/5.0

Total Reviews: 36

How Do G2 Users Rate ITOC360?

  • Has the product been a good partner in doing business?: 10.0/10 (Category avg: 9.0/10)
  • Quality of Support: 10.0/10 (Category avg: 9.0/10)
  • Ease of Use: 10.0/10 (Category avg: 8.9/10)
  • Ease of Admin: 9.8/10 (Category avg: 8.7/10)

Who Is the Company Behind ITOC360?

  • Seller: ITOC360
  • Year Founded: 2018
  • HQ Location: Delaware, US
  • LinkedIn® Page: www.linkedin.com
    12 employees on LinkedIn®

Who Uses This Product?

  • Top Industries: Computer Networking, Computer Software
  • Company Size: 53% Small, 42% Medium

What Are Recent G2 Reviews of ITOC360?

AI can help you find the answers. G2 helps you trust them.

Connect G2 to Claude or ChatGPT for answers grounded in G2's trusted reviews, comparisons, and pricing from real user insights.

How it works

Rakuten SixthSense Observability

In today's digital landscape, businesses need a powerful and comprehensive Application Performance Monitoring (APM) solution to stay ahead of the curve. Introducing Rakuten SixthSense Observability - a next-generation APM tool that transforms the way you monitor, analyze, and optimize your applications and infrastructure. With its robust suite of features and advanced analytics, Rakuten SixthSense Observability empowers you to proactively identify and resolve issues, streamline operations, and enhance customer experiences. Key Capabilities: • Comprehensive Monitoring and Alerting: Rakuten SixthSense Observability offers end-to-end monitoring of your applications, infrastructure, and network performance. With real-time alerting and customizable dashboards, you can quickly detect issues and gain actionable insights into the health and performance of your systems. • Distributed Tracing and Correlation: Gain full visibility into your application's performance with distributed tracing, which tracks transactions and requests across multiple services and components. This feature helps you identify bottlenecks, latency issues, and errors, making it easier to optimize your application and enhance customer experiences. • Anomaly Detection and Machine Learning: Leverage Rakuten SixthSense's advanced machine learning capabilities to automatically identify unusual patterns and deviations in application performance and resource utilization. This proactive approach enables you to detect and resolve issues before they impact your business and customers. • Advanced Analytics and Visualization: Rakuten SixthSense's rich data visualization and analytics tools allow you to dive deep into your application performance data. Generate custom reports, analyze trends, and uncover hidden patterns that can drive continuous improvement and optimization. • Log Management and Integration: Effortlessly collect, analyze, and store logs from various sources with Rakuten SixthSense's integrated log management feature. This seamless integration enables you to correlate log data with performance metrics and traces, providing a comprehensive understanding of your application's behaviour. • Scalability and Flexibility: Rakuten SixthSense Observability is built to scale with your growing business needs, supporting a wide range of applications, services, and infrastructure. Its flexible architecture allows you to customize the tool to your specific requirements and integrate it with other monitoring and observability solutions. Current Feature set: • Application Performance Monitoring: Full stack visibility across Java, PHP, Node.js, Python, Go and a lot more! Key Features include, Distributed Tracing, Profiling, Database Monitoring • Infrastructure Monitoring: Get a birds-eye view of your infrastructure health and gain granular insights with easy deployment Key Features include Kubernetes, VMs, Web Servers, Cloud Integrations • Digital Experience Monitoring: Improve the end-user experience of your applications mapped with contextual information of application performance metrics • Browser Monitoring: Metrics to optimize end users’ experience and help in improving application performance. • Mobile Monitoring: Monitor crashes, performance & usage metrics for your mobile applications • Synthetic Monitoring: Stimulate end-user transactions using low code, no code test scripts • VM Monitoring: VM monitoring capability lets you view your infrastructure performance and health of servers, virtual machines, containers, databases etc. at a glance. • SixthSense Cognitive Engine: Modern observability and the proactive approach using artificial intelligence. The application uses different AI/ML algorithms that can predict performance metrics with an accuracy of up to 98% and a confidence level of 90%.

Average Rating: 4.6/5.0

Total Reviews: 52

How Do G2 Users Rate Rakuten SixthSense Observability?

  • Has the product been a good partner in doing business?: 9.2/10 (Category avg: 9.0/10)
  • Quality of Support: 9.3/10 (Category avg: 9.0/10)
  • Ease of Use: 9.3/10 (Category avg: 8.9/10)
  • Ease of Admin: 9.2/10 (Category avg: 8.7/10)

Who Is the Company Behind Rakuten SixthSense Observability?

Who Uses This Product?

  • Who Uses This: Senior Software Engineer
  • Top Industries: Information Technology and Services, Computer Games
  • Company Size: 47% Large, 38% Medium

What Do G2 Reviewers Say About Rakuten SixthSense Observability?

AI-generated summary from verified user reviews

Pros
  • Users appreciate the deep visibility offered by Rakuten SixthSense, enhancing application performance and proactively managing issues.
  • Users value the effective alerting system for seamless monitoring and quick resolution of issues in one dashboard.
  • Users value the excellent customer support of Rakuten SixthSense, enhancing their overall experience and productivity.
  • Users appreciate the ease of use of Rakuten SixthSense Observability, enabling quick identification of issues without hassle.
  • Users find the implementation ease of Rakuten SixthSense Observability impressive, allowing quick access to essential monitoring tools.
Cons
  • Users find the complex setup of Rakuten SixthSense Observability requires significant onboarding effort for optimal use.
  • Users find the documentation lacking, making onboarding and setup more challenging than necessary.
  • Users often face false positive alerts and desire better functionality for error monitoring and dashboard notifications.
  • Users report experiencing inefficient alerts, citing false positives and a lack of preferred error record displays.
  • Users note that the documentation needs improvement, which impacts their ability to utilize the tool effectively.

What Are Recent G2 Reviews of Rakuten SixthSense Observability?

Coralogix

Coralogix is a modern, full-stack observability platform transforming how businesses process and understand their data. Our unique architecture powers in-stream analytics without reliance on indexing or hot storage. We specialize in comprehensive monitoring of logs, metrics, trace and security events, enhancing operational efficiency and reducing total cost of ownership by up to 70%. Coralogix stands out for its simple pricing model, based solely on data volume ingested and retained, and offers free, fast customer support with less than 30 second response time and 1 hour resolution time. Our platform covers the entire range of observability with features such as APM, RUM, SIEM, Kubernetes monitoring and more, all streamlined for quick integration and immediate value. Components within the stream store the system state to provide stateful insights and real-time alerting without ever needing to index the data — so there are never any trade-offs to achieve observability. Once ingested, parsed, and enriched, data is written remotely to an archive bucket controlled by the client. The archive can be queried directly at any time, from the platform UI or via CLI, giving users infinite retention with full control over, and access to, their data. View and query your data from any dashboard using any syntax. Coralogix has successfully completed relevant security and privacy compliances by BDO including GDPR, SOC 2, PCI, HIPAA, and ISO 27001/27701.

Average Rating: 4.5/5.0

Total Reviews: 368

How Do G2 Users Rate Coralogix?

  • Has the product been a good partner in doing business?: 9.4/10 (Category avg: 9.0/10)
  • Quality of Support: 9.4/10 (Category avg: 9.0/10)
  • Ease of Use: 8.8/10 (Category avg: 8.9/10)
  • Ease of Admin: 8.8/10 (Category avg: 8.7/10)

Who Is the Company Behind Coralogix?

  • Seller: Coralogix
  • Company Website:
  • Year Founded: 2014
  • HQ Location: San Francisco, CA
  • Twitter: @Coralogix
    4,102 Twitter followers
  • LinkedIn® Page: www.linkedin.com
    591 employees on LinkedIn®

Who Uses This Product?

  • Who Uses This: Software Engineer, DevOps Engineer
  • Top Industries: Computer Software, Information Technology and Services
  • Company Size: 55% Medium, 33% Large

What Do G2 Reviewers Say About Coralogix?

AI-generated summary from verified user reviews

Pros
  • Users appreciate the ease of use of Coralogix, highlighting its simple setup and efficient integrations.
  • Users value the ease of log monitoring and seamless integration, enhancing overall observability and support responsiveness.
  • Users value the integration of logs, metrics, and alerts, enhancing efficiency in root-cause analysis and monitoring.
  • Users commend the exceptional customer support of Coralogix, ensuring quick resolutions and a smooth experience.
  • Users value the real-time monitoring of Coralogix, enhancing their understanding of user behavior and improving incident response.
Cons
  • Users find that the learning curve is steep for beginners, making navigation and understanding features challenging.
  • Users experience slow performance with Coralogix, leading to frustration due to delayed log fetching and UI loading.
  • Users find the difficult learning curve of Coralogix challenging, especially for beginners navigating complex options.
  • Users find the missing feature for downloading log results a significant limitation in Coralogix's functionality.
  • Users find the learning difficulty of Coralogix challenging, especially when navigating advanced features and the overwhelming UI.

What Are Recent G2 Reviews of Coralogix?

Dash0

Dash0 closes the loop from code to production in the AI era. Built natively on OpenTelemetry, Dash0 tracks what AI builds, observes everything running in production, and fixes problems autonomously, all powered by a single, OpenTelemetry native data foundation. Dash0 helps engineering teams ship more and break less in a world where code moves at machine speed.

Average Rating: 4.8/5.0

Total Reviews: 43

How Do G2 Users Rate Dash0?

  • Has the product been a good partner in doing business?: 9.9/10 (Category avg: 9.0/10)
  • Quality of Support: 9.9/10 (Category avg: 9.0/10)
  • Ease of Use: 9.2/10 (Category avg: 8.9/10)
  • Ease of Admin: 9.2/10 (Category avg: 8.7/10)

Who Is the Company Behind Dash0?

  • Seller: Dash0
  • Company Website:
  • Year Founded: 2023
  • HQ Location: New York
  • Twitter: @dash0hq
    2,320 Twitter followers
  • LinkedIn® Page: www.linkedin.com
    226 employees on LinkedIn®

Who Uses This Product?

  • Top Industries: Computer Software, Information Technology and Services
  • Company Size: 51% Small, 30% Medium

What Do G2 Reviewers Say About Dash0?

AI-generated summary from verified user reviews

Pros
  • Users find Dash0's ease of use exceptional, with intuitive features and straightforward setup for quick integration.
  • Users love Dash0's responsive customer support, finding the team's assistance crucial for a smooth experience.
  • Users value Dash0's intuitive UI/UX, appreciating its seamless integration and efficient observability features.
  • Users find the easy setup of Dash0 allows for quick integration and seamless data management in Kubernetes.
  • Users appreciate the easy integrations of Dash0, enabling seamless setup and fast transition from existing systems.
Cons
  • Users have noted limited features in Dash0, with many advanced tools still not available for use.
  • Users have experienced feature deficiencies with Dash0, though updates have improved functionality over time.
  • Users note the missing features in Dash0, expressing a desire for enhanced functionality and additional integrations.
  • Users face limited customization options with Dash0, impacting mobile usability and dashboard functionality.
  • Users note feature limitations in Dash0, seeking expanded capabilities and enhanced integrations for improved functionality.

What Are Recent G2 Reviews of Dash0?

Pulsetic

Pulsetic is a comprehensive website uptime monitoring solution that enables businesses to safeguard their online operations and maintain customer trust. The service delivers real-time browser monitoring and alerts via multiple channels, including phone call, SMS, email, and Slack, ensuring that website downtime is immediately identified and addressed. Additionally, Pulsetic features customizable status pages that provide transparent and up-to-date information to customers regarding website incidents, as well as status badges that allow for easy, on-demand status checks without the need to navigate away from the current page.

Average Rating: 4.8/5.0

Total Reviews: 222

How Do G2 Users Rate Pulsetic?

  • Has the product been a good partner in doing business?: 9.7/10 (Category avg: 9.0/10)
  • Quality of Support: 9.5/10 (Category avg: 9.0/10)
  • Ease of Use: 9.5/10 (Category avg: 8.9/10)
  • Ease of Admin: 9.5/10 (Category avg: 8.7/10)

Who Is the Company Behind Pulsetic?

  • Seller: Pulsetic
  • HQ Location: N/A
  • Twitter: @getpulsetic
    143 Twitter followers
  • LinkedIn® Page: www.linkedin.com
    1 employees on LinkedIn®

Who Uses This Product?

  • Who Uses This: Owner, Founder
  • Top Industries: Information Technology and Services, Computer Software
  • Company Size: 86% Small, 9% Medium

What Do G2 Reviewers Say About Pulsetic?

AI-generated summary from verified user reviews

Pros
  • Users appreciate the ease of use of Pulsetic, making it accessible and user-friendly for everyone.
  • Users commend the easy-to-use monitoring services of Pulsetic, ensuring reliable website performance and uptime tracking.
  • Users find the easy setup of Pulsetic enhances their experience, facilitating a smooth transition and effective monitoring.
  • Users value the automated downtime notifications from Pulsetic, enabling quick responses to uptime issues effortlessly.
  • Users love the clear and simple UI of Pulsetic, making website monitoring straightforward and efficient.
Cons
  • Users find the limited free services restrictive, wishing for more monitoring options and flexibility before upgrading.
  • Users find the pricing model inflexible and desire better organization and a more user-friendly interface.
  • Users struggle with monitoring issues like inability to track GRPC endpoints and inadequate API documentation.
  • Users find the pricing model expensive and inflexible, making access for teams a challenge for some budgets.
  • Users find the limitations of the free plan restrictive, wishing for more monitoring options and flexibility.

What Are Recent G2 Reviews of Pulsetic?

BigPanda

BigPanda is an agentic IT operations platform that enables enterprises to keep the digital world running by transforming manual and reactive human processes into intelligent, autonomous systems. The world’s most trusted brands rely on BigPanda to detect, respond to, and prevent IT incidents at machine speed, improving operational efficiency and delivering exceptional service reliability to their customers. Our primary users include IT Operations (ITOps), Network Operations Centers (NOC), Major Incident Management, Change Management,, and Site Reliability Engineering (SRE) teams that face increasing challenges due to the complexities of modern IT infrastructure. Enterprises spend $250 billion annually on manual, human-driven IT operations, and it doesn’t scale. Teams are hindered by slow, reactive, and manual ITOps and incident management processes that cannot keep up with the scale and rapid pace of change in today's digital landscape. As a result, enterprises experience service outages and increased operational costs, detracting from their ability to innovate and improve service delivery. BigPanda addresses these challenges by transforming the overwhelming volume of IT alerts and incidents into automated, actionable workflows. By leveraging AI agents, advanced algorithms, and machine learning, the platform unifies events and IT knowledge, correlates incidents across domains, and automates triage and investigation. These capabilities streamline the incident response process and reduce the time spent on manual tasks, allowing IT professionals to focus on strategic initiatives rather than being bogged down by routine firefighting. The key capabilities of BigPanda include: - AI Incident Prevention helps teams stop change-related incidents before they happen with scalable, proactive change and problem management. - AI Detection and Response correlates signals and surfaces critical context, so your teams can act before incidents escalate. - The BigPanda L1 Agent strengthens your first line of defense by automating L1 NOC workflows end to end and scaling L1 operations without increasing headcount. - AI Incident Assistant helps IT teams streamline major incidents, including collaboration, investigation, and resolution, to reduce the impact on the business. These capabilities are powered by the BigPanda IT Knowledge Graph, which is purpose-built to enable an AI-first data strategy by capturing your siloed and fragmented data and using it to power insights and automation. BigPanda integrates seamlessly with existing IT tools, empowering enterprises to automate incident response workflows and gain real-time visibility into IT operations. Automating repetitive IT operations tasks helps organizations minimize human error and accelerate resolution times, while the integration capabilities ensure that teams can leverage their current toolsets without disruption. Additionally, BigPanda offers advanced analytics that provide valuable insights into operational performance, helping organizations make informed decisions that enhance service availability and drive business growth. By utilizing BigPanda, enterprises can significantly reduce their IT operating costs while improving service reliability and overall business agility. The platform empowers teams to proactively manage incidents, mitigate outage risk, and enhance customer satisfaction. As organizations continue to evolve amid digital transformation, BigPanda stands out as a critical tool for modern enterprise IT operations, enabling them to thrive in an increasingly complex environment.

Average Rating: 4.5/5.0

Total Reviews: 154

How Do G2 Users Rate BigPanda?

  • Has the product been a good partner in doing business?: 8.6/10 (Category avg: 9.0/10)
  • Quality of Support: 9.0/10 (Category avg: 9.0/10)
  • Ease of Use: 9.0/10 (Category avg: 8.9/10)
  • Ease of Admin: 8.6/10 (Category avg: 8.7/10)

Who Is the Company Behind BigPanda?

  • Seller: BigPanda
  • Company Website:
  • Year Founded: 2012
  • HQ Location: Mountain View, California
  • Twitter: @bigpanda
    3,072 Twitter followers
  • LinkedIn® Page: www.linkedin.com
    336 employees on LinkedIn®

Who Uses This Product?

  • Who Uses This: Developer, Engineer
  • Top Industries: Information Technology and Services, Computer Software
  • Company Size: 49% Large, 35% Small

What Do G2 Reviewers Say About BigPanda?

AI-generated summary from verified user reviews

Pros
  • Users value the effective noise reduction and automation of workflows in BigPanda's alerting system for incident management.
  • Users value the effective alert management of BigPanda, which reduces noise and streamlines incident management.
  • Users value the automation in BigPanda, which effectively reduces noise and streamlines incident management.
  • Users benefit from easy integrations in BigPanda, enhancing incident management and automation processes effectively.
  • Users value the automation of workflows, which effectively reduces noise and streamlines incident management in BigPanda.

What Are Recent G2 Reviews of BigPanda?

What Are G2 Users Discussing About BigPanda?

SIGNL4

SIGNL4 is an operational alerting and response platform that ensures critical events, alerts and incidents trigger immediate action - anywhere. Modern monitoring, IT infrastructure, cloud services, and IoT systems can detect problems instantly - but problem detection alone does not guarantee response. Simple notifications sent via email, SMS, or chat are often missed, delayed, or fail to reach the right person, especially outside the office or during off-hours. SIGNL4 ensures that critical alerts reach the right responders - wherever they are and in a fully automated manner. With mobile-first alerting, automated escalation, and reliable delivery, it bridges the gap between alert detection and real-world response. The platform provides capabilities for alert unification and triage, on-call alerting, incident response, and alert escalation, including push notifications with mute override, SMS text and voice alerts, escalation policies, AI-assisted duty scheduling, and real-time acknowledgment tracking. Alerts are escalated automatically until a responder takes ownership, ensuring no critical issue is left unattended. The comprehensive and intuitive mobile app works as the anywhere incident command center. Designed for IT operations, DevOps, security teams, and operational environments beyond the desk, SIGNL4 enables fast, reliable response across IT, OT, and IoT systems. The convenience of interfaces such as email, webhooks, and pre-built two-way connectors further enhances SIGNL4's functionality. These features facilitate the integration of the alerting and response layer into the entire operations stack, allowing organizations to leverage their current infrastructure while improving incident response capabilities. By turning alerts into immediate, accountable action - anywhere - SIGNL4 helps organizations reduce downtime and maintain mission-critical operations and operational excellence. SIGNL4 is built for the heroes who keep everything running.

Average Rating: 4.6/5.0

Total Reviews: 84

How Do G2 Users Rate SIGNL4?

  • Has the product been a good partner in doing business?: 8.9/10 (Category avg: 9.0/10)
  • Quality of Support: 9.1/10 (Category avg: 9.0/10)
  • Ease of Use: 8.7/10 (Category avg: 8.9/10)
  • Ease of Admin: 9.0/10 (Category avg: 8.7/10)

Who Is the Company Behind SIGNL4?

  • Seller: Derdack
  • Company Website:
  • Year Founded: 1999
  • HQ Location: Potsdam, Germany
  • Twitter: @Derdack
    10,176 Twitter followers
  • LinkedIn® Page: www.linkedin.com
    31 employees on LinkedIn®

Who Uses This Product?

  • Top Industries: Information Technology and Services, Government Administration
  • Company Size: 37% Small, 35% Medium

What Do G2 Reviewers Say About SIGNL4?

AI-generated summary from verified user reviews

Pros
  • Users praise the easy setup and intuitive design of SIGNL4, making it a user-friendly communication tool.
  • Users value SIGNL4 for its efficient alerting and robust integration, enhancing IT monitoring and team coordination effortlessly.
  • Users value the efficient alerting system of SIGNL4 for timely IT issue detection and response management.
  • Users find SIGNL4's efficient alert management crucial for timely IT issue detection and seamless emergency response.
  • Users praise the prompt and effective customer support of SIGNL4, enhancing their overall experience and implementation process.
Cons
  • Users find integration issues with SIGNL4 challenging, especially when connecting on-premises systems to the SaaS solution.
  • Users are frustrated by the expensive subscription model, requiring multiple licenses for different teams' access.
  • Users desire more missing features such as built-in connections and remote actions for enhanced functionality.
  • Users experience notification issues with SIGNL4, finding alerts too frequent and information overwhelming.
  • Users find that the app has a complex UI that hinders intuitive use and information clarity.

What Are Recent G2 Reviews of SIGNL4?

What Are G2 Users Discussing About SIGNL4?

Parny

Parny is an AIOps platform for SRE, DevOps, Platform Engineering, and IT Operations teams. It works as an intelligence layer on top of the monitoring, observability, and incident tools teams already use, such as Datadog, Prometheus, and PagerDuty, rather than replacing them. Parny ingests signals from your existing monitoring stack and uses built-in service discovery to map how services and infrastructure connect. Its Domain Tree and Infrastructure Visibility capabilities maintain a continuously updated, real-time view of dependencies, so teams can see how systems relate, where failures propagate, and which services are affected. Instead of treating alerts as isolated events, Parny correlates signals into contextualized incidents and routes the right alert to the right responder with full operational context. Configurable escalation policies, routing rules, on-call schedules, and services keep the right people engaged through the right workflow, reducing noise and accelerating resolution. Teams using Parny see up to 42% less alert noise, 68% faster root cause identification, and 35% MTTR improvement. Parny supports modern distributed environments including microservices, containers, and hybrid cloud, without requiring teams to replace their existing observability investments. The result: stronger reliability, less alert fatigue, clearer service ownership, and healthier services at scale.

Average Rating: 5.0/5.0

Total Reviews: 20

How Do G2 Users Rate Parny?

  • Has the product been a good partner in doing business?: 10.0/10 (Category avg: 9.0/10)
  • Quality of Support: 9.9/10 (Category avg: 9.0/10)
  • Ease of Use: 9.8/10 (Category avg: 8.9/10)
  • Ease of Admin: 9.4/10 (Category avg: 8.7/10)

Who Is the Company Behind Parny?

  • Seller: Parny
  • Company Website:
  • Year Founded: 2022
  • HQ Location: Istanbul, TR
  • Twitter: @Parnyio
    13 Twitter followers
  • LinkedIn® Page: www.linkedin.com
    6 employees on LinkedIn®

Who Uses This Product?

  • Top Industries: Information Technology and Services, Computer Software
  • Company Size: 43% Medium, 38% Small

What Do G2 Reviewers Say About Parny?

AI-generated summary from verified user reviews

Pros
  • Users value the detailed alarm information and AI support in Parny, enhancing quick and effective incident responses.
  • Users appreciate the ease of use of Parny, with a user-friendly interface and streamlined alarm management.
  • Users appreciate the flexible and useful alerting system of Parny, enhancing responsiveness during incidents.
  • Users highly value the team collaboration features in Parny, enhancing communication and incident response efficiency.
  • Users value the AI-driven insights of Parny, enhancing alarm analysis and team efficiency significantly.
Cons
  • Users note the limited features in Parny's mobile app compared to the web version, seeking further enhancements.
  • Users find the limited mobile functionality frustrating, indicating a need for features found in the web version.
  • Users feel the mobile app quality needs significant improvement to be on par with the web version.
  • Users note integration issues, with a desire for more integrations despite Parny enhancing on-call experiences overall.
  • Users feel the platform lacks missing features but remain optimistic about future updates and improvements.

What Are Recent G2 Reviews of Parny?

Splunk On-Call

Splunk On-Call makes on-call management less frustrating while reducing mean time to acknowledge and resolve incidents. Splunk On-Call empowers DevOps teams by delivering alerts to the right people so they can collaborate and solve problems. Teams receive context-rich notifications and collaborate cross-functionally to empower fast, efficient incident resolution with reduced downtime. Stakeholders can gain visibility to critical incidents and steps taken to resolve them.

Average Rating: 4.5/5.0

Total Reviews: 52

How Do G2 Users Rate Splunk On-Call?

  • Has the product been a good partner in doing business?: 9.5/10 (Category avg: 9.0/10)
  • Quality of Support: 9.1/10 (Category avg: 9.0/10)
  • Ease of Use: 8.6/10 (Category avg: 8.9/10)
  • Ease of Admin: 8.8/10 (Category avg: 8.7/10)

Who Is the Company Behind Splunk On-Call?

  • Seller: Cisco
  • Year Founded: 1984
  • HQ Location: San Jose, CA
  • Twitter: @Cisco
    720,366 Twitter followers
  • LinkedIn® Page: www.linkedin.com
    95,294 employees on LinkedIn®
  • Ownership: NASDAQ:CSCO

Who Uses This Product?

  • Top Industries: Computer Software, Information Technology and Services
  • Company Size: 46% Medium, 35% Large

What Do G2 Reviewers Say About Splunk On-Call?

AI-generated summary from verified user reviews

Pros
  • Users value the robust notification system of Splunk On-Call, ensuring timely responses and effective incident management.
  • Users appreciate the robust alert management in Splunk On-Call, ensuring timely notifications for critical incidents.
  • Users value the configuration ease of Splunk On-Call, finding it simple to set up and integrate into workflows.
  • Users appreciate the flexibility and configurability of Splunk On-Call, enhancing their incident management processes effectively.
  • Users appreciate the flexibility of Splunk On-Call, enhancing incident management with customizable alerts and configurations.
Cons
  • Users find Splunk On-Call has limited features and lacks significant improvements since its acquisition, hindering usability.
  • Users find a lack of notable improvements in Splunk On-Call, leading to frustration with its outdated features.
  • Users report notification issues with Splunk On-Call, citing delays and unreliable functionality that hinder timely responses.
  • Users find the complexity of Splunk On-Call due to outdated features and inadequate user interface frustrating.
  • Users find the complex UI of Splunk On-Call frustrating, as it lacks intuitive configuration options and updates.

What Are Recent G2 Reviews of Splunk On-Call?

What Are G2 Users Discussing About Splunk On-Call?

Checkmk

Checkmk is a full-stack monitoring and observability platform designed to provide unified visibility into hybrid IT infrastructures. With more than 2,000 built-in integrations, it offers broad coverage across networks, servers, cloud workloads, Kubernetes and applications. The platform is highly automated, featuring auto-discovery of hosts and services and rule-based configuration to reduce manual setup. It is highly scalable, capable of efficiently monitoring thousands of hosts and millions of services. A central web-based interface allows users to manage configuration, visualize data with customizable dashboards, and track system performance over time. Checkmk is available as packages for all common Linux distributions, as a virtual or physical appliance, through AWS and Azure Marketplace images, or as SaaS. Checkmk is available in four editions: Checkmk Community offers free and open source monitoring for small infrastructures. Checkmk Pro allows for monitoring at speed and scale for data center infrastructures. Checkmk Ultimate offers full-stack observability for hybrid and cloud-native infrastructures which is also available with multi-tenancy and data segregation to support security and compliance. And Checkmk Cloud for full-stack observability for hybrid and cloud-native infrastructures in a SaaS platform. Available extensions include synthetic monitoring and OpenTelemetry for application monitoring. The Checkmk Relay enables secure data collection for segmented networks using outbound-only communication, supporting fully air-gapped and zero-inbound monitoring deployments. Checkmk supports integration with ITSM tools and third-party platforms, enabling automatic ticket creation and consistent alerting. Features such as forecasting, capacity planning, and asset inventory as well as lifecycle management and auto-registration help teams manage dynamic IT environments. Monitoring capabilities: - Monitoring of hybrid infrastructures: cloud, on-premises, virtual, and container environments. - 2000+ built-in integrations networks, servers, cloud workloads, Kubernetes and applications out-of-the-box dashboards provide key metrics for AWS and Azure environments, Linux and Windows servers, and Kubernetes clusters. - Automated discovery and configuration. - Alerting with native ITSM integrations. Operational benefits: - Provides insights into system health, capacity trends, and future resource needs through built-in assessments and forecasting tools. - Reduces manual effort with auto-discovery, rule-based configuration, and centralized agent management as well as auto-registration and host lifecycle management. - Accelerates incident response time by using custom self-healing workflows via the ‘Alert Handler’. - Allows creation of tailored dashboards and views to focus on the most relevant metrics for each team. - Maintains an up-to-date inventory of hardware and software assets, enriched with live monitoring data. - Supports distributed monitoring and can handle massive amounts of data. Why choose Checkmk? - Cost Efficiency: Transparent pricing model with a strong price-performance ratio - Security: Meets stringent security requirements, including fully air-gapped deployments and zero-inbound monitoring. - Visibility: Delivers broad and deep visibility with flexible deployment options. - Scalability: Scales efficiently to support large, distributed environments with high host and service counts. - Extensibility: Supports custom plug-ins, integrations, synthetic monitoring to monitor you applications from the user’s perspective and OpenTelemetry for application monitoring. Customers include: Adobe, Cloudera, Fujitsu, Siemens, Orange, VW, HP, Zalando, Fitbit, NEC, Continental, NHL, Capgemini, Sixt, Intesa SanPaolo

Average Rating: 4.7/5.0

Total Reviews: 295

How Do G2 Users Rate Checkmk?

  • Has the product been a good partner in doing business?: 9.0/10 (Category avg: 9.0/10)
  • Quality of Support: 8.8/10 (Category avg: 9.0/10)
  • Ease of Use: 8.1/10 (Category avg: 8.9/10)
  • Ease of Admin: 8.2/10 (Category avg: 8.7/10)

Who Is the Company Behind Checkmk?

  • Seller: Checkmk
  • Company Website:
  • Year Founded: 2007
  • HQ Location: Munich, DE
  • Twitter: @checkmk
    1,755 Twitter followers
  • LinkedIn® Page: www.linkedin.com
    232 employees on LinkedIn®

Who Uses This Product?

  • Who Uses This: IT Engineer, Systemadministrator
  • Top Industries: Information Technology and Services, Computer & Network Security
  • Company Size: 42% Medium, 40% Large

What Do G2 Reviewers Say About Checkmk?

AI-generated summary from verified user reviews

Pros
  • Users appreciate the ease of use of Checkmk, finding it quick to deploy and well-documented.
  • Users commend Checkmk for its flexibility and powerful monitoring capabilities, effectively managing diverse IT infrastructures.
  • Users appreciate the comprehensive monitoring capabilities of Checkmk, enabling effective oversight of diverse IT environments.
  • Users value the flexibility and customization of Checkmk, making it a powerful solution tailored to their needs.
  • Users value Checkmk for its real-time monitoring capabilities, allowing efficient oversight of diverse systems and applications.
Cons
  • Users find the steep learning curve challenging, making onboarding difficult for non-regular users and complicating their experience.
  • Users find difficult learning due to complex customization and limited data insights in Checkmk, affecting usability.
  • Users find the configuration process overly complex, especially during onboarding for new and non-regular users.
  • Users find the learning difficulty steep due to complex configurations and lacking intuitive documentation for advanced features.
  • Users find the complex setup of Checkmk challenging, especially for newcomers unfamiliar with the system.

What Are Recent G2 Reviews of Checkmk?

What Are G2 Users Discussing About Checkmk?

AWS Personal Health Dashboard

AWS Personal Health Dashboard provides alerts and remediation guidance when AWS is experiencing events that may impact you.

Average Rating: 4.1/5.0

Total Reviews: 18

How Do G2 Users Rate AWS Personal Health Dashboard?

  • Has the product been a good partner in doing business?: 8.8/10 (Category avg: 9.0/10)
  • Quality of Support: 8.8/10 (Category avg: 9.0/10)
  • Ease of Use: 8.4/10 (Category avg: 8.9/10)
  • Ease of Admin: 8.8/10 (Category avg: 8.7/10)

Who Is the Company Behind AWS Personal Health Dashboard?

  • Seller: Amazon Web Services (AWS)
  • Year Founded: 2006
  • HQ Location: Seattle, WA
  • Twitter: @awscloud
    2,232,483 Twitter followers
  • LinkedIn® Page: www.linkedin.com
    147,094 employees on LinkedIn®
  • Ownership: NASDAQ: AMZN

Who Uses This Product?

  • Company Size: 57% Small, 29% Large

What Are Recent G2 Reviews of AWS Personal Health Dashboard?

Pandora FMS

Pandora FMS is a unified monitoring and observability platform designed to consolidate visibility, alerting, reporting, and automation across heterogeneous IT environments. Instead of combining multiple point tools for networks, servers, applications, and cloud services, Pandora FMS centralizes data collection and operational workflows in a single console, reducing integration effort and operational complexity in on-premise, hybrid, and multi-cloud architectures. The platform collects telemetry using multiple methods, including agents, remote checks, standard protocols (e.g., SNMP/WMI), APIs, and log/event ingestion. This enables teams to monitor infrastructure and services end-to-end, correlate signals, and maintain consistent alerting policies and dashboards across distributed estates. Pandora FMS also supports capacity and trend analysis to anticipate resource constraints and identify recurring patterns, and includes AI-assisted capabilities for anomaly detection and automated thresholds to surface hard-to-spot operational signals. Pandora FMS is extensible through a large plugin ecosystem (500+ plugins and integrations), covering a wide range of enterprise and infrastructure technologies such as SAP, Oracle, Citrix, JBoss, VMware, AWS, SQL Server, Red Hat, and WebSphere. This extensibility helps organizations standardize monitoring across legacy and modern stacks without redesigning their monitoring approach per technology. Core capabilities: -Unified monitoring for networks, servers, applications, cloud services, endpoints, and logs -Centralized alerting, event correlation, dashboards, and scheduled reporting -Flexible data collection via agents, remote checks, APIs, and plugins -Scalability for distributed environments and large numbers of monitored elements -Analytics for trend/capacity planning plus AI-assisted anomaly detection and dynamic thresholds -A key differentiator is direct vendor support, which simplifies escalation and ensures continuity of expertise for deployment, tuning, and ongoing operations.

Average Rating: 4.6/5.0

Total Reviews: 212

How Do G2 Users Rate Pandora FMS?

  • Has the product been a good partner in doing business?: 9.0/10 (Category avg: 9.0/10)
  • Quality of Support: 9.0/10 (Category avg: 9.0/10)
  • Ease of Use: 9.1/10 (Category avg: 8.9/10)
  • Ease of Admin: 8.5/10 (Category avg: 8.7/10)

Who Is the Company Behind Pandora FMS?

  • Seller: Pandora FMS
  • Company Website:
  • Year Founded: 2004
  • HQ Location: Madrid, Spain
  • Twitter: @pandorafms
    5,458 Twitter followers
  • LinkedIn® Page: www.linkedin.com
    56 employees on LinkedIn®

Who Uses This Product?

  • Who Uses This: Data Analyst
  • Top Industries: Information Technology and Services, Telecommunications
  • Company Size: 50% Medium, 37% Small

What Do G2 Reviewers Say About Pandora FMS?

AI-generated summary from verified user reviews

Pros
  • Users value the reliable remote monitoring capabilities of Pandora FMS, ensuring seamless oversight of their systems.
  • Users enjoy the ease of use of Pandora FMS, appreciating its intuitive interface and reliable support.
  • Users value the real-time monitoring capabilities of Pandora FMS, enhancing visibility of all network devices effortlessly.
  • Users value the flexibility and adaptability of Pandora FMS, making it suitable for diverse IT monitoring needs.
  • Users value the versatility of network monitoring in Pandora FMS, effectively managing diverse devices and environments.
Cons
  • Users find the learning curve steep, particularly with initial setup and complex functionalities of Pandora FMS.
  • Users find the complex setup of Pandora FMS challenging, particularly due to compatibility issues and steep learning curves.
  • Users note the learning difficulty with Pandora FMS, especially for those lacking technical expertise for setup and configuration.
  • Users find the complex configuration of Pandora FMS challenging, especially without extensive technical expertise.
  • Users face a difficult learning curve with Pandora FMS, which can hinder effective usage for beginners.

What Are Recent G2 Reviews of Pandora FMS?

What Are G2 Users Discussing About Pandora FMS?

Freshstatus by Freshworks

Freshstatus is a Status Page and an Incident Communication Software. Create a hosted and branded status page in just one-click. Manage Incidents and communicate status updates in realtime with your teams and customers. New features in Freshstatus 3.0 include: 1. Authenticate users with SSO/SAML : Setup SSO for your team so they can access their Private status page with their company credentials. 2. API for CRUD Incident and Scheduled Maintenance, Incident updates. 3. Quick Service Status Change: Change service status without creating an Incident or Scheduled Maintenance. 4. Customise your Email Alerts: On popular demand, now you can customize the “from” & “reply-to” email addresses and DKIM settings. You can also change the look & feel of these emails along with its content. 5. Subscriber Alerts with RSS/ATOM - Get update notifications as RSS/ATOM feed. 6. Webhook Integrations - Subscribers can set up their own Webhook integrations to connect with any channel they like and receive regular updates. 7. Follow an Incident: Your end users have the option to follow a particular Incident or Scheduled Maintenance of the service that affects them the most. 8. Dynamic Date and Time : Status page will now show Date and Time based on the user’s Browser settings. Freshstatus allows you to setup unlimited services, Incidents and Maintenance updates and lets you have up to 250 subscribers, 5 users & unlimited internal team members.

Average Rating: 4.5/5.0

Total Reviews: 359

How Do G2 Users Rate Freshstatus by Freshworks?

  • Has the product been a good partner in doing business?: 8.9/10 (Category avg: 9.0/10)
  • Quality of Support: 8.8/10 (Category avg: 9.0/10)
  • Ease of Use: 9.1/10 (Category avg: 8.9/10)
  • Ease of Admin: 9.0/10 (Category avg: 8.7/10)

Who Is the Company Behind Freshstatus by Freshworks?

  • Seller: Freshworks
  • Year Founded: 2010
  • HQ Location: San Mateo, CA
  • Twitter: @FreshworksInc
    19,020 Twitter followers
  • LinkedIn® Page: www.linkedin.com
    7,783 employees on LinkedIn®
  • Ownership: NASDAQ: FRSH

Who Uses This Product?

  • Who Uses This: CEO, Director
  • Top Industries: Information Technology and Services, Computer Software
  • Company Size: 68% Small, 26% Medium

What Are Recent G2 Reviews of Freshstatus by Freshworks?

Tian Lin
TL
Researched and written by Tian Lin
Updated October 3, 2024