Best Application Performance Monitoring (APM) Tools

How Many Application Performance Monitoring (APM) Tools Products Does G2 Track?

Total Products under this Category: 228

Category Stats (Sep 2026)

  • Average Rating: 4.44/5 The average rating of products in this category, based on all submitted ratings
  • Top Trending Product: BMC Helix Operations Management with AIOps (+10.34%) - Among all products in this category, BMC Helix Operations Management with AIOps recorded the largest rating increase compared to last month

Last updated: September 01, 2026

How Does G2 Rank Application Performance Monitoring (APM) Tools Products?

Why You Can Trust G2's Software Rankings:

  • 30 Analysts and Data Experts
  • 16,600+ Authentic Reviews
  • 228+ Products
  • Unbiased Rankings

G2's software rankings are built on verified user reviews, rigorous moderation, and a consistent research methodology maintained by a team of analysts and data experts. Each product is measured using the same transparent criteria, with no paid placement or vendor influence. While reviews reflect real user experiences, which can be subjective, they offer valuable insight into how software performs in the hands of professionals. Together, these inputs power the G2 Score, a standardized way to compare tools within every category.

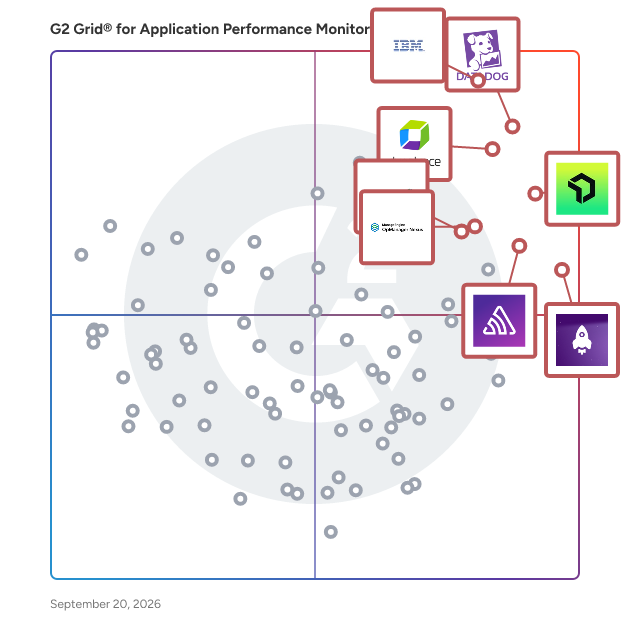
G2 Grid® for Application Performance Monitoring (APM) Tools

G2 Grid® for Application Performance Monitoring (APM) Tools plotting products by satisfaction and market presence

Highlighted products: IBM Instana, Datadog, Dynatrace, New Relic, LogRocket, Sentry, OpManager Nexus, and Site24x7.

Underlying data: [Grid® JSON](https://www.g2.com/categories/application-performance-monitoring-apm/grids.json?focus%5B%5D=ibm-instana&focus%5B%5D=datadog&focus%5B%5D=dynatrace&focus%5B%5D=new-relic&focus%5B%5D=logrocket&focus%5B%5D=sentry&focus%5B%5D=opmanager-nexus&focus%5B%5D=site24x7)

IBM Instana

IBM Instana, now part of the Concert platform, discovers and maps all services, infrastructure, and their inter-dependencies automatically. Instana ingests all observability metrics, traces each request, profiles every process, and updates application dependency maps in real-time to deliver the context and actionable feedback needed by DevOps to optimize application performance, enable innovation and mitigate risk to help them add value and efficiency to the pipeline. IBM Instana is available on AWS Marketplace.

Average Rating: 4.4/5.0

Total Reviews: 468

How Do G2 Users Rate IBM Instana?

  • Performance Metrics: 8.4/10 (Category avg: 8.3/10)
  • Root Cause Analysis (RCA): 8.2/10 (Category avg: 8.4/10)
  • Real User Monitoring (RUM): 8.3/10 (Category avg: 8.3/10)
  • Has the product been a good partner in doing business?: 8.5/10 (Category avg: 8.9/10)

Who Is the Company Behind IBM Instana?

  • Seller: IBM
  • Company Website:
  • Year Founded: 1911
  • HQ Location: Armonk, New York, United States
  • Twitter: @IBMSecurity
    74,660 Twitter followers
  • LinkedIn® Page: www.linkedin.com
    344,328 employees on LinkedIn®

Who Uses This Product?

  • Who Uses This: Software Engineer, System Engineer
  • Top Industries: Information Technology and Services, Computer Software
  • Company Size: 40% Medium, 36% Large

What Do G2 Reviewers Say About IBM Instana?

AI-generated summary from verified user reviews

Pros
  • Users value the ease of use of IBM Instana, which simplifies app tracking and enhances performance analysis.
  • Users value the fast and comprehensive monitoring capabilities of IBM Instana, ensuring robust protection across all environments.
  • Users value the real-time monitoring of IBM Instana, appreciating its ease of use and robust dashboard features.
  • Users value the fast and effective monitoring capabilities of IBM Instana, ensuring comprehensive system protection and anomaly detection.
  • Users highlight the effortless setup of IBM Instana, enabling seamless monitoring of complex applications without manual configuration.
Cons
  • Users express that the pricing can accumulate quickly as their environments grow, making it a significant concern.
  • Users find the user interface complex, leading to a steeper learning curve and affecting overall usability.
  • Users find the learning curve challenging, particularly for new team members navigating the complex interface and features.
  • Users find the difficult learning curve of IBM Instana challenging, hindering quick adaptation and efficient use of the tool.
  • Many users find the pricing structure of IBM Instana to be expensive, particularly for smaller teams and startups.

What Are Recent G2 Reviews of IBM Instana?

What Are G2 Users Discussing About IBM Instana?

Datadog

Datadog is the monitoring, security and analytics platform for developers, IT operations teams, security engineers and business users in the cloud age. The SaaS platform integrates and automates infrastructure monitoring, application performance monitoring and log management to provide unified, real-time observability of our customers' entire technology stack. Datadog is used by organizations of all sizes and across a wide range of industries to enable digital transformation and cloud migration, drive collaboration among development, operations, security and business teams, accelerate time to market for applications, reduce time to problem resolution, secure applications and infrastructure, understand user behavior and track key business metrics.

Average Rating: 4.4/5.0

Total Reviews: 715

How Do G2 Users Rate Datadog?

  • Performance Metrics: 8.3/10 (Category avg: 8.3/10)
  • Root Cause Analysis (RCA): 8.0/10 (Category avg: 8.4/10)
  • Real User Monitoring (RUM): 8.6/10 (Category avg: 8.3/10)
  • Has the product been a good partner in doing business?: 8.5/10 (Category avg: 8.9/10)

Who Is the Company Behind Datadog?

  • Seller: Datadog
  • Company Website:
  • Year Founded: 2010
  • HQ Location: New York
  • Twitter: @datadoghq
    51,207 Twitter followers
  • LinkedIn® Page: www.linkedin.com
    10,780 employees on LinkedIn®

Who Uses This Product?

  • Who Uses This: Software Engineer, DevOps Engineer
  • Top Industries: Information Technology and Services, Computer Software
  • Company Size: 47% Medium, 34% Large

What Do G2 Reviewers Say About Datadog?

AI-generated summary from verified user reviews

Pros
  • Users appreciate the ease of use of Datadog, enjoying intuitive dashboard creation and straightforward implementation.
  • Users appreciate the intuitive monitoring features of Datadog, enabling easy integration and insightful data analysis.
  • Users value the real-time monitoring capabilities of Datadog, enhancing oversight across various applications and infrastructures.
  • Users appreciate the user-friendly interface and robust integration capabilities of Datadog for effective monitoring.
  • Users value the intuitive dashboard creation in Datadog, which enhances monitoring and analysis efficiency.
Cons
  • Users find Datadog's pricing to be expensive, suggesting it should be more affordable given its features.
  • Users find pricing issues with Datadog, citing rapidly escalating costs and high subscription fees as concerns.
  • Users find the steep learning curve challenging, especially with rapidly evolving features and required knowledge.
  • Users find the costs to be unpredictable and excessively high, especially with data storage and additional features.
  • Users find learning difficulty in Datadog, noting that new users may require training to understand its complexities.

What Are Recent G2 Reviews of Datadog?

What Are G2 Users Discussing About Datadog?

New Relic

New Relic is the all-in-one Intelligent Observability platform built to help engineering and IT teams plan, build, deploy, and run software with confidence. By unifying metrics, events, logs, and traces into a single, secure telemetry cloud, New Relic gives over 25 million engineers real time visibility and AI-powered insights across their entire digital estate, from code to cloud. Designed to replace fragmented point solutions, New Relic consolidates full-stack observability into a single source of truth. The platform brings together Application Performance Monitoring (APM), infrastructure monitoring, log management, digital experience monitoring (DEM), container monitoring, and AIOps into one cohesive interface. Powered by an advanced AI engine, New Relic automatically pairs telemetry data to shift problem solving from reactive debugging to proactive and predictive resolution, helping teams reduce mean time to resolution (MTTR) and eliminate digital disruptions before they impact end users. Equipped with over 500 open source integrations, New Relic seamlessly connects with your existing stack. Coupled with transparent, consumption and user-based pricing, organizations gain full predictability over their costs without sacrificing telemetry depth.

Average Rating: 4.4/5.0

Total Reviews: 569

How Do G2 Users Rate New Relic?

  • Performance Metrics: 8.5/10 (Category avg: 8.3/10)
  • Root Cause Analysis (RCA): 8.6/10 (Category avg: 8.4/10)
  • Real User Monitoring (RUM): 8.6/10 (Category avg: 8.3/10)
  • Has the product been a good partner in doing business?: 8.5/10 (Category avg: 8.9/10)

Who Is the Company Behind New Relic?

  • Seller: New Relic
  • Company Website:
  • Year Founded: 2008
  • HQ Location: San Francisco, CA
  • Twitter: @newrelic
    65,727 Twitter followers
  • LinkedIn® Page: www.linkedin.com
    3,093 employees on LinkedIn®

Who Uses This Product?

  • Who Uses This: Software Engineer, Senior Software Engineer
  • Top Industries: Information Technology and Services, Computer Software
  • Company Size: 43% Medium, 30% Large

What Do G2 Reviewers Say About New Relic?

AI-generated summary from verified user reviews

Pros
  • Users appreciate the intuitive and easy-to-use interface of New Relic, making navigation and analysis seamless.
  • Users value the real-time monitoring in New Relic, benefiting from immediate insights and customizable dashboards.
  • Users appreciate the real-time monitoring capabilities of New Relic, enabling proactive issue detection and resolution.
  • Users value the real-time performance insights from New Relic, enabling proactive issue detection and improved user experience.
  • Users appreciate the advanced analytics of New Relic, benefitting from customizable dashboards and real-time performance insights.
Cons
  • Users find New Relic to be expensive, particularly for smaller teams and high data volume demands.
  • Users feel that pricing issues make New Relic expensive for smaller teams, especially with scaling data volumes.
  • Users find the steep learning curve of New Relic challenging, especially when mastering its advanced features and UI.
  • Users find the complexity of New Relic's interface and setup to be overwhelming and difficult to navigate.
  • Users find the difficult learning curve of New Relic challenging, especially for newcomers navigating its extensive features.

What Are Recent G2 Reviews of New Relic?

What Are G2 Users Discussing About New Relic?

Dynatrace

Dynatrace is advancing observability for today’s digital businesses, helping to transform the complexity of modern digital ecosystems into powerful business assets. By leveraging AI-powered insights, Dynatrace enables organizations to analyze, automate, and innovate faster to drive their business forward. To learn more about how Dynatrace can help your business, visit www.dynatrace.com, visit our blog and follow us on LinkedIn and X @dynatrace.

Average Rating: 4.5/5.0

Total Reviews: 1,235

How Do G2 Users Rate Dynatrace?

  • Performance Metrics: 8.2/10 (Category avg: 8.3/10)
  • Root Cause Analysis (RCA): 8.2/10 (Category avg: 8.4/10)
  • Real User Monitoring (RUM): 8.7/10 (Category avg: 8.3/10)
  • Has the product been a good partner in doing business?: 8.7/10 (Category avg: 8.9/10)

Who Is the Company Behind Dynatrace?

  • Seller: Dynatrace
  • Year Founded: 2005
  • HQ Location: Boston, MA
  • Twitter: @Dynatrace
    18,668 Twitter followers
  • LinkedIn® Page: www.linkedin.com
    6,181 employees on LinkedIn®
  • Ownership: NYSE: DT

Who Uses This Product?

  • Who Uses This: Software Engineer, Senior Software Engineer
  • Top Industries: Information Technology and Services, Financial Services
  • Company Size: 69% Large, 23% Medium

What Do G2 Reviewers Say About Dynatrace?

AI-generated summary from verified user reviews

Pros
  • Users appreciate the ease of use of Dynatrace, enjoying seamless application instrumentation and comprehensive support.
  • Users value the insightful dashboarding of Dynatrace, enhancing executive views and simplifying monitoring processes.
  • Users value the comprehensive monitoring capabilities of Dynatrace, enhancing problem identification and prevention effectively.
  • Users value the effective debugging capabilities of Dynatrace, enhancing their ability to identify and resolve issues promptly.
  • Users value the robust analytics and integration features of Dynatrace, enhancing their monitoring and debugging capabilities.
Cons
  • Users find the steep learning curve of Dynatrace challenging, making it hard to fully utilize its features.
  • Users find that missing features in Dynatrace hinder detailed analysis and communication regarding updates and fixes.
  • Users find Dynatrace's complexity overwhelming, with a steep learning curve and costly pricing affecting usability.
  • Users find the learning difficulty challenging due to overwhelming information and inconsistencies in functionality.
  • Users find the costly nature of Dynatrace challenging, making it more suitable for large enterprises only.

What Are Recent G2 Reviews of Dynatrace?

What Are G2 Users Discussing About Dynatrace?

LogRocket

LogRocket is an AI session replay and product analytics tool that helps digital teams understand why users are having bad experiences and ship fixes more quickly. At the core of the platform is Galileo, LogRocket’s AI that continuously watches session replays from real users, reads support tickets, listens to customer calls, and tracks product changes to surface user struggles and technical issues automatically. LogRocket then routes these fixes into the development workflow (including AI coding tools such as Cursor and Claude Code) to help teams fix issues faster. LogRocket is used by engineers, product managers, and UX teams building web and mobile applications. Galileo surfaces issues proactively, so instead of going into the platform to look for problems, teams are alerted to what matters most and handed the context they need to act. Core capabilities include: - Session replay: Pixel-perfect recordings of user sessions captured alongside console logs, network requests, Redux state, and performance data, giving engineers the context needed to reproduce issues without guesswork. - Error and performance monitoring: Automatic capture of JavaScript errors, network failures, and performance degradation, surfaced alongside the session in which they occurred. - Product analytics: Funnel analysis, user segmentation, feature usage tracking, and retention metrics, built on the same session data used for debugging. - Workflow integrations: Connects with tools including Jira, GitHub, Datadog, and Intercom, routing issues identified in LogRocket into existing development and support workflows. - MCP server: Allows AI agents to connect directly to LogRocket, enabling them to watch real session replays and gain context on the user experience. LogRocket supports modern web frameworks, including React, Angular, and Vue, as well as native iOS and Android applications. LogRocket is shortening the distance between identifying a user problem and shipping a fix. The platform integrates with AI coding tools such as Cursor and Claude Code, allowing issues identified in the platform to be passed directly to an AI agent as a fully-loaded coding task, complete with session replay, error context, and reproduction steps.

Average Rating: 4.6/5.0

Total Reviews: 2,409

How Do G2 Users Rate LogRocket?

  • Performance Metrics: 8.2/10 (Category avg: 8.3/10)
  • Root Cause Analysis (RCA): 8.1/10 (Category avg: 8.4/10)
  • Real User Monitoring (RUM): 8.7/10 (Category avg: 8.3/10)
  • Has the product been a good partner in doing business?: 9.1/10 (Category avg: 8.9/10)

Who Is the Company Behind LogRocket?

  • Seller: LogRocket, Inc.
  • Company Website:
  • Year Founded: 2016
  • HQ Location: Boston, Massachusetts
  • Twitter: @LogRocket
    14,756 Twitter followers
  • LinkedIn® Page: www.linkedin.com
    429 employees on LinkedIn®

Who Uses This Product?

  • Who Uses This: Software Engineer, CTO
  • Top Industries: Computer Software, Information Technology and Services
  • Company Size: 60% Small, 30% Medium

What Do G2 Reviewers Say About LogRocket?

AI-generated summary from verified user reviews

Pros
  • Users find session replay invaluable for understanding user interactions and diagnosing problems efficiently, enhancing support and workflows.
  • Users appreciate the ease of use in LogRocket, enabling quick adoption and effective implementation for all skill levels.
  • Users value the powerful insights from LogRocket, enhancing visibility into user issues and streamlining debugging processes.
  • Users love the user insights from LogRocket, helping them understand actual interactions and improve their products effectively.
  • Users value the user behavior tracking of LogRocket, enhancing troubleshooting and understanding of product interactions.
Cons
  • Users encounter unreliable session availability, making it challenging to verify actions and affecting their workflow.
  • Users find LogRocket lacking in essential features like location-based session controls and improved network inspection.
  • Users experience filtering issues with LogRocket, making it difficult to query elements effectively and customize reports.
  • Users feel that LogRocket's pricing is expensive, especially with many sessions, limiting accessibility for some businesses.
  • Users find search difficulty in LogRocket, particularly with time ranges and tracking user clicks.

What Are Recent G2 Reviews of LogRocket?

Sentry

Sentry is an application monitoring and error tracking platform that helps developers identify, debug, and resolve software issues in production environments across web, mobile, desktop, game, and AI-powered applications. The platform captures errors, crashes, and performance problems in real time, providing developers with stack traces, user context, and diagnostic data needed to reproduce and fix bugs. Sentry supports over 100 programming languages and frameworks, including JavaScript, Python, Java, Ruby, PHP, Go, React, Django, and mobile platforms like iOS and Android. Core monitoring capabilities: - Error tracking groups similar errors into issues, showing frequency, affected users, and the exact code location where problems occur - Performance monitoring traces requests through distributed systems to identify slow database queries, API bottlenecks, and code-level performance problems - Session Replay records user interactions leading up to errors, capturing clicks, network activity, and console logs for easier reproduction - Logs captures structured log data from your applications alongside errors and traces, enabling search and filtering by message content, severity level, and custom attributes - AI observability provides visibility into LLM applications, AI agents, and Model Context Protocol servers, tracking prompts, model calls, tool usage, and token consumption Developers integrate Sentry by installing an SDK and adding a few lines of code to their application. The platform automatically captures unhandled exceptions, while developers can manually track custom errors and performance metrics. Sentry processes events in real time, sending alerts through Slack, email, PagerDuty, or other notification channels when issues occur. Additional features and capabilities: - AI-powered debugging through Seer, which analyzes errors to identify root causes and suggest code fixes with high accuracy - Distributed tracing that follows requests across microservices, serverless functions, and third-party APIs to pinpoint failure points - Custom dashboards and alerts for monitoring specific metrics, error rates, or performance thresholds important to each team - Profiling tools that provide code-level visibility into where time is being spent in production, identifying slow functions, call stacks, and performance regressions across backend services and frontend/mobile user flows - Workflow integrations with GitHub, Jira, GitLab, Azure DevOps, and other development tools to create tickets or link errors to commits automatically The platform serves development teams at organizations ranging from individual developers to large enterprises. More than 100,000 organizations use Sentry, processing billions of error events daily. Sentry offers both cloud-hosted and self-hosted deployment options, with pricing tiers based on event volume. A free tier supports small projects and individual developers.

Average Rating: 4.5/5.0

Total Reviews: 224

How Do G2 Users Rate Sentry?

  • Performance Metrics: 7.8/10 (Category avg: 8.3/10)
  • Root Cause Analysis (RCA): 8.9/10 (Category avg: 8.4/10)
  • Real User Monitoring (RUM): 8.9/10 (Category avg: 8.3/10)
  • Has the product been a good partner in doing business?: 9.1/10 (Category avg: 8.9/10)

Who Is the Company Behind Sentry?

  • Seller: Sentry
  • Company Website:
  • Year Founded: 2011
  • HQ Location: San Francisco, CA
  • Twitter: @getsentry
    295 Twitter followers
  • LinkedIn® Page: www.linkedin.com
    448 employees on LinkedIn®

Who Uses This Product?

  • Who Uses This: Software Engineer, Senior Software Engineer
  • Top Industries: Computer Software, Information Technology and Services
  • Company Size: 60% Small, 29% Medium

What Do G2 Reviewers Say About Sentry?

AI-generated summary from verified user reviews

Pros
  • Users appreciate the ease of use of Sentry, allowing quick implementation and straightforward monitoring of applications.
  • Users value the insightful error tracking of Sentry, enabling quicker issue resolution and improved application observability.
  • Users find Sentry's monitoring features indispensable, offering versatility in observability and easy application monitoring.
  • Users appreciate the easy setup of Sentry, enabling quick implementation and efficient error monitoring across projects.
  • Users value the real-time error tracking and detailed bug insights, enhancing team collaboration and issue resolution significantly.
Cons
  • Users find Sentry's pricing issues challenging, especially with limited plan options and frequent budget increases.
  • Users find Sentry expensive, particularly for small projects, with limited plan options and high entry costs.
  • Users experience frequent error budget exhaustion requiring constant adjustments, leading to monitoring challenges and unexpected failures.
  • Users find the UI to be complex and disorganized, particularly challenging for first-time users.
  • Users find the complex configuration of Sentry challenging, particularly during the initial setup and integration process.

What Are Recent G2 Reviews of Sentry?

What Are G2 Users Discussing About Sentry?

OpManager Nexus

OpManager Nexus is a full-stack observability platform that helps IT teams monitor and manage their entire infrastructure, including networks, servers, applications, databases, and websites, from a single console. Designed for mid-size to large organizations managing hybrid and on-premises environments, OpManager Nexus provides deep visibility across every layer of the IT stack. IT teams gain a consolidated view of their infrastructure, eliminating the need for multiple disconnected monitoring tools and reducing the operational overhead that comes with managing them. This unified approach enables faster decision-making and helps organizations maintain service reliability across complex, distributed environments where downtime can have a direct impact on business continuity. OpManager Nexus includes AIOps capabilities that go beyond traditional monitoring. Agentic AI and generative AI integrations automate routine diagnostics and accelerate issue resolution, while smart event correlation identifies relationships between alerts across the stack. Together, these capabilities help IT teams detect issues early, cut through alert noise, and resolve problems before they impact end users or broader business operations. For IT teams dealing with high volumes of events across large environments, this level of automation significantly reduces the time spent on manual troubleshooting. On the deployment front, OpManager Nexus supports both on-premises installation and cloud access (powered by Site24x7) through ManageEngine's private datacenters. Organizations can choose the model that aligns with their infrastructure strategy, security policies, and compliance requirements, without compromising on monitoring depth or platform capability. As part of the ManageEngine ecosystem, OpManager Nexus integrates natively with ITSM, analytics, and security tools, giving IT teams the full operational context needed to manage infrastructure performance and respond to incidents end to end.

Average Rating: 4.6/5.0

Total Reviews: 231

How Do G2 Users Rate OpManager Nexus?

  • Performance Metrics: 7.7/10 (Category avg: 8.3/10)
  • Root Cause Analysis (RCA): 8.1/10 (Category avg: 8.4/10)
  • Real User Monitoring (RUM): 7.6/10 (Category avg: 8.3/10)
  • Has the product been a good partner in doing business?: 9.0/10 (Category avg: 8.9/10)

Who Is the Company Behind OpManager Nexus?

  • Seller: Zoho
  • Company Website:
  • Year Founded: 1996
  • HQ Location: Austin, TX
  • Twitter: @Zoho
    137,880 Twitter followers
  • LinkedIn® Page: www.linkedin.com
    30,913 employees on LinkedIn®

Who Uses This Product?

  • Who Uses This: IT Manager, Network Administrator
  • Top Industries: Information Technology and Services, Financial Services
  • Company Size: 53% Medium, 32% Large

What Do G2 Reviewers Say About OpManager Nexus?

AI-generated summary from verified user reviews

Pros
  • Users value the effective monitoring capabilities of OpManager Nexus, essential for managing bandwidth and network performance.
  • Users value the real-time monitoring capabilities of OpManager Nexus, enhancing issue resolution and network visibility.
  • Users find OpManager Nexus to have ease of use with intuitive dashboards and efficient monitoring capabilities.
  • Users appreciate the comprehensive monitoring capabilities of OpManager Nexus, enhancing the management of critical devices and networks.
  • Users value the real-time alert notifications of OpManager Nexus, enhancing their network monitoring and issue resolution efficiency.
Cons
  • Users find the setup complex for large networks, with performance slowdowns and additional licensing adding to the challenge.
  • Users find the complex configuration of OpManager Nexus challenging, particularly in large network setups and advanced features.
  • Users find the complex setup of OpManager Nexus challenging, especially for large networks and during onboarding.
  • Users note the missing features in OpManager Nexus, particularly lacking advanced metrics and cloud-native integrations.
  • Users find the difficult configuration of OpManager challenging, particularly when managing alerts and third-party integrations.

What Are Recent G2 Reviews of OpManager Nexus?

What Are G2 Users Discussing About OpManager Nexus?

Site24x7

ManageEngine Site24x7 offers unified cloud monitoring for DevOps and IT operations within small to large organizations. The solution monitors the experience of real users accessing websites and applications from desktop and mobile devices. In-depth monitoring capabilities enable DevOps teams to monitor and troubleshoot applications, servers and network infrastructure, including private and public clouds. End-user experience monitoring is done from more than 100 locations across the world and various wireless carriers.

Average Rating: 4.6/5.0

Total Reviews: 463

How Do G2 Users Rate Site24x7?

  • Performance Metrics: 8.5/10 (Category avg: 8.3/10)
  • Root Cause Analysis (RCA): 8.6/10 (Category avg: 8.4/10)
  • Real User Monitoring (RUM): 8.6/10 (Category avg: 8.3/10)
  • Has the product been a good partner in doing business?: 8.9/10 (Category avg: 8.9/10)

Who Is the Company Behind Site24x7?

  • Seller: Zoho
  • Year Founded: 1996
  • HQ Location: Austin, TX
  • Twitter: @Zoho
    137,880 Twitter followers
  • LinkedIn® Page: www.linkedin.com
    30,913 employees on LinkedIn®
  • Phone: +1 (888) 900-9646

Who Uses This Product?

  • Who Uses This: CEO, IT Manager
  • Top Industries: Information Technology and Services, Computer Software
  • Company Size: 46% Medium, 41% Small

What Do G2 Reviewers Say About Site24x7?

AI-generated summary from verified user reviews

Pros
  • Users appreciate the ease of use of Site24x7, making implementation and daily operations smooth and efficient.
  • Users appreciate the single pane of glass visibility in Site24x7, enhancing efficiency and monitoring flexibility.
  • Users appreciate the real-time monitoring capabilities of Site24x7, providing comprehensive oversight for networks and infrastructure.
  • Users value the extensive monitoring features of Site24x7, enabling efficient oversight of multiple resources from one interface.
  • Users enjoy the extensive visibility of Site24x7, appreciating its ease of setup and efficient monitoring capabilities.
Cons
  • Users face missing alerts and limited interface visibility, hindering their ability to monitor system efficiency effectively.
  • Users find the complexity of tool integration and plan options overwhelming, preferring a simplified default view.
  • Users find the pricing overwhelming and feel it could be more flexible for smaller businesses or startups.
  • Users find the learning curve for advanced features of Site24x7 challenging, impacting effective usage of the platform.
  • Users find the UI lacking modernity, making it difficult to adopt and navigate smoothly.

What Are Recent G2 Reviews of Site24x7?

What Are G2 Users Discussing About Site24x7?

Coralogix

Coralogix is a modern, full-stack observability platform transforming how businesses process and understand their data. Our unique architecture powers in-stream analytics without reliance on indexing or hot storage. We specialize in comprehensive monitoring of logs, metrics, trace and security events, enhancing operational efficiency and reducing total cost of ownership by up to 70%. Coralogix stands out for its simple pricing model, based solely on data volume ingested and retained, and offers free, fast customer support with less than 30 second response time and 1 hour resolution time. Our platform covers the entire range of observability with features such as APM, RUM, SIEM, Kubernetes monitoring and more, all streamlined for quick integration and immediate value. Components within the stream store the system state to provide stateful insights and real-time alerting without ever needing to index the data — so there are never any trade-offs to achieve observability. Once ingested, parsed, and enriched, data is written remotely to an archive bucket controlled by the client. The archive can be queried directly at any time, from the platform UI or via CLI, giving users infinite retention with full control over, and access to, their data. View and query your data from any dashboard using any syntax. Coralogix has successfully completed relevant security and privacy compliances by BDO including GDPR, SOC 2, PCI, HIPAA, and ISO 27001/27701.

Average Rating: 4.6/5.0

Total Reviews: 339

How Do G2 Users Rate Coralogix?

  • Performance Metrics: 8.5/10 (Category avg: 8.3/10)
  • Root Cause Analysis (RCA): 8.4/10 (Category avg: 8.4/10)
  • Real User Monitoring (RUM): 8.0/10 (Category avg: 8.3/10)
  • Has the product been a good partner in doing business?: 9.4/10 (Category avg: 8.9/10)

Who Is the Company Behind Coralogix?

  • Seller: Coralogix
  • Company Website:
  • Year Founded: 2014
  • HQ Location: San Francisco, CA
  • Twitter: @Coralogix
    4,102 Twitter followers
  • LinkedIn® Page: www.linkedin.com
    591 employees on LinkedIn®

Who Uses This Product?

  • Who Uses This: Software Engineer, DevOps Engineer
  • Top Industries: Computer Software, Information Technology and Services
  • Company Size: 53% Medium, 34% Large

What Do G2 Reviewers Say About Coralogix?

AI-generated summary from verified user reviews

Pros
  • Users appreciate the ease of use of Coralogix, highlighting its simple setup and efficient integrations.
  • Users value the integration of logs, metrics, and alerts, enhancing efficiency in root-cause analysis and monitoring.
  • Users commend the exceptional customer support of Coralogix, ensuring quick resolutions and a smooth experience.
  • Users value the real-time monitoring of Coralogix, enhancing their understanding of user behavior and improving incident response.
  • Users value the intuitive user interface of Coralogix, appreciating its ease of log searching and export functionality.
Cons
  • Users find that the learning curve is steep for beginners, making navigation and understanding features challenging.
  • Users find the learning difficulty of Coralogix challenging, especially when navigating advanced features and the overwhelming UI.
  • Users experience slow performance with Coralogix, leading to frustration due to delayed log fetching and UI loading.
  • Users find the difficult learning curve of Coralogix challenging, especially for beginners navigating complex options.
  • Users find the missing feature for downloading log results a significant limitation in Coralogix's functionality.

What Are Recent G2 Reviews of Coralogix?

Google Cloud Console

Your integrated Google Cloud Platform management console. Manage and get insights into everything that powers your cloud application — including web applications, data analysis, virtual machines, datastore, databases, networking, and developer services. The Google Cloud console helps you deploy, scale, and diagnose production issues in a simple web-based interface. Search to quickly find resources and connect to instances via SSH in the browser. Handle DevOps workflows on the go with powerful native iOS and Android applications. Master the most complex development tasks with Cloud Shell, your admin machine in the cloud.

Average Rating: 4.4/5.0

Total Reviews: 95

How Do G2 Users Rate Google Cloud Console?

  • Performance Metrics: 8.0/10 (Category avg: 8.3/10)
  • Root Cause Analysis (RCA): 8.5/10 (Category avg: 8.4/10)
  • Real User Monitoring (RUM): 8.3/10 (Category avg: 8.3/10)
  • Has the product been a good partner in doing business?: 8.7/10 (Category avg: 8.9/10)

Who Is the Company Behind Google Cloud Console?

  • Seller: Google
  • Year Founded: 1998
  • HQ Location: Mountain View, CA
  • Twitter: @google
    31,899,995 Twitter followers
  • LinkedIn® Page: www.linkedin.com
    301,144 employees on LinkedIn®
  • Ownership: NASDAQ:GOOG

Who Uses This Product?

  • Top Industries: Computer Software, Information Technology and Services
  • Company Size: 48% Small, 38% Medium

What Do G2 Reviewers Say About Google Cloud Console?

AI-generated summary from verified user reviews

Pros
  • Users appreciate the ease of use of Google Cloud Console, enhancing their experience across various services.
  • Users appreciate the intuitive user interface of Google Cloud Console, enhancing their productivity and overall experience.
  • Users appreciate the clean and accessible dashboard of Google Cloud Console for its user-friendly experience.
  • Users appreciate the navigation ease of Google Cloud Console, enjoying a clean dashboard and efficient search functionality.
  • Users value the flexibility of Google Cloud Console, easily customizing and adapting it to their needs and preferences.
Cons
  • Users face a long learning curve with Google Cloud Console, making it challenging to navigate complex functionalities.
  • Users find the expensive pricing of Google Cloud Console to be a significant drawback for small businesses.
  • Users struggle with poor UI design that lacks clarity and responsiveness, making navigation frustrating and risky.
  • Users face mobile limitations with Google Cloud Console due to an unresponsive interface and lack of a dedicated app.
  • Users find the search functionality challenging, often receiving irrelevant results when looking for specific services.

What Are Recent G2 Reviews of Google Cloud Console?

What Are G2 Users Discussing About Google Cloud Console?

Rakuten SixthSense Observability

In today's digital landscape, businesses need a powerful and comprehensive Application Performance Monitoring (APM) solution to stay ahead of the curve. Introducing Rakuten SixthSense Observability - a next-generation APM tool that transforms the way you monitor, analyze, and optimize your applications and infrastructure. With its robust suite of features and advanced analytics, Rakuten SixthSense Observability empowers you to proactively identify and resolve issues, streamline operations, and enhance customer experiences. Key Capabilities: • Comprehensive Monitoring and Alerting: Rakuten SixthSense Observability offers end-to-end monitoring of your applications, infrastructure, and network performance. With real-time alerting and customizable dashboards, you can quickly detect issues and gain actionable insights into the health and performance of your systems. • Distributed Tracing and Correlation: Gain full visibility into your application's performance with distributed tracing, which tracks transactions and requests across multiple services and components. This feature helps you identify bottlenecks, latency issues, and errors, making it easier to optimize your application and enhance customer experiences. • Anomaly Detection and Machine Learning: Leverage Rakuten SixthSense's advanced machine learning capabilities to automatically identify unusual patterns and deviations in application performance and resource utilization. This proactive approach enables you to detect and resolve issues before they impact your business and customers. • Advanced Analytics and Visualization: Rakuten SixthSense's rich data visualization and analytics tools allow you to dive deep into your application performance data. Generate custom reports, analyze trends, and uncover hidden patterns that can drive continuous improvement and optimization. • Log Management and Integration: Effortlessly collect, analyze, and store logs from various sources with Rakuten SixthSense's integrated log management feature. This seamless integration enables you to correlate log data with performance metrics and traces, providing a comprehensive understanding of your application's behaviour. • Scalability and Flexibility: Rakuten SixthSense Observability is built to scale with your growing business needs, supporting a wide range of applications, services, and infrastructure. Its flexible architecture allows you to customize the tool to your specific requirements and integrate it with other monitoring and observability solutions. Current Feature set: • Application Performance Monitoring: Full stack visibility across Java, PHP, Node.js, Python, Go and a lot more! Key Features include, Distributed Tracing, Profiling, Database Monitoring • Infrastructure Monitoring: Get a birds-eye view of your infrastructure health and gain granular insights with easy deployment Key Features include Kubernetes, VMs, Web Servers, Cloud Integrations • Digital Experience Monitoring: Improve the end-user experience of your applications mapped with contextual information of application performance metrics • Browser Monitoring: Metrics to optimize end users’ experience and help in improving application performance. • Mobile Monitoring: Monitor crashes, performance & usage metrics for your mobile applications • Synthetic Monitoring: Stimulate end-user transactions using low code, no code test scripts • VM Monitoring: VM monitoring capability lets you view your infrastructure performance and health of servers, virtual machines, containers, databases etc. at a glance. • SixthSense Cognitive Engine: Modern observability and the proactive approach using artificial intelligence. The application uses different AI/ML algorithms that can predict performance metrics with an accuracy of up to 98% and a confidence level of 90%.

Average Rating: 4.6/5.0

Total Reviews: 52

How Do G2 Users Rate Rakuten SixthSense Observability?

  • Performance Metrics: 8.9/10 (Category avg: 8.3/10)
  • Root Cause Analysis (RCA): 9.0/10 (Category avg: 8.4/10)
  • Real User Monitoring (RUM): 9.1/10 (Category avg: 8.3/10)
  • Has the product been a good partner in doing business?: 9.2/10 (Category avg: 8.9/10)

Who Is the Company Behind Rakuten SixthSense Observability?

Who Uses This Product?

  • Who Uses This: Senior Software Engineer
  • Top Industries: Information Technology and Services, Computer Games
  • Company Size: 47% Large, 38% Medium

What Do G2 Reviewers Say About Rakuten SixthSense Observability?

AI-generated summary from verified user reviews

Pros
  • Users appreciate the deep visibility offered by Rakuten SixthSense, enhancing application performance and proactively managing issues.
  • Users value the effective alerting system for seamless monitoring and quick resolution of issues in one dashboard.
  • Users value the excellent customer support of Rakuten SixthSense, enhancing their overall experience and productivity.
  • Users appreciate the ease of use of Rakuten SixthSense Observability, enabling quick identification of issues without hassle.
  • Users find the implementation ease of Rakuten SixthSense Observability impressive, allowing quick access to essential monitoring tools.
Cons
  • Users find the complex setup of Rakuten SixthSense Observability requires significant onboarding effort for optimal use.
  • Users find the documentation lacking, making onboarding and setup more challenging than necessary.
  • Users often face false positive alerts and desire better functionality for error monitoring and dashboard notifications.
  • Users report experiencing inefficient alerts, citing false positives and a lack of preferred error record displays.
  • Users note that the documentation needs improvement, which impacts their ability to utilize the tool effectively.

What Are Recent G2 Reviews of Rakuten SixthSense Observability?

ServiceNow IT Operations Management

ServiceNow IT Operations Management (ITOM) is a comprehensive solution designed to enhance the visibility, health, and optimization of an organization's IT infrastructure. By integrating advanced automation and artificial intelligence, ITOM enables proactive management of IT operations, reducing downtime and improving service delivery. Key Features and Functionality: - ITOM Visibility: Automates the discovery of IT assets across on-premises, cloud, and hybrid environments, providing a unified view of the infrastructure. Service Mapping identifies dependencies between IT components, facilitating impact analysis and change management. - ITOM Health: Consolidates and correlates events from various monitoring tools, enabling IT teams to prioritize and respond to critical incidents promptly. Operational Intelligence leverages AI and machine learning to detect patterns and anomalies, allowing for proactive issue resolution. - ITOM Optimization: Manages cloud resources effectively by providing visibility and control over public, private, and hybrid cloud environments. Automates provisioning, lifecycle management, and cost optimization of IT resources supporting application services. Primary Value and Solutions Provided: ServiceNow ITOM addresses the challenges of managing complex IT environments by offering a unified platform that enhances operational efficiency and service reliability. It enables organizations to transition from reactive to proactive operations, minimizing the risk of outages and optimizing resource utilization. By automating routine tasks and providing real-time insights, ITOM empowers IT teams to focus on strategic initiatives, ultimately driving business growth and resilience.

Average Rating: 4.4/5.0

Total Reviews: 462

How Do G2 Users Rate ServiceNow IT Operations Management?

  • Performance Metrics: 8.5/10 (Category avg: 8.3/10)
  • Root Cause Analysis (RCA): 8.5/10 (Category avg: 8.4/10)
  • Real User Monitoring (RUM): 8.6/10 (Category avg: 8.3/10)
  • Has the product been a good partner in doing business?: 8.8/10 (Category avg: 8.9/10)

Who Is the Company Behind ServiceNow IT Operations Management?

  • Seller: ServiceNow
  • Company Website:
  • Year Founded: 2004
  • HQ Location: Santa Clara, CA
  • Twitter: @servicenow
    55,548 Twitter followers
  • LinkedIn® Page: www.linkedin.com
    35,078 employees on LinkedIn®

Who Uses This Product?

  • Top Industries: Information Technology and Services, Financial Services
  • Company Size: 50% Large, 21% Medium

What Do G2 Reviewers Say About ServiceNow IT Operations Management?

AI-generated summary from verified user reviews

Pros
  • Users appreciate the ease of use of ServiceNow IT Operations Management, enhancing customer support and operational efficiency.
  • Users value the visibility provided by ServiceNow IT Operations Management, enhancing transparency and driving productivity across the organization.
  • Users value the visibility and insights provided by ServiceNow IT Operations Management, enhancing infrastructure and application management.
  • Users value the time-saving automation in ServiceNow IT Operations Management, enhancing transparency and operational control.
  • Users praise the exceptional flexibility of ServiceNow IT Operations Management, enhancing case resolution and documentation efficiency.
Cons
  • Users face a steep learning curve with ServiceNow IT Operations Management due to its complexity and numerous features.
  • Users find the complexity of ServiceNow IT Operations Management to be a significant barrier, hindering effective setup and usage.
  • Users find the setup complexity to be a challenge, requiring significant effort and expertise to navigate effectively.
  • Users find ServiceNow IT Operations Management to be expensive, which may limit accessibility for smaller organizations.
  • Users face a steep learning curve with ServiceNow IT Operations Management, making effective use challenging and time-consuming.

What Are Recent G2 Reviews of ServiceNow IT Operations Management?

What Are G2 Users Discussing About ServiceNow IT Operations Management?

Grafana Labs

Grafana Labs provides an open and composable monitoring and observability stack built around Grafana, the leading open source technology for dashboards and visualization. There are more than 3,000 Grafana Labs customers, including Bloomberg, Citigroup, Dell Technologies, Salesforce, and TomTom, and more than 1 million active instances of Grafana around the world. Grafana Labs helps companies manage their observability strategies with the LGTM Stack, which can be run fully managed with Grafana Cloud or self-managed with the Grafana Enterprise offerings, both featuring scalable metrics (Grafana Mimir), logs (Grafana Loki), and traces (Grafana Tempo) as well as extensive enterprise data source plugins, dashboard management, alerting, reporting, and security. Grafana Labs is backed by leading investors Lightspeed Venture Partners, Lead Edge Capital, GIC, Sequoia Capital, Coatue, and J.P. Morgan. Follow Grafana Labs on LinkedIn and Twitter or visit https://grafana.com.

Average Rating: 4.5/5.0

Total Reviews: 199

How Do G2 Users Rate Grafana Labs?

  • Performance Metrics: 8.8/10 (Category avg: 8.3/10)
  • Root Cause Analysis (RCA): 8.9/10 (Category avg: 8.4/10)
  • Real User Monitoring (RUM): 8.3/10 (Category avg: 8.3/10)
  • Has the product been a good partner in doing business?: 8.3/10 (Category avg: 8.9/10)

Who Is the Company Behind Grafana Labs?

  • Seller: Grafana Labs
  • Year Founded: 2014
  • HQ Location: New York
  • Twitter: @grafana
    71,444 Twitter followers
  • LinkedIn® Page: www.linkedin.com
    1,907 employees on LinkedIn®

Who Uses This Product?

  • Who Uses This: Software Engineer, Senior Software Engineer
  • Top Industries: Information Technology and Services, Computer Software
  • Company Size: 48% Medium, 26% Large

What Do G2 Reviewers Say About Grafana Labs?

AI-generated summary from verified user reviews

Pros
  • Users value the intuitive and flexible interface of Grafana for creating interactive and seamless dashboards.
  • Users appreciate the ease of use of Grafana, enjoying seamless monitoring and intuitive dashboard creation.
  • Users value the intuitive and flexible dashboard interface of Grafana, enhancing their data visualization and monitoring experiences.
  • Users value the real-time monitoring capabilities of Grafana Labs, enhancing visibility and responsiveness for complex metrics.
  • Users value Grafana's flexibility and clarity in monitoring, making complex data visualization easy and effective.
Cons
  • Users find the learning curve steep, with challenging setup and limited documentation impacting accessibility for newcomers.
  • Users find the complex setup of Grafana Labs challenging, especially when configuring data sources and writing queries.
  • Users find the difficult learning curve to be a significant challenge, especially for advanced features and configurations.
  • Users find the learning difficulty of Grafana challenging, particularly in navigating the interface and setup processes.
  • Users find the complexity of initial setup and query writing in Grafana Labs to be challenging and time-consuming.

What Are Recent G2 Reviews of Grafana Labs?

What Are G2 Users Discussing About Grafana Labs?

ManageEngine Applications Manager

ManageEngine Applications Manager is an application performance & IT infrastructure monitoring solution that is designed to combat modern infrastructure problems and ensure that your business and end users are unaffected by substandard performance and downtime. By leveraging deep application performance monitoring with byte-code instrumentation, infrastructure monitoring, hybrid cloud monitoring, and digital experience monitoring from a single console, IT and DevOps teams will be able to gain code-level insights, automate their processes, pinpoint & resolve performance issues, and deliver better business outcomes. Overall, our product will help businesses optimize application usage & revenue, reduce MTTR, improve DevOps processes, migrate to the cloud with confidence, respond to incidents faster, and ensure seamless user experiences.

Average Rating: 4.7/5.0

Total Reviews: 111

How Do G2 Users Rate ManageEngine Applications Manager?

  • Performance Metrics: 9.1/10 (Category avg: 8.3/10)
  • Root Cause Analysis (RCA): 9.3/10 (Category avg: 8.4/10)
  • Real User Monitoring (RUM): 9.3/10 (Category avg: 8.3/10)
  • Has the product been a good partner in doing business?: 9.3/10 (Category avg: 8.9/10)

Who Is the Company Behind ManageEngine Applications Manager?

  • Seller: Zoho
  • Year Founded: 1996
  • HQ Location: Austin, TX
  • Twitter: @Zoho
    137,880 Twitter followers
  • LinkedIn® Page: www.linkedin.com
    30,913 employees on LinkedIn®
  • Phone: +1 (888) 900-9646

Who Uses This Product?

  • Top Industries: Information Technology and Services, Computer Software
  • Company Size: 46% Medium, 42% Large

What Do G2 Reviewers Say About ManageEngine Applications Manager?

AI-generated summary from verified user reviews

Pros
  • Users appreciate the real-time monitoring capabilities of ManageEngine Applications Manager, enhancing visibility and troubleshooting efficiency.
  • Users value the real-time monitoring capabilities of ManageEngine Applications Manager, enhancing troubleshooting and application health visibility.
  • Users value the real-time monitoring features of ManageEngine Applications Manager for proactive issue resolution and performance tracking.
  • Users value the real-time monitoring capabilities of ManageEngine Applications Manager, enhancing their ability to troubleshoot proactively.
  • Users value the real-time visibility in ManageEngine Applications Manager, enabling proactive issue resolution and performance monitoring.
Cons
  • Users experience limited features that hinder integration and scalability, making it hard to monitor efficiently.
  • Users face feature limitations in ManageEngine Applications Manager, impacting integration and scalability for large enterprises.
  • Users face integration issues that hinder scalability and complicate monitoring across diverse applications in large environments.
  • Users find the learning curve steep for ManageEngine Applications Manager, complicating setup and utilization of advanced features.
  • Users find the initial setup complexity to be time-consuming and challenging, especially in larger environments.

What Are Recent G2 Reviews of ManageEngine Applications Manager?

What Are G2 Users Discussing About ManageEngine Applications Manager?

Splunk Synthetic Monitoring

Splunk Synthetic Monitoring helps you measure and improve uptime and performance for your critical apps and services. Splunk Synthetic Monitoring offers best-in class web performance optimization to delight your users and improve customer experience, while helping improve your SLAs and easily test your entire user funnel and key web and API functionality.

Average Rating: 4.5/5.0

Total Reviews: 26

How Do G2 Users Rate Splunk Synthetic Monitoring?

  • Performance Metrics: 8.6/10 (Category avg: 8.3/10)
  • Root Cause Analysis (RCA): 8.4/10 (Category avg: 8.4/10)
  • Real User Monitoring (RUM): 8.3/10 (Category avg: 8.3/10)
  • Has the product been a good partner in doing business?: 8.7/10 (Category avg: 8.9/10)

Who Is the Company Behind Splunk Synthetic Monitoring?

  • Seller: Cisco
  • Year Founded: 1984
  • HQ Location: San Jose, CA
  • Twitter: @Cisco
    720,366 Twitter followers
  • LinkedIn® Page: www.linkedin.com
    95,294 employees on LinkedIn®
  • Ownership: NASDAQ:CSCO

Who Uses This Product?

  • Top Industries: Computer & Network Security
  • Company Size: 50% Large, 38% Small

What Are Recent G2 Reviews of Splunk Synthetic Monitoring?

Tian Lin
TL
Researched and written by Tian Lin
Updated June 9, 2025

Learn More About Application Performance Monitoring (APM) Tools

What is Application Performance Monitoring (APM) Software?

Application performance monitoring (APM) software allows users to consistently track performance metrics for mobile, web-based, and desktop applications in real time. These metrics can be displayed as reports or on a visual dashboard. Baseline performance metrics can be customized to meet the minimum requirements of maintaining uptime and performance of applications.

APM software helps identify failures or slowdowns within the overall application topology (the way all components supporting an application are connected). When applications are only as strong as their weakest topological component, identifying and bolstering that component is paramount to optimal function. Root-cause analysis (RCA)—the process of determining and fixing the underlying cause of an issue—becomes simpler when APM software reveals the exact failure points, which yields a quicker return to normal function.

End-to-end visibility is another vital component of APM software. Solutions should be able to track full transactions regardless of where components are hosted, so buyers should consider infrastructure needs on this front. Smaller companies generally require only a few servers and databases, and therefore relatively small-scale monitoring and shorter transactions. Conversely, larger enterprise companies tend to have numerous, complex production environments, vast databases, and longer transactional chains. These larger companies require a high volume of virtual servers and services to perform all these tasks efficiently. More powerful APM solutions are designed to scan and monitor on a greater scale.

Scalability should be an important consideration when choosing an APM solution. Whether a company’s requirements are vast or small, an APM solution exists to meet the buyer’s needs. Basic solutions are better suited for monitoring one or a few applications, but should a large number of applications need monitoring, companies should consider APM software that can scale while maintaining high performance. Companies planning on developing while growing should especially consider scalable APM software that can keep up with expanding infrastructure needs.

What Types of Application Performance Monitoring (APM) Software Exist?

Modular APM solutions

Modular APM products—sold function by function, as opposed to as a full package—allow buyers to select exactly the functionalities necessary for their company when purchasing, such as database analysis, web transaction trailing, or network forensics. This is highly beneficial to smaller companies that might not need extensive features. For growing companies, modular APM solutions are particularly beneficial, as new features can be added piecemeal during the growth process. 

All-in-one APM solutions

All-in-one solutions, by contrast, tend to be more beneficial for larger companies, as all the features are available in one package. All-in-one APM solutions tend to be feature-heavy and can be expensive, so acquiring a solution that overperforms might lead to fiscal waste.

Open-source APM solutions

Open-source products often have a lower price point than proprietary software and may even be free. These options may be better for smaller businesses that do not need expansive, feature-rich products. Most open-source products have small or no support staff behind them, so buyers should make sure that they have a good in-house development team when implementing one. 

Proprietary APM solutions

Proprietary software, while more expensive than open-source software, is often more powerful and robust in its performance. These products tend to have stronger, larger support structures in place for implementation and long-term use. Buyers should be cautious that they don’t spend more for a brand name than the functions they need when selecting a proprietary solution. 

What are the Common Features of Application Performance Monitoring (APM) Software?

The following are some core features within APM software that can help users interpret data, manage key alerts, and more:

Metric dashboard: A metric dashboard is an easily digestible, graphical representation of current functionality data. This can include response time meters, use load charting, or other key data. 

Alerting: APM software’s alerting features give users an immediate warning when performance dips below baselines. The software can email teams automatically, show heads-up desktop notifications, or even automate text notifications to key engineers and management.

Comprehensive tracking: Comprehensive tracking refers to the ability to follow all applications, regardless of where they are hosted. Users can optimize hosting options without worrying about lost information by following their cloud application infrastructure in real time, side by side with their local infrastructure.

Transaction and topology analysis: Transaction and topology analysis allows users to present details for every step of a transaction. With end-to-end visibility, there are no secrets about any application functionality at any step. Users can make informed decisions about optimizing functionality with comprehensive data.

What are the Benefits of Application Performance Monitoring (APM) Software?

Improve application performance: Nothing creates more technological headaches than applications that function suboptimally. APM solutions reduce the strain on a system with immediate alerts when performance dips below a certain threshold, allowing companies to address problems as they happen.

Increase consumer satisfaction: A quick turnaround on functionality issues leads to happier consumers. APM solutions assist in identifying stress points and bottlenecks within application topology to focus on troubleshooting exactly where it is needed.

Save money: Application downtime can be costly, both in the time lost to product or service provision and in the resources needed to resolve it. APM solutions help create an environment for applications to run optimally, thereby improving reliability and helping drive customer acquisition and retainment.

Who Uses Application Performance Monitoring (APM) Software?

IT administrators: IT administrators use APM software to monitor their company’s applications and ensure overall system health and performance. APM software is an essential part of an IT professional’s arsenal for managing their company’s digital assets to address performance issues as they arise, and maintain consistency. 

Developers: Developers use APM software to keep a pulse on their developed applications and ensure a consistent, quality experience for the end user. By utilizing APM tools, developers can compare performance against desired benchmarks and effectively begin the remediation process when performance issues arise.

Software Related to Application Performance Monitoring (APM) Software

Related solutions that can be used together with APM software include:

Network monitoring software: Network monitoring software tracks the overall performance of a computer network. APM software can reveal bottlenecks and network-side issues with application performance, at which point network monitoring would take over to provide further details on any issues.

Data center infrastructure management (DCIM) software: DCIM software is used to manage, organize, and monitor the components of a data center. If a user’s APM software reveals failures or slowdowns in retrieving data from their own data center, DCIM software may provide insights on where those failures are.

Log analysis software: Log analysis software helps enable the documentation of application log files for records and analytics. Once APM software identifies a problem location, log analysis software takes over in breaking down activity line by line at that location.

Challenges with Application Performance Monitoring (APM) Software

Software solutions can come with their own set of challenges. 

Programming language incompatibility: It is essential that the chosen APM solution supports the users’ application’s programming language (e.g., Ruby, Java, C#, Python). Otherwise, the solution will not be able to monitor their application. The same consideration should go into selection based upon the language used by the company’s servers. Most solutions will support both Windows and Linux, but buyers should keep in mind the type of Linux environment their organization uses (e.g., Ubuntu, CentOS, and RedHat Enterprise Linux) when selecting an appropriate APM solution. If the Linux environment type is not compatible with a solution, then the solution will not be able to monitor it.

Variable configuration requirements: While some APM solutions require little setup effort, others will need more extensive configuration before monitoring can begin. Configuration can be a challenging process, so finding products that need very little or no configuration to monitor the applications can be a great benefit. APM solutions that do not require configuration have the ability to map the user’s technology to find out how their environments connect and ultimately what makes their applications work.

Which Companies Should Buy Application Performance Monitoring (APM) Software?

A business’s application developers, system engineers, and teams that regularly monitor their company’s application infrastructure benefit greatly from APM solutions. Here are a few industry examples of APM software at work:

Health care providers: Technological uptime and performance are imperative when the goal is improving the customer’s health. APM solutions allow providers to monitor their application performance in real time, which helps catch and prevent downtimes before they affect patients. Full topological and transactional visibility provided by APM software greatly improves RCA time and helps providers to continue giving quality patient care despite technological hiccups.

Online retail businesses: If web purchases drive a majority of the company’s revenue, optimal website and web application performance is critical. Continual monitoring helps businesses not only avoid overloads but also understand their standard traffic patterns. This can then be utilized to predict the optimal allocation of resources for site growth.

Multiplayer game development companies: Most online multiplayer game applications are run either directly through a platform or from a company’s centralized launcher. While the applications themselves are installed locally on an end user’s device, their transactional data—and thus, a player’s ability to interact with other players in-game—is dictated by the game developer’s infrastructure. APM software can help developers deliver a smooth online experience to their player base and maintain consistent quality and ease of use. 

How to Buy Application Performance Monitoring (APM) Software

Requirements Gathering (RFI/RFP) for Application Performance Monitoring (APM) Software 

Whether a company is looking for their first APM software tool or wanting to replace an existing one, g2.com can help find the best tool.

The company’s needs when searching for APM software often relate to specifically desired data and metrics. For example, the user may be most interested in monitoring and improving performance for transactions within their applications. Buyers should make a ranked list of the APM features that most directly address the problems they’re trying to solve, then reference G2 reviews to find the right fit.

Prioritizing the desired feature set can help narrow down the potential pool of APM solutions, allowing teams to then apply further considerations for budget, ease of integration with other systems, security requirements, and more. This holistic approach empowers buyers to move forward with a focused checklist, which can be used in conjunction with G2 scoring to select the best APM product for the business.

Compare Application Performance Monitoring (APM) Software Products

Create a long list

Buyers should start with a large pool of APM software vendors. Keeping the desired must-have features in mind, it is important that buyers perform consistent inquiries during demos by which they can effectively compare the pros and cons of each software solution. 

Create a short list

It helps to cross-reference the results of initial vendor evaluations with G2 reviews from other buyers, the combination of which will help to narrow in on a short three to five product list. From there, buyers can compare pricing and features to determine the best fit.

Conduct demos

As a rule of thumb, companies should make sure to demo all of the products that end up on their short list. During demos, buyers should ask specific questions related to the functionalities they care most about; for example, one might ask to be walked through a typical performance issue from alerting to remediation within the APM tool. 

Selection of Application Performance Monitoring (APM) Software

Choose a selection team

Regardless of a company’s size, it’s important to involve the most relevant personas when beginning the APM software selection process. Larger companies may include individual team members to fill roles such as project manager, decision maker, system owner, and IT professionals and developers who will be working with the software most closely. Smaller companies with fewer employees might overlap roles. 

Negotiation

Many companies offer full monitoring platforms that go beyond APM to include network monitoring, infrastructure monitoring, and more. While some companies will not budge on the configurations of their packages, buyers looking to trim costs should try to negotiate down to the specific functions that matter to them in order to get the best price. For example, a vendor’s pricing page where APM functionality is only included with a robust all-in-one monitoring package, whereas a sales conversation may prove otherwise. 

Final decision

After this stage, it is important to perform a trial run if possible with a small selection of IT professionals or developers. This will help to ensure that the APM software of choice integrates well with an IT administrator’s systems setup or a developers’ day-to-day work. If the APM tool is well liked and well utilized, the buyer can take that as a sign that their selection is the right one. If not, reevaluation of the options may be necessary.

Application Performance Monitoring (APM) Software FAQs

Small Business FAQs

What is the most affordable Application Performance Monitoring (APM) Software for SMBs?

Several APM tools are designed or priced with small businesses in mind, see the full list of APM tools for small businesses on G2 for detailed comparisons. Based on review data, these tools earn high marks from SMBs for value and accessibility:

  • Sentry - offers a generous free tier and transparent pricing that makes it accessible for small development teams needing error tracking and basic APM.
  • Better Stack - provides uptime monitoring, logging, and on-call alerting at a price point that works well for early-stage startups and small engineering teams.
  • Site24x7 - is a cost-effective all-in-one monitoring platform that covers websites, servers, and applications without requiring enterprise-level investment.
  • CubeAPM - is a lightweight, open-source-friendly APM tool rated highly by small teams for its simplicity and low overhead costs.

What is the best Application Performance Monitoring (APM) Software for startups?

Startups need APM tools that are quick to set up, developer-friendly, and scalable without heavy upfront investment. G2's APM software listings for small businesses can help narrow options. Here are tools that startups consistently rate highly:

  • Sentry - is a go-to for startups due to its developer-first design, fast integration, and strong free plan that covers error monitoring from day one.
  • Dash0 - is a modern observability platform built for cloud-native teams, offering OpenTelemetry-native instrumentation that startups with microservices architectures find easy to adopt.
  • Last9 - is a reliability platform designed for high-cardinality metrics and SLO management, well-suited for startups that need scalable monitoring without the cost of enterprise tools.
  • Middleware - is a unified observability platform offering logs, metrics, and traces in a single interface, making it practical for small engineering teams with limited tooling bandwidth.

Which Application Performance Monitoring (APM) Software is the most user-friendly for startups?

Ease of use is a critical factor for startup teams without dedicated DevOps or SRE staff. Based on G2 ease-of-use ratings from small business reviewers, the following tools lead the field:

  • CubeAPM - earns top ease-of-use scores among SMB reviewers, praised for its clean interface and straightforward setup process that gets teams monitoring quickly.
  • Better Stack - is consistently praised for its modern, intuitive interface that reduces the learning curve for teams new to structured monitoring and alerting.
  • Sentry - balances feature depth with a well-organized UI, and its SDKs are among the fastest to integrate across major languages and frameworks.
  • Middleware - consolidates observability into a single interface that startup teams find approachable, even without prior experience with distributed tracing or log aggregation.

Which APM tools are best for teams switching from legacy monitoring solutions?

Many SMBs migrating from older tools look for APM platforms that offer guided onboarding and strong support during the transition. Here are tools SMB reviewers recommend when switching:

  • Site24x7 - is a smooth transition option for teams coming from legacy network monitors, offering breadth of coverage and strong onboarding documentation.
  • Datadog - offers extensive migration support and integrations that help SMBs consolidate disparate monitoring tools into a single platform.
  • New Relic - has a strong guided setup experience and an active community that helps teams migrating from tools like Splunk or AppDynamics get productive quickly.

What are the best APM tools for SMBs in financial services?

Financial services SMBs require APM tools that meet compliance expectations, support audit-ready logging, and provide high reliability monitoring for customer-facing applications:

  • Sumo Logic - is well-suited for financial services teams that need centralized log analytics and security monitoring with compliance reporting capabilities.
  • Coralogix - provides data archiving, alerting, and compliance-friendly data management features that financial services organizations find valuable.
  • Datadog - offers robust audit logging and HIPAA/SOC 2 compliance options that financial and regulated-industry SMBs rely on for governance and security visibility.

Enterprise FAQs

What are the best-rated Application Performance Monitoring (APM) Software for tech enterprises?

Technology enterprises prioritize APM tools that handle high scale, support complex distributed systems, and integrate across large toolchains. Based on G2 enterprise reviewer ratings, see the APM enterprise software listings on G2 for full details. Top performers include:

  • Datadog - is a top enterprise choice for its breadth of integrations, scalable telemetry ingestion, and AI-assisted alerting across large engineering organizations.
  • New Relic - is widely deployed at enterprise scale for full-stack observability, offering distributed tracing, synthetic monitoring, and entity relationship mapping.
  • Dynatrace - is a leader in AI-driven observability for enterprise environments, using automated topology discovery and Davis AI to reduce mean time to resolution.
  • IBM Instana - is an enterprise-grade APM tool that provides automatic instrumentation and continuous monitoring with a focus on reducing manual configuration overhead.

What are the most reliable Application Performance Monitoring tools for enterprises?

Enterprise reliability expectations are high, teams need tools with proven uptime, consistent alerting, and robust SLA tracking. These platforms earn top marks from enterprise reviewers for dependability:

  • Paessler PRTG - is a long-established network and infrastructure monitoring platform that enterprise IT teams trust for stable, continuous monitoring of complex environments.
  • LogicMonitor - is a cloud-based infrastructure monitoring platform with strong enterprise SLA management and automated discovery that reduces monitoring gaps at scale.
  • Dynatrace - is consistently rated highly by enterprise reviewers for its automated anomaly detection and root cause analysis that keeps large-scale production systems reliable.
  • ServiceNow IT Operations Management - integrates AIOps and event correlation with ITSM workflows, making it a reliable choice for enterprises that need monitoring and incident management in a unified platform.

What are the best-reviewed Application Performance Monitoring tools for enterprise app integration?

Enterprise APM tools that integrate cleanly with existing ITSM, CI/CD, and cloud platforms reduce friction and accelerate incident resolution. These tools receive strong reviews specifically for their integration capabilities:

  • Datadog - supports over 700 integrations spanning cloud providers, databases, containers, and collaboration tools, making it a hub for enterprise observability pipelines.
  • New Relic - offers deep integrations with popular DevOps tools including Jira, PagerDuty, Slack, and AWS, supporting end-to-end enterprise incident workflows.
  • Sumo Logic - integrates observability with security monitoring and supports enterprise data connectors for complex, multi-cloud application environments.
  • ServiceNow IT Operations Management - natively connects APM event data with ITSM workflows, enabling enterprises to route, escalate, and resolve incidents through existing ServiceNow processes.

Which APM tools are most recommended for enterprises managing hybrid cloud environments?

Enterprises operating across on-premise and cloud infrastructure need APM platforms capable of unified visibility without siloed data. These tools are highly recommended for hybrid deployments:

  • IBM Instana - supports hybrid and multi-cloud environments with automatic instrumentation that covers both containerized and traditional on-premise workloads.
  • NETSCOUT - is a network performance management solution designed for enterprises with complex hybrid environments that require deep packet-level visibility.
  • ManageEngine OpManager - is a hybrid IT infrastructure monitoring platform that covers networks, servers, virtual machines, and cloud resources from a centralized console.
  • Paessler PRTG - is a proven choice for hybrid monitoring, offering sensor-based architecture that flexibly monitors on-premise hardware and cloud services side by side.

What APM platforms are best for enterprises in regulated industries such as finance and healthcare?

Enterprises in regulated industries require APM platforms with strong data governance, compliance certifications, and audit trail capabilities. These platforms are consistently recognized in those contexts:

  • Sumo Logic - offers built-in security monitoring, compliance reporting, and role-based access controls that regulated enterprises rely on for both observability and audit readiness.
  • Datadog - holds SOC 2 Type II, HIPAA, PCI DSS, and FedRAMP certifications, making it a qualified APM choice for healthcare and financial services enterprises.
  • IBM Instana - benefits from IBM's enterprise compliance framework, providing regulated industries with the data residency controls and security standards they require.

Last updated on April 24, 2026