# Best Enterprise Monitoring Software

## How Many Enterprise Monitoring Software Products Does G2 Track?

**Total Products under this Category:** 74

### Category Stats (Aug 2026)

- **Average Rating:** 4.49/5 (↑0.01 vs Jul 2026) The average rating of products in this category, based on all submitted ratings
- **Top Trending Product:** Motadata ObserveOps (+1.35%) - Among all products in this category, Motadata ObserveOps recorded the largest rating increase compared to last month

_Last updated: August 04, 2026_

## How Does G2 Rank Enterprise Monitoring Software Products?

**Why You Can Trust G2's Software Rankings:**

- 30 Analysts and Data Experts
- 8,700+ Authentic Reviews
- 74+ Products
- Unbiased Rankings

G2's software rankings are built on verified user reviews, rigorous moderation, and a consistent research methodology maintained by a team of analysts and data experts. Each product is measured using the same transparent criteria, with no paid placement or vendor influence. While reviews reflect real user experiences, which can be subjective, they offer valuable insight into how software performs in the hands of professionals. Together, these inputs power the G2 Score, a standardized way to compare tools within every category.

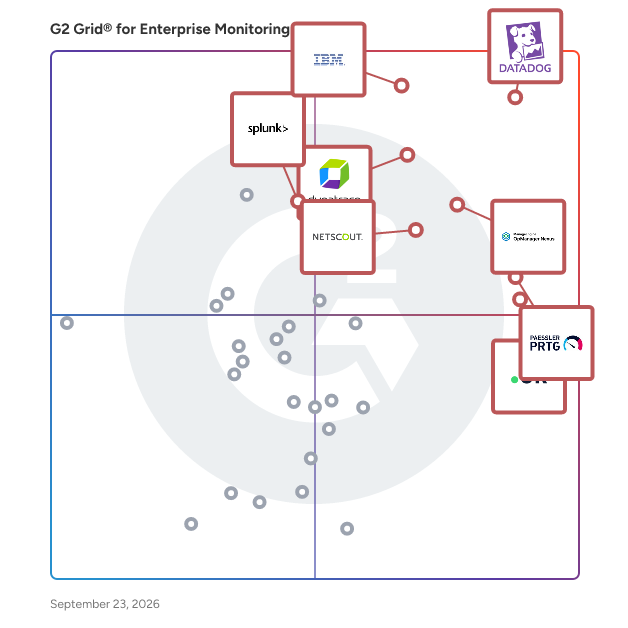
## G2 Grid® for Enterprise Monitoring Software
 ![G2 Grid® for Enterprise Monitoring Software plotting products by satisfaction and market presence](https://www.g2.com/categories/enterprise-monitoring/grids.png?focus%5B%5D=3824&focus%5B%5D=27540&focus%5B%5D=10874&focus%5B%5D=2056&focus%5B%5D=17351&focus%5B%5D=5346&focus%5B%5D=75171&focus%5B%5D=2965)

Highlighted products: Datadog, IBM Instana, Paessler PRTG, Dynatrace, OpManager Nexus, UptimeRobot, NETSCOUT Network & Application Observability, and Splunk Enterprise.

Underlying data: [Grid® JSON](https://www.g2.com/categories/enterprise-monitoring/grids.json?focus%5B%5D=datadog&focus%5B%5D=ibm-instana&focus%5B%5D=paessler-prtg&focus%5B%5D=dynatrace&focus%5B%5D=opmanager-nexus&focus%5B%5D=uptimerobot&focus%5B%5D=netscout-network-application-observability&focus%5B%5D=splunk-enterprise)

**Sponsored**

### Paessler PRTG

Your infrastructure is complex. Your monitoring tool shouldn't be. Paessler PRTG delivers mission-critical visibility across IT and OT environments, deploying in minutes, not months. Whether you're managing servers, switches, virtual machines, cloud services, or industrial systems, PRTG monitors everything from a single platform, so your team always knows what's running, what's struggling, and what needs attention, before users do. Fast to deploy. Easy to run. Auto-discovery finds devices on your network automatically, and 300+ pre-configured sensors cover the most common infrastructure components out of the box. Support for all major protocols (SNMP, WMI, REST APIs, SSH, NetFlow, and more) means PRTG fits into your existing environment without forcing changes to it. Built for lean teams under real pressure. Customizable dashboards give instant visibility across your entire landscape. Flexible alerting (via email, SMS, push notification, or third-party integrations) ensures the right people are notified the moment something goes wrong. Historical trend data helps you spot patterns and plan ahead, not just react. Scales on your terms. From a single site to distributed multi-location environments, PRTG grows with your organization. Available as an on-premises installation or a hosted solution, it adapts to your infrastructure and your IT policies, no rip-and-replace required. Trusted by more than 500,000 users across 190+ countries since 1997, Paessler PRTG is the monitoring standard for IT professionals who need results, not complexity.

[Visit website](https://www.g2.com/external_clickthroughs/record?secure%5Bad_program%5D=ppc&secure%5Bad_slot%5D=category_product_list_llm&secure%5Bcategory_id%5D=2126&secure%5Bchosen_at%5D=2026-08-05T23%3A32%3A25Z&secure%5Bdisplayable_resource_id%5D=2126&secure%5Bdisplayable_resource_type%5D=Category&secure%5Bmedium%5D=sponsored&secure%5Bplacement_reason%5D=page_category&secure%5Bplacement_resource_ids%5D%5B%5D=2126&secure%5Bprioritized%5D=false&secure%5Bproduct_id%5D=10874&secure%5Bresource_id%5D=2126&secure%5Bresource_type%5D=Category&secure%5Bsource_type%5D=category_page&secure%5Bsource_url%5D=https%3A%2F%2Fwww.g2.com%2Fcategories%2Fenterprise-monitoring&secure%5Btoken%5D=21e438e48a2b4a323c95d6a42c0b56c2a953ccc120bf64db0facb6dc7e925e8a&secure%5Burl%5D=https%3A%2F%2Fwww.paessler.com%2Fprtg%2Fprtg-enterprise-monitor%3Futm_medium%3Daffiliate%26utm_source%3Dg2%26utm_campaign%3Dg2-ppc_enterprise-monitoring&secure%5Burl_type%5D=custom_url)

### [Datadog](https://www.g2.com/products/datadog/reviews)

Datadog is the monitoring, security and analytics platform for developers, IT operations teams, security engineers and business users in the cloud age. The SaaS platform integrates and automates infrastructure monitoring, application performance monitoring and log management to provide unified, real-time observability of our customers' entire technology stack. Datadog is used by organizations of all sizes and across a wide range of industries to enable digital transformation and cloud migration, drive collaboration among development, operations, security and business teams, accelerate time to market for applications, reduce time to problem resolution, secure applications and infrastructure, understand user behavior and track key business metrics.

**Average Rating:** 4.4/5.0

**Total Reviews:** 715

#### How Do G2 Users Rate Datadog?

- **Has the product been a good partner in doing business?:** 8.5/10 (Category avg: 8.8/10)
- **Dashboards and Visualization:** 8.7/10 (Category avg: 8.7/10)
- **Observability:** 9.2/10 (Category avg: 9.0/10)
- **Single Pane of Glass:** 8.8/10 (Category avg: 8.8/10)

#### Who Is the Company Behind Datadog?

- **Seller:** [Datadog](https://www.g2.com/sellers/datadog)
- **Company Website:** www.datadoghq.com
- **Year Founded:** 2010
- **HQ Location:** New York
- **Twitter:** @datadoghq  
51,207 Twitter followers
- **LinkedIn® Page:** [www.linkedin.com](https://www.g2.com/external_clickthroughs/record?secure%5Bsource_type%5D=product_profile&secure%5Btoken%5D=1b0942496e12618acadaab3a1601417c9f0d1941be094e2cefb0d89c606e73b5&secure%5Burl%5D=https%3A%2F%2Fwww.linkedin.com%2Fcompany%2F1066442%2F&secure%5Burl_type%5D=linkedin_company_website)  
9,386 employees on LinkedIn®

#### Who Uses This Product?

- **Who Uses This:** Software Engineer, DevOps Engineer
- **Top Industries:** Information Technology and Services, Computer Software
- **Company Size:** 47% Medium, 34% Large

#### What Do G2 Reviewers Say About Datadog?

_AI-generated summary from verified user reviews_

##### Pros

- Users value the **ease of use** of Datadog, appreciating intuitive dashboards and seamless integrations for monitoring.
- Users value the **user-friendly monitoring features** of Datadog, appreciating its intuitive dashboards and quick integrations.
- Users value the **real-time monitoring** capabilities of Datadog, enhancing their operational awareness and response times.
- Users appreciate the **user-friendly interface** and **robust features** of Datadog for seamless monitoring and integration.
- Users value the **intuitive dashboard creation** in Datadog, making monitoring easy and effective across various environments.

##### Cons

- Users feel that Datadog's pricing is **expensive** , suggesting it should be more affordable for better access.
- Users find the **learning curve steep** , with many features overwhelming and requiring a higher level of experience.
- Users find the **pricing issues** of Datadog concerning, citing high costs that escalate unpredictably with added features.
- Users feel the **cost is too high** , especially as expenses can scale unpredictably with additional features and logs.
- Users report a **steep learning curve** with Datadog, finding setup and usage challenging for newcomers.

#### What Are Recent G2 Reviews of Datadog?

**["Faster incident detection and root-cause analysis, leading to better customer experience."](https://www.g2.com/survey_responses/datadog-review-12850013)**

**Rating:** 4.5/5.0 stars

_— Bertrand P._

[Read full review](https://www.g2.com/survey_responses/datadog-review-12850013)

**["Datadog: Unified Logs, Metrics & Traces for Real-Time Visibility and Faster Debugging"](https://www.g2.com/survey_responses/datadog-review-13049319)**

**Rating:** 4.5/5.0 stars

_— Anshul S._

[Read full review](https://www.g2.com/survey_responses/datadog-review-13049319)

#### What Are G2 Users Discussing About Datadog?

- [How good is Datadog?](https://www.g2.com/discussions/how-good-is-datadog)
- [Does Datadog use AWS?](https://www.g2.com/discussions/does-datadog-use-aws) - 2 comments
- [What can Datadog monitor?](https://www.g2.com/discussions/what-can-datadog-monitor)
- [What is the use of Datadog?](https://www.g2.com/discussions/what-is-the-use-of-datadog) - 3 comments

### [IBM Instana](https://www.g2.com/products/ibm-instana/reviews)

IBM Instana, now part of the Concert platform, discovers and maps all services, infrastructure, and their inter-dependencies automatically. Instana ingests all observability metrics, traces each request, profiles every process, and updates application dependency maps in real-time to deliver the context and actionable feedback needed by DevOps to optimize application performance, enable innovation and mitigate risk to help them add value and efficiency to the pipeline. IBM Instana is available on AWS Marketplace.

**Average Rating:** 4.4/5.0

**Total Reviews:** 469

#### How Do G2 Users Rate IBM Instana?

- **Has the product been a good partner in doing business?:** 8.5/10 (Category avg: 8.8/10)
- **Dashboards and Visualization:** 10.0/10 (Category avg: 8.7/10)
- **Observability:** 10.0/10 (Category avg: 9.0/10)
- **Single Pane of Glass:** 10.0/10 (Category avg: 8.8/10)

#### Who Is the Company Behind IBM Instana?

- **Seller:** [IBM](https://www.g2.com/sellers/ibm)
- **Company Website:** www.ibm.com
- **Year Founded:** 1911
- **HQ Location:** Armonk, New York, United States
- **Twitter:** @IBMSecurity  
74,660 Twitter followers
- **LinkedIn® Page:** [www.linkedin.com](https://www.g2.com/external_clickthroughs/record?secure%5Bsource_type%5D=product_profile&secure%5Btoken%5D=14b544adaece4fdbc987f1d7f7028048c22259946811200cc751263825586af9&secure%5Burl%5D=https%3A%2F%2Fwww.linkedin.com%2Fcompany%2F1009%2F&secure%5Burl_type%5D=linkedin_company_website)  
328,202 employees on LinkedIn®

#### Who Uses This Product?

- **Who Uses This:** Software Engineer, System Engineer
- **Top Industries:** Information Technology and Services, Computer Software
- **Company Size:** 41% Medium, 36% Large

#### What Do G2 Reviewers Say About IBM Instana?

_AI-generated summary from verified user reviews_

##### Pros

- Users find IBM Instana's **ease of use** remarkable, simplifying complex application monitoring and providing excellent support.
- Users value the **effortless monitoring** with IBM Instana, relishing real-time visibility and automatic service mapping.
- Users appreciate the **real-time monitoring** capabilities of IBM Instana, making root cause analysis effortless and efficient.
- Users appreciate the **effortless monitoring capabilities** of IBM Instana, enhancing visibility and simplifying application management.
- Users find the **easy setup** of IBM Instana allows effortless monitoring and quick real-time insights without manual configurations.

##### Cons

- Users find the pricing of IBM Instana to be **expensive** , especially as their infrastructure scales.
- Users encounter **busy UI issues** that complicate data analysis and require time to acclimate fully.
- Users find the **learning curve steep** , making setup and customization more challenging than with other monitoring tools.
- Users find the **difficult learning curve** of IBM Instana challenging, especially for new users navigating the interface.
- Users note the **expensive pricing** of IBM Instana, especially as infrastructure scales, which can be a concern.

#### What Are Recent G2 Reviews of IBM Instana?

**["Powerful Analytics and Automation Drive Exceptional Performance"](https://www.g2.com/survey_responses/ibm-instana-review-12064579)**

**Rating:** 4.5/5.0 stars

_— Konjengbam M._

[Read full review](https://www.g2.com/survey_responses/ibm-instana-review-12064579)

**["Comprehensive Monitoring, Steep Learning Curve"](https://www.g2.com/survey_responses/ibm-instana-review-13089173)**

**Rating:** 4.5/5.0 stars

_— Aleksander M._

[Read full review](https://www.g2.com/survey_responses/ibm-instana-review-13089173)

#### What Are G2 Users Discussing About IBM Instana?

- [What is Application Performance Monitoring (APM)?](https://www.g2.com/discussions/what-is-application-performance-monitoring-apm) - 2 comments
- [What is Instana?](https://www.g2.com/discussions/instana-what-is-instana)
- [What is Instana?](https://www.g2.com/discussions/what-is-instana) - 2 comments

### [Paessler PRTG](https://www.g2.com/products/paessler-prtg/reviews)

Your infrastructure is complex. Your monitoring tool shouldn't be. Paessler PRTG delivers mission-critical visibility across IT and OT environments, deploying in minutes, not months. Whether you're managing servers, switches, virtual machines, cloud services, or industrial systems, PRTG monitors everything from a single platform, so your team always knows what's running, what's struggling, and what needs attention, before users do. Fast to deploy. Easy to run. Auto-discovery finds devices on your network automatically, and 300+ pre-configured sensors cover the most common infrastructure components out of the box. Support for all major protocols (SNMP, WMI, REST APIs, SSH, NetFlow, and more) means PRTG fits into your existing environment without forcing changes to it. Built for lean teams under real pressure. Customizable dashboards give instant visibility across your entire landscape. Flexible alerting (via email, SMS, push notification, or third-party integrations) ensures the right people are notified the moment something goes wrong. Historical trend data helps you spot patterns and plan ahead, not just react. Scales on your terms. From a single site to distributed multi-location environments, PRTG grows with your organization. Available as an on-premises installation or a hosted solution, it adapts to your infrastructure and your IT policies, no rip-and-replace required. Trusted by more than 500,000 users across 190+ countries since 1997, Paessler PRTG is the monitoring standard for IT professionals who need results, not complexity.

**Average Rating:** 4.7/5.0

**Total Reviews:** 205

#### How Do G2 Users Rate Paessler PRTG?

- **Has the product been a good partner in doing business?:** 8.9/10 (Category avg: 8.8/10)
- **Dashboards and Visualization:** 9.2/10 (Category avg: 8.7/10)
- **Observability:** 8.9/10 (Category avg: 9.0/10)
- **Single Pane of Glass:** 9.1/10 (Category avg: 8.8/10)

#### Who Is the Company Behind Paessler PRTG?

- **Seller:** [Paessler GmbH](https://www.g2.com/sellers/paessler-gmbh)
- **Company Website:** www.paessler.com
- **Year Founded:** 1997
- **HQ Location:** Nuremberg, Germany
- **LinkedIn® Page:** [www.linkedin.com](https://www.g2.com/external_clickthroughs/record?secure%5Bsource_type%5D=product_profile&secure%5Btoken%5D=b49a4e1e8615ca1dbd0dd7ffd8201d0411e25fc37dac6975a9e785265f4d2f9e&secure%5Burl%5D=https%3A%2F%2Fwww.linkedin.com%2Fcompany%2F409588%2F&secure%5Burl_type%5D=linkedin_company_website)  
403 employees on LinkedIn®

#### Who Uses This Product?

- **Who Uses This:** Software Engineer, Network Administrator
- **Top Industries:** Information Technology and Services, Telecommunications
- **Company Size:** 52% Medium, 36% Large

#### What Do G2 Reviewers Say About Paessler PRTG?

_AI-generated summary from verified user reviews_

##### Pros

- Users find Paessler PRTG's **ease of use** impressive, enjoying customizable dashboards and intuitive reporting features.
- Users praise the **reliable monitoring** capabilities of PRTG, emphasizing its ease of use and flexibility in tracking crucial systems.
- Users commend the **monitoring capabilities** of PRTG, appreciating its reliability and flexibility in tracking critical systems.
- Users value the **real-time alerting system** of PRTG, enabling immediate responses to network disruptions and issues.
- Users praise the **easy setup** of Paessler PRTG, enabling quick monitoring configuration and efficient network management.

##### Cons

- Users find the **high cost** of Paessler PRTG concerning, especially with its sensor-based licensing model and limited training.
- Users experience **slow performance** with large reports and dashboards, impacting efficiency and usability of PRTG.
- Users face **user interface issues** , including a dated design and a challenging learning curve for advanced features.
- Users find the **learning curve steep** for advanced features, making initial configuration overwhelming for new users.
- Users find the **complex setup** of PRTG challenging, requiring extensive experimentation and fine-tuning for optimal performance.

#### What Are Recent G2 Reviews of Paessler PRTG?

**["Auto-Discovery That Actually Works—Deep Hardware Health via SNMP"](https://www.g2.com/survey_responses/paessler-prtg-review-12413075)**

**Rating:** 5.0/5.0 stars

_— peeyusha d._

[Read full review](https://www.g2.com/survey_responses/paessler-prtg-review-12413075)

**["Authentic, Experience-Based Reviews for PRTG Paessler"](https://www.g2.com/survey_responses/paessler-prtg-review-12437064)**

**Rating:** 5.0/5.0 stars

_— Sainath H._

[Read full review](https://www.g2.com/survey_responses/paessler-prtg-review-12437064)

#### What Are G2 Users Discussing About Paessler PRTG?

- [Is anyone else stuck juggling old vs new UI, desktop, and mobile because none of them fully cover daily needs?](https://www.g2.com/discussions/is-anyone-else-stuck-juggling-old-vs-new-ui-desktop-and-mobile-because-none-of-them-fully-cover-daily-needs) - 1 comment
- [Do others struggle with PRTG’s reporting and dashboards being too technical for managers?](https://www.g2.com/discussions/do-others-struggle-with-prtg-s-reporting-and-dashboards-being-too-technical-for-managers) - 1 comment
- [Has anyone else found the learning curve for custom sensors and reports slows real projects?](https://www.g2.com/discussions/has-anyone-else-found-the-learning-curve-for-custom-sensors-and-reports-slows-real-projects) - 1 comment
- [How are you handling PRTG’s sensor‑based licensing before it blows up the budget?](https://www.g2.com/discussions/how-are-you-handling-prtg-s-sensor-based-licensing-before-it-blows-up-the-budget) - 1 comment
- [Heavy storage use and slowdowns with lots of sensors directly cut into my monitoring time](https://www.g2.com/discussions/heavy-storage-use-and-slowdowns-with-lots-of-sensors-directly-cut-into-my-monitoring-time) - 1 comment

### [Dynatrace](https://www.g2.com/products/dynatrace/reviews)

Dynatrace is advancing observability for today’s digital businesses, helping to transform the complexity of modern digital ecosystems into powerful business assets. By leveraging AI-powered insights, Dynatrace enables organizations to analyze, automate, and innovate faster to drive their business forward. Learn more at www.dynatrace.com.

**Average Rating:** 4.5/5.0

**Total Reviews:** 1,234

#### How Do G2 Users Rate Dynatrace?

- **Has the product been a good partner in doing business?:** 8.7/10 (Category avg: 8.8/10)
- **Dashboards and Visualization:** 8.4/10 (Category avg: 8.7/10)
- **Observability:** 9.1/10 (Category avg: 9.0/10)
- **Single Pane of Glass:** 8.3/10 (Category avg: 8.8/10)

#### Who Is the Company Behind Dynatrace?

- **Seller:** [Dynatrace](https://www.g2.com/sellers/dynatrace)
- **Year Founded:** 2005
- **HQ Location:** Boston, MA
- **Twitter:** @Dynatrace  
18,668 Twitter followers
- **LinkedIn® Page:** [www.linkedin.com](https://www.g2.com/external_clickthroughs/record?secure%5Bsource_type%5D=product_profile&secure%5Btoken%5D=83c43c7495079d745f57a9f8c381cbe86f78689894d05ac3e6cb0ba76b16494d&secure%5Burl%5D=https%3A%2F%2Fwww.linkedin.com%2Fcompany%2F125999%2F&secure%5Burl_type%5D=linkedin_company_website)  
6,060 employees on LinkedIn®
- **Ownership:** NYSE: DT

#### Who Uses This Product?

- **Who Uses This:** Software Engineer, Senior Software Engineer
- **Top Industries:** Information Technology and Services, Financial Services
- **Company Size:** 69% Large, 23% Medium

#### What Do G2 Reviewers Say About Dynatrace?

_AI-generated summary from verified user reviews_

##### Pros

- Users praise the **ease of use** of Dynatrace, highlighting its intuitive navigation and quick installation process.
- Users value the **real-time break point feature** for debugging code in production, enhancing their development process.
- Users commend the **quick information gathering** of Dynatrace, enhancing bug detection and overall debugging efficiency.
- Users value the **comprehensive data gathering** capabilities of Dynatrace, enabling efficient bug detection without production interruptions.
- Users find **monitoring** capabilities invaluable for quick insights and timely alerts on system issues, enhancing reliability.

##### Cons

- Users find the **learning curve steep** , with challenges in instrumentation and understanding the system effectively.
- Users are frustrated with **missing features** in Dynatrace, impacting data extraction and overall usability.
- Users find the **complexity of instrumentation** with Dynatrace can hinder effective problem investigation and ease of use.
- Users feel the **UI could be less cluttered** , making navigation and log viewing cumbersome for newcomers.
- Users find the **steep learning curve** of Dynatrace challenging, making it difficult to fully utilize its features.

#### What Are Recent G2 Reviews of Dynatrace?

**["Comprehensive Observability, Excellent AI, but Complex Pricing"](https://www.g2.com/survey_responses/dynatrace-review-13111992)**

**Rating:** 4.0/5.0 stars

_— Vishnu Vardhan N._

[Read full review](https://www.g2.com/survey_responses/dynatrace-review-13111992)

**["Davis AI Delivers Clear Root-Cause Insights and Real-Time User Monitoring"](https://www.g2.com/survey_responses/dynatrace-review-12645823)**

**Rating:** 4.5/5.0 stars

_— Sabina K._

[Read full review](https://www.g2.com/survey_responses/dynatrace-review-12645823)

#### What Are G2 Users Discussing About Dynatrace?

- [What is Dynatrace used for?](https://www.g2.com/discussions/what-is-dynatrace-used-for) - 3 comments
- [How do you use Rookout?](https://www.g2.com/discussions/how-do-you-use-rookout)
- [What is the use of Rookout?](https://www.g2.com/discussions/what-is-the-use-of-rookout)
- [What is offline debugging?](https://www.g2.com/discussions/what-is-offline-debugging)
- [What does Rookout do?](https://www.g2.com/discussions/what-does-rookout-do) - 2 comments

### [OpManager Nexus](https://www.g2.com/products/opmanager-nexus/reviews)

OpManager Nexus is a full-stack observability platform that helps IT teams monitor and manage their entire infrastructure, including networks, servers, applications, databases, and websites, from a single console. Designed for mid-size to large organizations managing hybrid and on-premises environments, OpManager Nexus provides deep visibility across every layer of the IT stack. IT teams gain a consolidated view of their infrastructure, eliminating the need for multiple disconnected monitoring tools and reducing the operational overhead that comes with managing them. This unified approach enables faster decision-making and helps organizations maintain service reliability across complex, distributed environments where downtime can have a direct impact on business continuity. OpManager Nexus includes AIOps capabilities that go beyond traditional monitoring. Agentic AI and generative AI integrations automate routine diagnostics and accelerate issue resolution, while smart event correlation identifies relationships between alerts across the stack. Together, these capabilities help IT teams detect issues early, cut through alert noise, and resolve problems before they impact end users or broader business operations. For IT teams dealing with high volumes of events across large environments, this level of automation significantly reduces the time spent on manual troubleshooting. On the deployment front, OpManager Nexus supports both on-premises installation and cloud access (powered by Site24x7) through ManageEngine's private datacenters. Organizations can choose the model that aligns with their infrastructure strategy, security policies, and compliance requirements, without compromising on monitoring depth or platform capability. As part of the ManageEngine ecosystem, OpManager Nexus integrates natively with ITSM, analytics, and security tools, giving IT teams the full operational context needed to manage infrastructure performance and respond to incidents end to end.

**Average Rating:** 4.6/5.0

**Total Reviews:** 223

#### How Do G2 Users Rate OpManager Nexus?

- **Has the product been a good partner in doing business?:** 9.0/10 (Category avg: 8.8/10)
- **Dashboards and Visualization:** 9.2/10 (Category avg: 8.7/10)
- **Observability:** 9.0/10 (Category avg: 9.0/10)
- **Single Pane of Glass:** 8.9/10 (Category avg: 8.8/10)

#### Who Is the Company Behind OpManager Nexus?

- **Seller:** [Zoho](https://www.g2.com/sellers/zoho-b00ca9d5-bca8-41b5-a8ad-275480841704)
- **Company Website:** www.zoho.com
- **Year Founded:** 1996
- **HQ Location:** Austin, TX
- **Twitter:** @Zoho  
137,880 Twitter followers
- **LinkedIn® Page:** [www.linkedin.com](https://www.g2.com/external_clickthroughs/record?secure%5Bsource_type%5D=product_profile&secure%5Btoken%5D=9c8e45ddb296c32c6c5597ef9ba945c94562c57624f7bd1dcf1a9e9931f71578&secure%5Burl%5D=https%3A%2F%2Fwww.linkedin.com%2Fcompany%2F38373%2F&secure%5Burl_type%5D=linkedin_company_website)  
30,766 employees on LinkedIn®

#### Who Uses This Product?

- **Who Uses This:** IT Manager, Network Administrator
- **Top Industries:** Information Technology and Services, Financial Services
- **Company Size:** 54% Medium, 32% Large

#### What Do G2 Reviewers Say About OpManager Nexus?

_AI-generated summary from verified user reviews_

##### Pros

- Users value the **monitoring capabilities** of OpManager Nexus, praising its ease of use and effective real-time alerting.
- Users value the **real-time monitoring** of OpManager Nexus, enhancing issue resolution and maintaining system efficiency.
- Users appreciate the **ease of use** of OpManager Nexus, which simplifies monitoring and management of critical systems.
- Users value the **intuitive user interface** of OpManager Nexus, enhancing their monitoring experience with easy navigation and alerts.
- Users value the **comprehensive monitoring** capabilities of OpManager Nexus for enhanced server and network management.

##### Cons

- Users find that the **complexity of setup** for OpManager Nexus can lead to difficulties in management and notifications.
- Users find the **complex configuration** of OpManager challenging, especially during initial setup and management of alerts.
- Users find the **complex setup** of OpManager Nexus challenging, especially during the initial onboarding process.
- Users note **missing features** in OpManager Nexus, with some advanced options locked behind higher editions, limiting functionality.
- Users find the **difficult configuration** of OpManager challenging, often leading to excessive alerts without proper adjustments.

#### What Are Recent G2 Reviews of OpManager Nexus?

**["Clear Dashboards and Proactive Alerts for Full Infrastructure Visibility"](https://www.g2.com/survey_responses/opmanager-nexus-review-13121842)**

**Rating:** 4.5/5.0 stars

_— Tarun A._

[Read full review](https://www.g2.com/survey_responses/opmanager-nexus-review-13121842)

**["Centralized NOC Dashboards and Real-Time Monitoring Made Simple"](https://www.g2.com/survey_responses/opmanager-nexus-review-13134137)**

**Rating:** 5.0/5.0 stars

_— Francesco T._

[Read full review](https://www.g2.com/survey_responses/opmanager-nexus-review-13134137)

#### What Are G2 Users Discussing About OpManager Nexus?

- [What is ManageEngine OpManager used for?](https://www.g2.com/discussions/what-is-manageengine-opmanager-used-for)
- [How do I upgrade ManageEngine OpManager?](https://www.g2.com/discussions/how-do-i-upgrade-manageengine-opmanager) - 1 comment, 3 upvotes
- [What is ManageEngine software?](https://www.g2.com/discussions/manageengine-opmanager-what-is-manageengine-software) - 1 comment
- [How do you use OpManager tools?](https://www.g2.com/discussions/how-do-you-use-opmanager-tools) - 1 comment
- [What is the use of OpManager?](https://www.g2.com/discussions/what-is-the-use-of-opmanager)

### [UptimeRobot](https://www.g2.com/es/products/uptimerobot/reviews)

El servicio gratuito de monitoreo de tiempo de actividad en línea con una aplicación disponible para iOS y Android (https://uptimerobot.com). Con el Plan Gratuito, puedes monitorear hasta 50 URLs, verificar el contenido de un sitio web (usando el monitor de palabras clave), hacer ping a tu servidor o monitorear tus puertos en intervalos de 5 minutos. Puedes crear una página de estado para mostrar tu tiempo de actividad. Las alertas por SMS o llamada se pueden comprar en cualquier momento. Recibe notificaciones por correo electrónico, llamada telefónica, SMS o integraciones como Microsoft Teams, Telegram, Slack, Twitter, Zapier, Pagerduty, Splunk On-Call, Pushbullet, Webhooks, Google Chat o Pushover. Con el Plan Pro, puedes monitorear certificados SSL o usar el monitor Heartbeat para vigilar tus trabajos cron. Ajusta y gestiona tu monitoreo con ventanas de mantenimiento o notificaciones avanzadas, para evitar recibir alertas durante el mantenimiento, o para recibir notificaciones después de un cierto tiempo de inactividad.

**Average Rating:** 4.7/5.0

**Total Reviews:** 299

#### How Do G2 Users Rate UptimeRobot?

- **¿Ha sido the product un buen socio para hacer negocios?:** 9.4/10 (Category avg: 8.8/10)
- **Paneles y visualización:** 5.0/10 (Category avg: 8.7/10)
- **Panel único de vidrio:** 10.0/10 (Category avg: 8.8/10)

#### Who Is the Company Behind UptimeRobot?

- **Vendedor:** [Uptime Robot](https://www.g2.com/es/sellers/uptime-robot)
- **Año de fundación:** 2010
- **Ubicación de la sede:** Sliema, Malta
- **Twitter:** @uptimerobot  
17,426 seguidores en Twitter
- **Página de LinkedIn®:** [www.linkedin.com](https://www.g2.com/es/external_clickthroughs/record?secure%5Bsource_type%5D=product_profile&secure%5Btoken%5D=4cecfc716b2cfdc092477b5c1bff8265af7acba6ee506bd69b58fc89279313b4&secure%5Burl%5D=https%3A%2F%2Fwww.linkedin.com%2Fcompany%2F9396064%2F&secure%5Burl_type%5D=linkedin_company_website)  
17 empleados en LinkedIn®

#### Who Uses This Product?

- **Who Uses This:** Director Ejecutivo, Director de Tecnología
- **Top Industries:** Tecnología de la información y servicios, Software de Computadora
- **Company Size:** 71% Small, 19% Medium

#### What Do G2 Reviewers Say About UptimeRobot?

_AI-generated summary from verified user reviews_

##### Pros

- A los usuarios les encantan las **notificaciones inmediatas** de UptimeRobot, lo que permite una gestión proactiva de problemas y mejora el servicio al cliente en general.
- Los usuarios encuentran el proceso de **configuración fácil** de UptimeRobot eficiente, permitiendo un monitoreo rápido sin complejidades.
- Los usuarios valoran el **monitoreo rápido y las notificaciones** de UptimeRobot, asegurándose de mantenerse informados sobre los cambios en el estado del sitio web.
- Los usuarios encuentran la interfaz de UptimeRobot **fácil de usar** , lo que permite una configuración rápida y un monitoreo eficiente con notificaciones oportunas.
- Los usuarios elogian a UptimeRobot por su **fiabilidad** , asegurando que las aplicaciones permanezcan en línea y los problemas se aborden rápidamente.

##### Cons

- Los usuarios están frustrados por **notificaciones inadecuadas** , recibiendo múltiples correos electrónicos y experimentando alertas perdidas durante el tiempo de inactividad.
- Los usuarios encuentran las **limitaciones del plan gratuito** de UptimeRobot restrictivas, ya que carecen de características como intervalos de monitoreo más cortos y datos más detallados.
- Los usuarios encuentran el precio **caro** y la falta de alertas personalizables frustrante, especialmente para notificaciones externas.
- Los usuarios encuentran la **mala interfaz de usuario** de UptimeRobot frustrante, lo que lleva a confusión y dificulta la experiencia general del usuario.
- Los usuarios encuentran que las **capacidades de monitoreo limitadas** de UptimeRobot son inadecuadas para parámetros internos y necesidades complejas.

#### What Are Recent G2 Reviews of UptimeRobot?

**["Monitoreo de tiempo de actividad simple y confiable que simplemente funciona"](https://www.g2.com/es/survey_responses/uptimerobot-review-12671436)**

**Rating:** 4.0/5.0 stars

_— Javier C._

[Read full review](https://www.g2.com/es/survey_responses/uptimerobot-review-12671436)

**["Monitoreo simple y confiable con alertas instantáneas: un esencial diario"](https://www.g2.com/es/survey_responses/uptimerobot-review-12541129)**

**Rating:** 5.0/5.0 stars

_— maha n._

[Read full review](https://www.g2.com/es/survey_responses/uptimerobot-review-12541129)

#### What Are G2 Users Discussing About UptimeRobot?

- [What are the benefits and drawbacks of using UptimeRobot for website uptime monitoring?](https://www.g2.com/es/discussions/what-are-the-benefits-and-drawbacks-of-using-uptimerobot-for-website-uptime-monitoring) - 1 comment
- [¿Dónde se encuentra UptimeRobot?](https://www.g2.com/es/discussions/where-is-uptimerobot-located) - 1 comment
- [Is UptimeRobot down?](https://www.g2.com/es/discussions/is-uptimerobot-down)
- [How do I cancel UptimeRobot?](https://www.g2.com/es/discussions/how-do-i-cancel-uptimerobot) - 1 upvote
- [How do I use UptimeRobot?](https://www.g2.com/es/discussions/how-do-i-use-uptimerobot)

### [NETSCOUT Network & Application Observability](https://www.g2.com/products/netscout-network-application-observability/reviews)

NETSCOUT’s Network & Application Observability solution is engineered for IT practitioners who need deep, real-time visibility into complex hybrid environments. Whether you're managing a sprawling data center, a multi-cloud deployment, 5G deployment, or a remote workforce, this solution delivers the actionable intelligence required to maintain performance, availability, and user experience across every layer of your infrastructure. At its core, NETSCOUT leverages Deep Packet Inspection (DPI) to convert raw network traffic into smart data. This allows IT teams to monitor application behavior, network performance, and service dependencies with precision, even in containerized environments. The result is a unified, end-to-end view that helps you quickly isolate root causes, reduce mean time to knowledge (MTTK), and proactively resolve issues before they impact users or business operations. What sets NETSCOUT apart is its ability to scale observability across both legacy and modern architectures without requiring intrusive agents or instrumentation. It integrates seamlessly with existing workflows and tools, providing consistent visibility whether you're troubleshooting a VoIP degradation, tracking down a cloud latency spike, or validating the performance of a new application rollout. For IT professionals tasked with ensuring uptime and optimizing digital experiences, NETSCOUT’s observability platform is not just a monitoring tool—it’s a strategic asset that transforms packet-level data into operational intelligence. Products included in this solution: - nGeniusONE - InfiniStreamNG - vSTREAM - Packet Flow Switches (PFS) and TAPs

**Average Rating:** 4.5/5.0

**Total Reviews:** 88

#### How Do G2 Users Rate NETSCOUT Network & Application Observability?

- **Has the product been a good partner in doing business?:** 7.0/10 (Category avg: 8.8/10)
- **Dashboards and Visualization:** 7.0/10 (Category avg: 8.7/10)
- **Observability:** 9.0/10 (Category avg: 9.0/10)
- **Single Pane of Glass:** 8.6/10 (Category avg: 8.8/10)

#### Who Is the Company Behind NETSCOUT Network & Application Observability?

- **Seller:** [NETSCOUT](https://www.g2.com/sellers/netscout)
- **Company Website:** www.netscout.com
- **Year Founded:** 1984
- **HQ Location:** Westford, Mass.
- **Twitter:** @NETSCOUT  
13,759 Twitter followers
- **LinkedIn® Page:** [www.linkedin.com](https://www.g2.com/external_clickthroughs/record?secure%5Bsource_type%5D=product_profile&secure%5Btoken%5D=0539fd13e4b3252ce5ce69ecb5c1ed6ce9b59b6b9d04438c62f4642859b4e48e&secure%5Burl%5D=https%3A%2F%2Fwww.linkedin.com%2Fcompany%2Fnetscout%2F&secure%5Burl_type%5D=linkedin_company_website)  
2,692 employees on LinkedIn®

#### Who Uses This Product?

- **Top Industries:** Telecommunications, Financial Services
- **Company Size:** 38% Large, 30% Medium

#### What Do G2 Reviewers Say About NETSCOUT Network & Application Observability?

_AI-generated summary from verified user reviews_

##### Pros

- Users value the **comprehensive visibility** NETSCOUT provides, enabling swift issue resolution and enhanced performance monitoring.
- Users value the **efficient issue detection** of NETSCOUT, allowing quick resolution of network and application problems.
- Users value the **comprehensive visibility** NETSCOUT provides, enhancing network and application performance monitoring effectively.
- Users value the **reliability** of NETSCOUT for proactive troubleshooting and comprehensive insights into network performance.
- Users value the **ease of use** of NETSCOUT Network & Application Observability, appreciating its straightforward setup and configuration.

##### Cons

- Users find the **steep learning curve** challenging, requiring specialized knowledge and complicating implementation and integration.
- Users find the **complexity of implementation** challenging due to the steep learning curve and resource intensity.
- Users find the **difficult learning curve** due to complex setup and interface, impacting initial usage and efficiency.
- Users find the **complex setup** challenging, requiring extensive specialized knowledge and making initial implementation difficult.
- Users often find the **complex configuration** of NETSCOUT challenging, particularly for teams lacking deep network expertise.

#### What Are Recent G2 Reviews of NETSCOUT Network & Application Observability?

**["Essential for Real-Time Network Monitoring"](https://www.g2.com/survey_responses/netscout-network-application-observability-review-13077478)**

**Rating:** 5.0/5.0 stars

_— Hariom K._

[Read full review](https://www.g2.com/survey_responses/netscout-network-application-observability-review-13077478)

**["Powerful Network Visibility, Steep Learning Curve"](https://www.g2.com/survey_responses/netscout-network-application-observability-review-13069041)**

**Rating:** 4.0/5.0 stars

_— Ashwathanarayana H._

[Read full review](https://www.g2.com/survey_responses/netscout-network-application-observability-review-13069041)

### [Splunk Enterprise](https://www.g2.com/products/splunk-enterprise/reviews)

Find out what is happening in your business and take meaningful action quickly with Splunk Enterprise. Automate the collection, indexing and alerting of machine data that's critical to your operations. Uncover the actionable insights from all your data — no matter the source or format. Leverage artificial intelligence and machine learning for predictive and proactive business decisions.

**Average Rating:** 4.3/5.0

**Total Reviews:** 415

#### How Do G2 Users Rate Splunk Enterprise?

- **Has the product been a good partner in doing business?:** 8.7/10 (Category avg: 8.8/10)
- **Dashboards and Visualization:** 9.0/10 (Category avg: 8.7/10)
- **Observability:** 9.1/10 (Category avg: 9.0/10)
- **Single Pane of Glass:** 8.4/10 (Category avg: 8.8/10)

#### Who Is the Company Behind Splunk Enterprise?

- **Seller:** [Cisco](https://www.g2.com/sellers/cisco)
- **Year Founded:** 1984
- **HQ Location:** San Jose, CA
- **Twitter:** @Cisco  
720,366 Twitter followers
- **LinkedIn® Page:** [www.linkedin.com](https://www.g2.com/external_clickthroughs/record?secure%5Bsource_type%5D=product_profile&secure%5Btoken%5D=476aeabc5a712d049453edd5c54ea0318890d9e60d93782e37fe028224df1cbd&secure%5Burl%5D=https%3A%2F%2Fwww.linkedin.com%2Fcompany%2Fcisco%2F&secure%5Burl_type%5D=linkedin_company_website)  
95,545 employees on LinkedIn®
- **Ownership:** NASDAQ:CSCO

#### Who Uses This Product?

- **Who Uses This:** Software Engineer, Senior Software Engineer
- **Top Industries:** Information Technology and Services, Computer Software
- **Company Size:** 64% Large, 27% Medium

#### What Do G2 Reviewers Say About Splunk Enterprise?

_AI-generated summary from verified user reviews_

##### Pros

- Users value the **innovation** of Splunk Enterprise, appreciating its user-friendly features and powerful analytics capabilities.
- Users value the **customization features** of Splunk Enterprise, enabling tailored insights and dynamic dashboards for effective monitoring.
- Users commend the **ease of use** of Splunk Enterprise, enhancing effective monitoring and quick issue resolution.
- Users value the **efficient log management** capabilities of Splunk Enterprise for accurate analysis and insights.
- Users value the **powerful reporting features** of Splunk Enterprise, enhancing data analysis and visualization capabilities significantly.

##### Cons

- Users find Splunk Enterprise to be **expensive** , especially as data volumes grow, impacting smaller teams' operations.
- Users face a **steep learning curve** with Splunk Enterprise, which can hinder quick mastery of its features.
- Users highlight the **expensive licensing** of Splunk Enterprise, making it difficult for some companies to adopt.
- Users face **integration issues** with Splunk Enterprise, requiring better add-ons and simpler architecture for easier deployment.
- Users feel that Splunk Enterprise has **missing features** , lacking important add-ons and more flexible data onboarding options.

#### What Are Recent G2 Reviews of Splunk Enterprise?

**["SPL search and dashboards are really useful"](https://www.g2.com/survey_responses/splunk-enterprise-review-12547655)**

**Rating:** 4.0/5.0 stars

_— Nishith J._

[Read full review](https://www.g2.com/survey_responses/splunk-enterprise-review-12547655)

**["Excellent Enterprise Observability and Log Management Solution for Hybrid Cloud Infrastructure"](https://www.g2.com/survey_responses/splunk-enterprise-review-12045230)**

**Rating:** 4.5/5.0 stars

_— RaviShankar S._

[Read full review](https://www.g2.com/survey_responses/splunk-enterprise-review-12045230)

#### What Are G2 Users Discussing About Splunk Enterprise?

- [What is Splunk Enterprise used for?](https://www.g2.com/discussions/what-is-splunk-enterprise-used-for) - 1 comment
- [What is the difference between Splunk Enterprise and Splunk Enterprise Security?](https://www.g2.com/discussions/splunk-enterprise-what-is-the-difference-between-splunk-enterprise-and-splunk-enterprise-security) - 1 comment
- [What are Splunk Enterprise components?](https://www.g2.com/discussions/what-are-splunk-enterprise-components) - 1 comment
- [Which apps ship with Splunk Enterprise?](https://www.g2.com/discussions/which-apps-ship-with-splunk-enterprise) - 1 comment
- [What does Splunk Enterprise do?](https://www.g2.com/discussions/what-does-splunk-enterprise-do) - 1 comment

### [LogicMonitor](https://www.g2.com/products/logicmonitor/reviews)

LogicMonitor is an AI-first observability platform that helps enterprises protect revenue, brand reputation, and customer experience in a digital-first world. As every customer interaction depends on application and infrastructure performance, downtime is more than an IT issue—it is a business risk. LogicMonitor eliminates blind spots across cloud, infrastructure, applications, and the Internet, giving IT teams unified visibility from user experience to code-level performance. With AI-powered insights, intelligent alerting, and automation, LogicMonitor helps organizations detect, prioritize, and prevent issues before they impact customers. By enabling teams to move from reactive incident response to autonomous IT operations, LogicMonitor helps modern enterprises reduce disruption, operate efficiently at scale, and keep digital services performing reliably. For more information, visit  www.logicmonitor.com and our blog, or follow us on LinkedIn, X, Facebook, and YouTube.

**Average Rating:** 4.5/5.0

**Total Reviews:** 587

#### How Do G2 Users Rate LogicMonitor?

- **Has the product been a good partner in doing business?:** 9.0/10 (Category avg: 8.8/10)
- **Dashboards and Visualization:** 8.5/10 (Category avg: 8.7/10)
- **Observability:** 8.7/10 (Category avg: 9.0/10)
- **Single Pane of Glass:** 8.6/10 (Category avg: 8.8/10)

#### Who Is the Company Behind LogicMonitor?

- **Seller:** [LogicMonitor](https://www.g2.com/sellers/logicmonitor)
- **Company Website:** www.logicmonitor.com
- **Year Founded:** 2007
- **HQ Location:** Santa Barbara, CA
- **Twitter:** @logicmonitor  
12,430 Twitter followers
- **LinkedIn® Page:** [www.linkedin.com](https://www.g2.com/external_clickthroughs/record?secure%5Bsource_type%5D=product_profile&secure%5Btoken%5D=0575241055ce06002a2f1fd1e29a1c2520416578fcf099eef91facac629c652e&secure%5Burl%5D=https%3A%2F%2Fwww.linkedin.com%2Fcompany%2F1165219%2F&secure%5Burl_type%5D=linkedin_company_website)  
1,226 employees on LinkedIn®

#### Who Uses This Product?

- **Who Uses This:** Infrastructure Manager, IT Manager
- **Top Industries:** Information Technology and Services, Computer Software
- **Company Size:** 52% Medium, 30% Large

#### What Do G2 Reviewers Say About LogicMonitor?

_AI-generated summary from verified user reviews_

##### Pros

- Users value the **ease of use** in LogicMonitor, praising its intuitive navigation and user-friendly interface.
- Users value the **ease of implementation** with LogicMonitor, praising its fast deployment and intuitive management.
- Users commend the **extensive monitoring capabilities** of LogicMonitor, covering various technologies in diverse environments.
- Users value **comprehensive monitoring** by LogicMonitor, offering deep visibility across applications, cloud, and hybrid infrastructures.
- Users value the **excellent customer support** offered by LogicMonitor, enhancing their ability to manage environments efficiently.

##### Cons

- Users find the **learning curve steep** , needing advanced skills for effective use of LogicMonitor's features.
- Users note the **limited features** of LogicMonitor, leading to potential workarounds and a steep learning curve.
- Users find LogicMonitor **expensive** , especially for small teams, with complex integrations and a lack of free tier options.
- Users express concern over **inadequate monitoring** capabilities, making it challenging to manage traditional server workloads effectively.
- Users find the **configuration complexity** challenging, requiring significant effort and skills for effective utilization of LogicMonitor.

#### What Are Recent G2 Reviews of LogicMonitor?

**["Predictive Forecasting Controls Are a Math Nerd’s Dream"](https://www.g2.com/survey_responses/logicmonitor-review-12957464)**

**Rating:** 4.5/5.0 stars

_— Nidhi S._

[Read full review](https://www.g2.com/survey_responses/logicmonitor-review-12957464)

**["LogicMonitor has cut our MTTR 42% and provided tight ROI."](https://www.g2.com/survey_responses/logicmonitor-review-12956089)**

**Rating:** 4.5/5.0 stars

_— Tiya P._

[Read full review](https://www.g2.com/survey_responses/logicmonitor-review-12956089)

#### What Are G2 Users Discussing About LogicMonitor?

- [What is LogicMonitor used for?](https://www.g2.com/discussions/what-is-logicmonitor-used-for)
- [What does LogicMonitor do?](https://www.g2.com/discussions/what-does-logicmonitor-do)
- [Where does LogicMonitor store your monitored data?](https://www.g2.com/discussions/where-does-logicmonitor-store-your-monitored-data)
- [What does logic monitor do?](https://www.g2.com/discussions/what-does-logic-monitor-do) - 1 comment
- [How much does LogicMonitor cost?](https://www.g2.com/discussions/how-much-does-logicmonitor-cost)

### [IBM SevOne](https://www.g2.com/products/ibm-sevone/reviews)

IBM® SevOne, now part of the Concert platform, gives NetOps teams deep, real-time visibility into hybrid cloud and SD-WAN performance —&nbsp;combining network-layer intelligence and app-aware insights to speed up resolution, reduce complexity, and ensure seamless digital experiences. In a world of hybrid clouds and ever-rising user expectations, downtime is not an option. IBM SevOne 8.0 equips NetOps teams with real-time, unified visibility across complex networks—from SD-WAN and multi-cloud (AWS, GCP, Azure) to Kubernetes. Built for speed and scale, it reduces time-to-value with native widget deployment, enhances diagnostics with advanced Flow Filters, and integrates seamlessly with vendors like Cisco, Aruba, and Palo Alto. The result? A cloud-smart, app-aware network that proactively detects issues before they impact users. With SevOne, you don’t just monitor. You take control of the future of network observability—today.

**Average Rating:** 4.3/5.0

**Total Reviews:** 70

#### How Do G2 Users Rate IBM SevOne?

- **Has the product been a good partner in doing business?:** 9.0/10 (Category avg: 8.8/10)
- **Dashboards and Visualization:** 8.9/10 (Category avg: 8.7/10)
- **Observability:** 9.4/10 (Category avg: 9.0/10)
- **Single Pane of Glass:** 9.4/10 (Category avg: 8.8/10)

#### Who Is the Company Behind IBM SevOne?

- **Seller:** [IBM](https://www.g2.com/sellers/ibm)
- **Year Founded:** 1911
- **HQ Location:** Armonk, New York, United States
- **Twitter:** @IBMSecurity  
74,660 Twitter followers
- **LinkedIn® Page:** [www.linkedin.com](https://www.g2.com/external_clickthroughs/record?secure%5Bsource_type%5D=product_profile&secure%5Btoken%5D=14b544adaece4fdbc987f1d7f7028048c22259946811200cc751263825586af9&secure%5Burl%5D=https%3A%2F%2Fwww.linkedin.com%2Fcompany%2F1009%2F&secure%5Burl_type%5D=linkedin_company_website)  
328,202 employees on LinkedIn®
- **Ownership:** SWX:IBM

#### Who Uses This Product?

- **Top Industries:** Computer Software, Information Technology and Services
- **Company Size:** 38% Medium, 32% Large

#### What Do G2 Reviewers Say About IBM SevOne?

_AI-generated summary from verified user reviews_

##### Pros

- Users value the **real-time monitoring capabilities** of IBM SevOne, enhancing network performance and proactive issue resolution.
- Users highlight the **reliability** of IBM SevOne, enabling proactive monitoring and efficient issue resolution.
- Users value the **real-time monitoring capabilities** of IBM SevOne, enabling effective management of complex environments and ensuring visibility.
- Users value the **customizable dashboards** of IBM SevOne, enhancing visibility and improving network management efficiency.
- Users value the **customizable app-centric dashboards** of IBM SevOne, offering excellent visibility and proactive network monitoring.

##### Cons

- Users often face a **steep learning curve** with IBM SevOne, making setup and customization challenging and time-consuming.
- Users experience a **difficult learning curve** , as setup and customization demand significant time and effort to master.
- Users report a **complex setup** and steep learning curve, requiring significant effort to customize and utilize effectively.
- Users find the **complexity** of IBM SevOne's UI and setup process daunting, especially for new or casual users.
- Users find the **complex configuration** of IBM SevOne daunting, especially for new or less technical users.

#### What Are Recent G2 Reviews of IBM SevOne?

**["Real-Time Insights That Empower Network Teams"](https://www.g2.com/survey_responses/ibm-sevone-review-11712084)**

**Rating:** 4.0/5.0 stars

_— Ravi S._

[Read full review](https://www.g2.com/survey_responses/ibm-sevone-review-11712084)

**["Powerful and Scalable, But Be Ready for a Learning Curve"](https://www.g2.com/survey_responses/ibm-sevone-review-11793711)**

**Rating:** 4.5/5.0 stars

_— Rahul S._

[Read full review](https://www.g2.com/survey_responses/ibm-sevone-review-11793711)

#### What Are G2 Users Discussing About IBM SevOne?

- [What is the main objective of Software Defined Networking SDN?](https://www.g2.com/discussions/what-is-the-main-objective-of-software-defined-networking-sdn)
- [What are the characteristics of a software defined networking or SDN system?](https://www.g2.com/discussions/what-are-the-characteristics-of-a-software-defined-networking-or-sdn-system)
- [What are the key features of SDN?](https://www.g2.com/discussions/what-are-the-key-features-of-sdn) - 1 comment
- [What are the features of software defined networking?](https://www.g2.com/discussions/what-are-the-features-of-software-defined-networking)

### [SolarWinds Observability](https://www.g2.com/products/solarwinds-worldwide-llc-solarwinds-observability/reviews)

SolarWinds® Observability is a comprehensive full-stack observability solution designed to meet the diverse needs of modern organizations, regardless of their size. This solution provides deep visibility into hybrid ecosystems, enabling users to monitor and manage both on-premises and cloud environments effectively. By optimizing performance and ensuring availability across distributed hybrid IT infrastructures, SolarWinds Observability supports organizations in navigating the complexities of their IT environments. Targeted at IT professionals and organizations that require robust monitoring capabilities, SolarWinds Observability caters to a wide range of use cases. It is particularly beneficial for businesses operating in hybrid environments, where the integration of on-premises and cloud resources is essential. The solution allows users to gain a holistic view of their networks, applications, databases, and user experiences, thereby facilitating better decision-making and operational efficiency. This is especially crucial in today’s fast-paced digital landscape, where downtime can significantly impact service reliability and customer satisfaction. One of the standout features of SolarWinds Observability is its built-in intelligence powered by AIOps capabilities. This functionality accelerates issue remediation by enabling users to detect, troubleshoot, and resolve problems more efficiently. The advanced predictive analysis and anomaly-based alerts help organizations proactively address potential issues before they escalate, ultimately reducing downtime and enhancing service reliability. Additionally, the solution's log pattern analysis further streamlines the troubleshooting process, allowing IT teams to focus on strategic initiatives rather than being bogged down by operational challenges. SolarWinds Observability offers flexibility in deployment, providing users with the option to choose between self-hosted and SaaS models. The self-hosted option integrates seamlessly with other SolarWinds services, such as security and storage monitoring, while the SaaS option is tailored for deeper monitoring of custom and cloud-based applications. This adaptability ensures that organizations can select the deployment method that best aligns with their operational needs and infrastructure. Moreover, SolarWinds Observability stands out by consolidating multiple monitoring tools into a single, integrated solution. This not only simplifies the monitoring process but also helps organizations reduce costs associated with managing disparate systems. By offering comprehensive visibility across hybrid IT environments, SolarWinds Observability empowers organizations to optimize their operations and enhance overall performance.

**Average Rating:** 4.3/5.0

**Total Reviews:** 824

#### How Do G2 Users Rate SolarWinds Observability?

- **Has the product been a good partner in doing business?:** 8.3/10 (Category avg: 8.8/10)
- **Dashboards and Visualization:** 9.0/10 (Category avg: 8.7/10)
- **Observability:** 8.2/10 (Category avg: 9.0/10)
- **Single Pane of Glass:** 8.9/10 (Category avg: 8.8/10)

#### Who Is the Company Behind SolarWinds Observability?

- **Seller:** [SolarWinds Worldwide LLC](https://www.g2.com/sellers/solarwinds-worldwide-llc)
- **Company Website:** www.solarwinds.com
- **Year Founded:** 1999
- **HQ Location:** Austin, TX
- **Twitter:** @solarwinds  
19,570 Twitter followers
- **LinkedIn® Page:** [www.linkedin.com](https://www.g2.com/external_clickthroughs/record?secure%5Bsource_type%5D=product_profile&secure%5Btoken%5D=a1765c38bb6352c68352819e76f659e536738a569e70b5125a52a054a2348dc6&secure%5Burl%5D=https%3A%2F%2Fwww.linkedin.com%2Fcompany%2F166039%2F&secure%5Burl_type%5D=linkedin_company_website)  
2,824 employees on LinkedIn®

#### Who Uses This Product?

- **Who Uses This:** Network Engineer, Network Administrator
- **Top Industries:** Information Technology and Services, Hospital & Health Care
- **Company Size:** 43% Large, 35% Medium

#### What Do G2 Reviewers Say About SolarWinds Observability?

_AI-generated summary from verified user reviews_

##### Pros

- Users highlight the **ease of use** of SolarWinds Observability, appreciating its intuitive interface and unified dashboards.
- Users appreciate the **comprehensive visibility** with SolarWinds Observability, enhancing system management and performance monitoring effortlessly.
- Users appreciate the **visibility** provided by SolarWinds Observability, making system management and performance monitoring effortless.
- Users appreciate the **real-time monitoring** of SolarWinds Observability, which enhances system management and troubleshooting efficiency.
- Users appreciate the **easy-to-read dashboards** of SolarWinds Observability, making monitoring and system management seamless and efficient.

##### Cons

- Users face a **significant learning curve** in leveraging advanced features and navigating the setup and configuration process.
- Users find the **pricing to be steep** , especially with costs increasing rapidly as more features are utilized.
- Users find SolarWinds Observability **not user-friendly** due to a difficult new interface and outdated setup documentation.
- Users face **integration issues** due to limited out-of-the-box support and challenges with setup and custom work.
- Users report **poor customer support** from SolarWinds Observability, with insufficient assistance for integrations and troubleshooting issues.

#### What Are Recent G2 Reviews of SolarWinds Observability?

**["Powerful Database Observability"](https://www.g2.com/survey_responses/solarwinds-observability-review-12663147)**

**Rating:** 4.5/5.0 stars

_— Naveen T._

[Read full review](https://www.g2.com/survey_responses/solarwinds-observability-review-12663147)

**["Highly recommended for organizations looking to modernize their monitoring strategy."](https://www.g2.com/survey_responses/solarwinds-observability-review-13140564)**

**Rating:** 5.0/5.0 stars

_— MJ S._

[Read full review](https://www.g2.com/survey_responses/solarwinds-observability-review-13140564)

#### What Are G2 Users Discussing About SolarWinds Observability?

- [What is SolarWinds Network Performance Monitor used for?](https://www.g2.com/discussions/what-is-solarwinds-network-performance-monitor-used-for) - 2 comments
- [What is SolarWinds NetFlow Traffic Analyzer used for?](https://www.g2.com/discussions/what-is-solarwinds-netflow-traffic-analyzer-used-for) - 1 comment
- [What is SolarWinds Network Configuration Manager used for?](https://www.g2.com/discussions/what-is-solarwinds-network-configuration-manager-used-for)
- [What is SolarWinds Storage Resource Monitor used for?](https://www.g2.com/discussions/what-is-solarwinds-storage-resource-monitor-used-for)
- [What is SolarWinds Log Analyzer used for?](https://www.g2.com/discussions/what-is-solarwinds-log-analyzer-used-for)

### [Checkmk](https://www.g2.com/products/checkmk/reviews)

Checkmk is a full-stack monitoring and observability platform designed to provide unified visibility into hybrid IT infrastructures. With more than 2,000 built-in integrations, it offers broad coverage across networks, servers, cloud workloads, Kubernetes and applications. The platform is highly automated, featuring auto-discovery of hosts and services and rule-based configuration to reduce manual setup. It is highly scalable, capable of efficiently monitoring thousands of hosts and millions of services. A central web-based interface allows users to manage configuration, visualize data with customizable dashboards, and track system performance over time. Checkmk is available as packages for all common Linux distributions, as a virtual or physical appliance, through AWS and Azure Marketplace images, or as SaaS. Checkmk is available in four editions: Checkmk Community offers free and open source monitoring for small infrastructures. Checkmk Pro allows for monitoring at speed and scale for data center infrastructures. Checkmk Ultimate offers full-stack observability for hybrid and cloud-native infrastructures which is also available with multi-tenancy and data segregation to support security and compliance. And Checkmk Cloud for full-stack observability for hybrid and cloud-native infrastructures in a SaaS platform. Available extensions include synthetic monitoring and OpenTelemetry for application monitoring. The Checkmk Relay enables secure data collection for segmented networks using outbound-only communication, supporting fully air-gapped and zero-inbound monitoring deployments. Checkmk supports integration with ITSM tools and third-party platforms, enabling automatic ticket creation and consistent alerting. Features such as forecasting, capacity planning, and asset inventory as well as lifecycle management and auto-registration help teams manage dynamic IT environments. Monitoring capabilities: - Monitoring of hybrid infrastructures: cloud, on-premises, virtual, and container environments. - 2000+ built-in integrations networks, servers, cloud workloads, Kubernetes and applications out-of-the-box dashboards provide key metrics for AWS and Azure environments, Linux and Windows servers, and Kubernetes clusters. - Automated discovery and configuration. - Alerting with native ITSM integrations. Operational benefits: - Provides insights into system health, capacity trends, and future resource needs through built-in assessments and forecasting tools. - Reduces manual effort with auto-discovery, rule-based configuration, and centralized agent management as well as auto-registration and host lifecycle management. - Accelerates incident response time by using custom self-healing workflows via the ‘Alert Handler’. - Allows creation of tailored dashboards and views to focus on the most relevant metrics for each team. - Maintains an up-to-date inventory of hardware and software assets, enriched with live monitoring data. - Supports distributed monitoring and can handle massive amounts of data. Why choose Checkmk? - Cost Efficiency: Transparent pricing model with a strong price-performance ratio - Security: Meets stringent security requirements, including fully air-gapped deployments and zero-inbound monitoring. - Visibility: Delivers broad and deep visibility with flexible deployment options. - Scalability: Scales efficiently to support large, distributed environments with high host and service counts. - Extensibility: Supports custom plug-ins, integrations, synthetic monitoring to monitor you applications from the user’s perspective and OpenTelemetry for application monitoring. Customers include: Adobe, Cloudera, Fujitsu, Siemens, Orange, VW, HP, Zalando, Fitbit, NEC, Continental, NHL, Capgemini, Sixt, Intesa SanPaolo

**Average Rating:** 4.7/5.0

**Total Reviews:** 294

#### How Do G2 Users Rate Checkmk?

- **Has the product been a good partner in doing business?:** 9.0/10 (Category avg: 8.8/10)
- **Dashboards and Visualization:** 7.7/10 (Category avg: 8.7/10)
- **Observability:** 8.3/10 (Category avg: 9.0/10)
- **Single Pane of Glass:** 7.4/10 (Category avg: 8.8/10)

#### Who Is the Company Behind Checkmk?

- **Seller:** [Checkmk](https://www.g2.com/sellers/checkmk)
- **Company Website:** checkmk.com
- **Year Founded:** 2007
- **HQ Location:** Munich, DE
- **Twitter:** @checkmk  
1,755 Twitter followers
- **LinkedIn® Page:** [www.linkedin.com](https://www.g2.com/external_clickthroughs/record?secure%5Bsource_type%5D=product_profile&secure%5Btoken%5D=3ca503fe26c40a0637ffb12376dcf8580a5f90178bc7980702b688b368f8a219&secure%5Burl%5D=https%3A%2F%2Fwww.linkedin.com%2Fcompany%2F11824415%2F&secure%5Burl_type%5D=linkedin_company_website)  
231 employees on LinkedIn®

#### Who Uses This Product?

- **Who Uses This:** IT Engineer, Systemadministrator
- **Top Industries:** Information Technology and Services, Computer & Network Security
- **Company Size:** 42% Medium, 40% Large

#### What Do G2 Reviewers Say About Checkmk?

_AI-generated summary from verified user reviews_

##### Pros

- Users find Checkmk extremely **easy to use** , appreciating its clear documentation and quick setup for effective monitoring.
- Users appreciate the **flexible and powerful monitoring** capabilities of Checkmk, making it suitable for diverse IT infrastructures.
- Users appreciate the **comprehensive monitoring capabilities** of Checkmk, providing visibility across diverse IT infrastructures effortlessly.
- Users value the **flexibility and customization** of Checkmk, making it a versatile and powerful monitoring solution.
- Users value the **real-time monitoring** capabilities of Checkmk, enabling seamless observation of applications and infrastructure.

##### Cons

- Users find the **learning curve steep** , making onboarding and finding settings difficult for non-regular users.
- Users find **difficult learning** curves with Checkmk, particularly in customizing dashboards and understanding complex settings.
- Users find the **onboarding process and configuration overly complex** , posing challenges for new and non-regular users.
- Users experience a **steep learning curve** with Checkmk, particularly for advanced configurations and custom development.
- Users find the **complex setup** of Checkmk challenging, especially for non-regular users and advanced features.

#### What Are Recent G2 Reviews of Checkmk?

**["Efficient monitoring, but reports need improvement"](https://www.g2.com/survey_responses/checkmk-review-9773274)**

**Rating:** 5.0/5.0 stars

_— Martin K._

[Read full review](https://www.g2.com/survey_responses/checkmk-review-9773274)

**["Enterprise grade monitoring as it should be"](https://www.g2.com/survey_responses/checkmk-review-1510115)**

**Rating:** 5.0/5.0 stars

_— Rolf A._

[Read full review](https://www.g2.com/survey_responses/checkmk-review-1510115)

#### What Are G2 Users Discussing About Checkmk?

- [Why Checkmk?](https://www.g2.com/discussions/why-checkmk) - 1 comment
- [Is Check MK free?](https://www.g2.com/discussions/is-check-mk-free) - 1 comment, 1 upvote
- [Is Checkmk open source?](https://www.g2.com/discussions/is-checkmk-open-source) - 8 comments
- [What does Checkmk do?](https://www.g2.com/discussions/what-does-checkmk-do) - 2 comments

### [ManageEngine Applications Manager](https://www.g2.com/es/products/manageengine-applications-manager/reviews)

ManageEngine Applications Manager es una solución de monitoreo de rendimiento de aplicaciones e infraestructura de TI que está diseñada para combatir los problemas de infraestructura moderna y garantizar que su negocio y los usuarios finales no se vean afectados por un rendimiento deficiente y tiempos de inactividad. Al aprovechar el monitoreo profundo del rendimiento de aplicaciones con instrumentación de código byte, monitoreo de infraestructura, monitoreo de nube híbrida y monitoreo de experiencia digital desde una única consola, los equipos de TI y DevOps podrán obtener información a nivel de código, automatizar sus procesos, identificar y resolver problemas de rendimiento, y ofrecer mejores resultados comerciales. En general, nuestro producto ayudará a las empresas a optimizar el uso de aplicaciones y los ingresos, reducir el MTTR, mejorar los procesos de DevOps, migrar a la nube con confianza, responder a incidentes más rápido y garantizar experiencias de usuario sin interrupciones.

**Average Rating:** 4.7/5.0

**Total Reviews:** 110

#### How Do G2 Users Rate ManageEngine Applications Manager?

- **¿Ha sido the product un buen socio para hacer negocios?:** 9.2/10 (Category avg: 8.8/10)
- **Paneles y visualización:** 8.6/10 (Category avg: 8.7/10)
- **Observancia:** 8.0/10 (Category avg: 9.0/10)
- **Panel único de vidrio:** 7.7/10 (Category avg: 8.8/10)

#### Who Is the Company Behind ManageEngine Applications Manager?

- **Vendedor:** [Zoho](https://www.g2.com/es/sellers/zoho-b00ca9d5-bca8-41b5-a8ad-275480841704)
- **Año de fundación:** 1996
- **Ubicación de la sede:** Austin, TX
- **Twitter:** @Zoho  
137,880 seguidores en Twitter
- **Página de LinkedIn®:** [www.linkedin.com](https://www.g2.com/es/external_clickthroughs/record?secure%5Bsource_type%5D=product_profile&secure%5Btoken%5D=9c8e45ddb296c32c6c5597ef9ba945c94562c57624f7bd1dcf1a9e9931f71578&secure%5Burl%5D=https%3A%2F%2Fwww.linkedin.com%2Fcompany%2F38373%2F&secure%5Burl_type%5D=linkedin_company_website)  
30,766 empleados en LinkedIn®
- **Teléfono:** +1 (888) 900-9646 

#### Who Uses This Product?

- **Top Industries:** Tecnología de la información y servicios, Software de Computadora
- **Company Size:** 45% Medium, 42% Large

#### What Do G2 Reviewers Say About ManageEngine Applications Manager?

_AI-generated summary from verified user reviews_

##### Pros

- Los usuarios aprecian el **monitoreo integral de extremo a extremo** ofrecido por ManageEngine Applications Manager, mejorando la gestión del rendimiento y la eficiencia operativa.
- Los usuarios valoran las **capacidades de monitoreo** de ManageEngine Applications Manager, lo que permite respuestas proactivas a problemas del sistema antes de que afecten al cliente.
- Los usuarios valoran las **capacidades de monitoreo integral** de ManageEngine Applications Manager, asegurando una rápida resolución de problemas y un rendimiento mejorado.
- Los usuarios aprecian el **monitoreo en tiempo real** de ManageEngine Applications Manager, facilitando la detección y resolución rápida de problemas de rendimiento.
- Los usuarios valoran la **visibilidad en tiempo real** en ManageEngine Applications Manager, lo que permite la resolución proactiva de problemas y el monitoreo del rendimiento.

##### Cons

- Los usuarios notan **características limitadas** , particularmente en integración y escalabilidad, lo que dificulta la efectividad en entornos más grandes.
- Los usuarios notan **limitaciones de integración** y problemas de escalabilidad, lo que afecta la usabilidad en entornos empresariales grandes.
- Los usuarios enfrentan **problemas de integración** con ManageEngine Applications Manager, complicando las configuraciones y limitando la compatibilidad con herramientas modernas.
- Los usuarios enfrentan una **curva de aprendizaje pronunciada** durante la configuración inicial, lo que complica la configuración de los parámetros de monitoreo en entornos más grandes.
- Los usuarios encuentran que la **complejidad de la configuración inicial** consume mucho tiempo y es desafiante, especialmente en entornos más grandes.

#### What Are Recent G2 Reviews of ManageEngine Applications Manager?

**["Herramienta confiable para el monitoreo del rendimiento de aplicaciones para ManageEngine Applications Manager."](https://www.g2.com/es/survey_responses/manageengine-applications-manager-review-12516609)**

**Rating:** 5.0/5.0 stars

_— Ankur P._

[Read full review](https://www.g2.com/es/survey_responses/manageengine-applications-manager-review-12516609)

**["Herramienta integral para la gestión del rendimiento de aplicaciones"](https://www.g2.com/es/survey_responses/manageengine-applications-manager-review-12533668)**

**Rating:** 5.0/5.0 stars

_— Rashmita T._

[Read full review](https://www.g2.com/es/survey_responses/manageengine-applications-manager-review-12533668)

#### What Are G2 Users Discussing About ManageEngine Applications Manager?

- [¿Cuál de las siguientes estadísticas proporciona APM?](https://www.g2.com/es/discussions/which-of-the-following-statistics-do-apm-provide) - 1 comment
- [What is APM tool?](https://www.g2.com/es/discussions/what-is-apm-tool) - 1 comment
- [What is the use of ManageEngine?](https://www.g2.com/es/discussions/what-is-the-use-of-manageengine) - 1 comment
- [¿Qué es ManageEngine Applications Manager?](https://www.g2.com/es/discussions/what-is-manageengine-applications-manager) - 1 comment

### [Rakuten SixthSense Observability](https://www.g2.com/es/products/rakuten-sixthsense-observability/reviews)

En el panorama digital actual, las empresas necesitan una solución de Monitoreo del Rendimiento de Aplicaciones (APM) poderosa y completa para mantenerse a la vanguardia. Presentamos Rakuten SixthSense Observability, una herramienta APM de próxima generación que transforma la forma en que monitoreas, analizas y optimizas tus aplicaciones e infraestructura. Con su robusto conjunto de características y análisis avanzados, Rakuten SixthSense Observability te permite identificar y resolver problemas de manera proactiva, optimizar operaciones y mejorar las experiencias de los clientes. Capacidades Clave: • Monitoreo y Alertas Integrales: Rakuten SixthSense Observability ofrece monitoreo de extremo a extremo de tus aplicaciones, infraestructura y rendimiento de la red. Con alertas en tiempo real y paneles personalizables, puedes detectar rápidamente problemas y obtener información procesable sobre la salud y el rendimiento de tus sistemas. • Rastreo Distribuido y Correlación: Obtén visibilidad completa del rendimiento de tu aplicación con el rastreo distribuido, que sigue transacciones y solicitudes a través de múltiples servicios y componentes. Esta característica te ayuda a identificar cuellos de botella, problemas de latencia y errores, facilitando la optimización de tu aplicación y mejorando las experiencias de los clientes. • Detección de Anomalías y Aprendizaje Automático: Aprovecha las capacidades avanzadas de aprendizaje automático de Rakuten SixthSense para identificar automáticamente patrones inusuales y desviaciones en el rendimiento de la aplicación y la utilización de recursos. Este enfoque proactivo te permite detectar y resolver problemas antes de que impacten en tu negocio y clientes. • Análisis y Visualización Avanzados: Las herramientas de visualización de datos y análisis de Rakuten SixthSense te permiten profundizar en los datos de rendimiento de tu aplicación. Genera informes personalizados, analiza tendencias y descubre patrones ocultos que pueden impulsar la mejora continua y la optimización. • Gestión e Integración de Registros: Recoge, analiza y almacena sin esfuerzo registros de diversas fuentes con la función de gestión de registros integrada de Rakuten SixthSense. Esta integración fluida te permite correlacionar datos de registros con métricas de rendimiento y rastreos, proporcionando una comprensión integral del comportamiento de tu aplicación. • Escalabilidad y Flexibilidad: Rakuten SixthSense Observability está diseñado para escalar con las crecientes necesidades de tu negocio, apoyando una amplia gama de aplicaciones, servicios e infraestructura. Su arquitectura flexible te permite personalizar la herramienta según tus requisitos específicos e integrarla con otras soluciones de monitoreo y observabilidad. Conjunto de Características Actual: • Monitoreo del Rendimiento de Aplicaciones: Visibilidad completa en Java, PHP, Node.js, Python, Go y mucho más. Características Clave incluyen Rastreo Distribuido, Perfilado, Monitoreo de Bases de Datos. • Monitoreo de Infraestructura: Obtén una vista panorámica de la salud de tu infraestructura y obtén información detallada con un despliegue fácil. Características Clave incluyen Kubernetes, VMs, Servidores Web, Integraciones en la Nube. • Monitoreo de la Experiencia Digital: Mejora la experiencia del usuario final de tus aplicaciones mapeadas con información contextual de métricas de rendimiento de aplicaciones. • Monitoreo de Navegadores: Métricas para optimizar la experiencia de los usuarios finales y ayudar a mejorar el rendimiento de la aplicación. • Monitoreo Móvil: Monitorea fallos, rendimiento y métricas de uso para tus aplicaciones móviles. • Monitoreo Sintético: Simula transacciones de usuarios finales utilizando scripts de prueba de bajo código, sin código. • Monitoreo de VMs: La capacidad de monitoreo de VMs te permite ver el rendimiento de tu infraestructura y la salud de servidores, máquinas virtuales, contenedores, bases de datos, etc., de un vistazo. • Motor Cognitivo SixthSense: Observabilidad moderna y enfoque proactivo utilizando inteligencia artificial. La aplicación utiliza diferentes algoritmos de IA/ML que pueden predecir métricas de rendimiento con una precisión de hasta el 98% y un nivel de confianza del 90%.

**Average Rating:** 4.6/5.0

**Total Reviews:** 52

#### How Do G2 Users Rate Rakuten SixthSense Observability?

- **¿Ha sido the product un buen socio para hacer negocios?:** 9.2/10 (Category avg: 8.8/10)
- **Paneles y visualización:** 10.0/10 (Category avg: 8.7/10)
- **Observancia:** 10.0/10 (Category avg: 9.0/10)
- **Panel único de vidrio:** 10.0/10 (Category avg: 8.8/10)

#### Who Is the Company Behind Rakuten SixthSense Observability?

- **Vendedor:** [Rakuten SixthSense](https://www.g2.com/es/sellers/rakuten-sixthsense-f1af4c23-8be7-4bf4-a775-a4d50eebce5d)
- **Año de fundación:** 2016
- **Ubicación de la sede:** Bengaluru, IN
- **Página de LinkedIn®:** [www.linkedin.com](https://www.g2.com/es/external_clickthroughs/record?secure%5Bsource_type%5D=product_profile&secure%5Btoken%5D=56b248cb58d0ee9d638f70976e5e005d45b5ce20f9d29e7f666aae203e30aa49&secure%5Burl%5D=https%3A%2F%2Fwww.linkedin.com%2Fcompany%2Frakuten-sixthsense%2F&secure%5Burl_type%5D=linkedin_company_website)  
5 empleados en LinkedIn®
- **Propiedad:** TYO: 4755

#### Who Uses This Product?

- **Who Uses This:** Ingeniero de Software Senior
- **Top Industries:** Tecnología de la información y servicios, Videojuegos
- **Company Size:** 47% Large, 38% Medium

#### What Do G2 Reviewers Say About Rakuten SixthSense Observability?

_AI-generated summary from verified user reviews_

##### Pros

- Los usuarios valoran la **profunda visibilidad** en el rendimiento de la aplicación proporcionada por Rakuten SixthSense, mejorando la detección proactiva de anomalías y la toma de decisiones.
- Los usuarios aprecian el **sistema de alertas eficiente** , que permite transiciones rápidas de alertas a la resolución de código en un solo panel.
- Los usuarios valoran el **excelente soporte al cliente** de Rakuten SixthSense, mejorando su experiencia con la plataforma.
- Los usuarios aprecian la **facilidad de uso** de Rakuten SixthSense Observability, simplificando la resolución de problemas con una interfaz intuitiva.
- Los usuarios aprecian la **fácil implementación** de Rakuten SixthSense Observability, haciendo que el monitoreo y la depuración sean directos y eficientes.

##### Cons

- Los usuarios encuentran el **configuración compleja** desafiante, requiriendo un esfuerzo significativo de incorporación a pesar del soporte receptivo para la personalización.
- Los usuarios encuentran que la **pobre documentación** de Rakuten SixthSense Observability es insuficiente, lo que dificulta el uso efectivo y la incorporación.
- Los usuarios informan de **alertas de falsos positivos** y desean una funcionalidad mejorada para la visualización oportuna de registros de errores y notificaciones.
- Los usuarios señalan el **sistema de alertas ineficiente** , citando frecuentes falsos positivos y la falta de las características deseadas de informes en el panel de control.
- Los usuarios sienten que **la documentación necesita mejoras** para mejorar la usabilidad general y la experiencia del usuario de la herramienta.

#### What Are Recent G2 Reviews of Rakuten SixthSense Observability?

**["Una muy buena herramienta de monitoreo y observabilidad SAAS"](https://www.g2.com/es/survey_responses/rakuten-sixthsense-observability-review-11287792)**

**Rating:** 5.0/5.0 stars

_— Usuario verificado en Videojuegos_

[Read full review](https://www.g2.com/es/survey_responses/rakuten-sixthsense-observability-review-11287792)

**["¡Gran herramienta de monitoreo!"](https://www.g2.com/es/survey_responses/rakuten-sixthsense-observability-review-8230168)**

**Rating:** 5.0/5.0 stars

_— Usuario verificado en Tecnología de la información y servicios_

[Read full review](https://www.g2.com/es/survey_responses/rakuten-sixthsense-observability-review-8230168)

### [IBM Turbonomic](https://www.g2.com/products/ibm-turbonomic/reviews)

IBM Turbonomic, now part of the Concert platform, is a real-time application resource management platform designed to help users optimize and manage resources across hybrid and multi-cloud environments. This innovative solution continuously analyzes application performance and resource utilization, automating critical resourcing decisions to ensure optimal application performance while minimizing costs associated with cloud and infrastructure resources. IBM Turbonomic addresses the challenges of managing complex, dynamic environments. As organizations increasingly adopt hybrid and multi-cloud strategies, the need for effective resource management becomes paramount. Turbonomic provides a comprehensive approach to performance management by analyzing the entire technology stack, identifying inefficiencies, and uncovering dependencies that can impact application performance. This proactive management capability allows organizations to maintain high service levels while controlling costs. One of the key features of IBM Turbonomic is its ability to continuously adjust application resources in real time. By monitoring resource utilization and application performance, Turbonomic prevents performance degradation and overprovisioning. This dynamic adjustment ensures that applications receive the necessary resources when needed, which is crucial for maintaining optimal performance levels. Additionally, the platform automates resource decisions such as scaling and placement, allowing organizations to focus on strategic initiatives rather than manual resource management tasks. Turbonomic customers report an average 33% reduction in cloud and infrastructure waste without impacting application performance, and return-on-investment of 471% over three years. IBM Turbonomic is also available on AWS Marketplace. By leveraging Turbonomic, businesses can ensure that their applications run smoothly, resources are utilized effectively, and costs are kept in check, all while maintaining a focus on innovation and growth. For further information, please visit www.ibm.com/products/turbonomic

**Average Rating:** 4.4/5.0

**Total Reviews:** 288

#### How Do G2 Users Rate IBM Turbonomic?

- **Has the product been a good partner in doing business?:** 8.9/10 (Category avg: 8.8/10)
- **Dashboards and Visualization:** 8.8/10 (Category avg: 8.7/10)
- **Observability:** 8.3/10 (Category avg: 9.0/10)
- **Single Pane of Glass:** 8.5/10 (Category avg: 8.8/10)

#### Who Is the Company Behind IBM Turbonomic?

- **Seller:** [IBM](https://www.g2.com/sellers/ibm)
- **Company Website:** www.ibm.com
- **Year Founded:** 1911
- **HQ Location:** Armonk, New York, United States
- **Twitter:** @IBMSecurity  
74,660 Twitter followers
- **LinkedIn® Page:** [www.linkedin.com](https://www.g2.com/external_clickthroughs/record?secure%5Bsource_type%5D=product_profile&secure%5Btoken%5D=14b544adaece4fdbc987f1d7f7028048c22259946811200cc751263825586af9&secure%5Burl%5D=https%3A%2F%2Fwww.linkedin.com%2Fcompany%2F1009%2F&secure%5Burl_type%5D=linkedin_company_website)  
328,202 employees on LinkedIn®

#### Who Uses This Product?

- **Who Uses This:** Software Engineer, System Engineer
- **Top Industries:** Information Technology and Services, Computer Software
- **Company Size:** 43% Large, 32% Medium

#### What Do G2 Reviewers Say About IBM Turbonomic?

_AI-generated summary from verified user reviews_

##### Pros

- Users appreciate the **cost optimization** achieved by IBM Turbonomic, benefiting from improved resource management and reduced expenses.
- Users appreciate the **ease of use** of IBM Turbonomic, making resource management and workload analysis straightforward and efficient.
- Users admire the **impressive automation** of IBM Turbonomic, effectively managing resources and enhancing performance without manual intervention.
- Users value the **automated resource optimization** of IBM Turbonomic, enhancing performance and simplifying resource management efforts.
- Users value the **real-time monitoring** of Turbonomic for its actionable insights that enhance performance and reliability.

##### Cons

- Users face a **steep learning curve** with IBM Turbonomic, making initial setup and configuration challenging for newcomers.
- Users struggle with a **steep learning curve** for IBM Turbonomic, requiring time and effort to understand its complexities.
- Users face a **complex configuration** process that hinders quick onboarding and a seamless experience with IBM Turbonomic.
- Users face a significant **learning curve** with IBM Turbonomic, requiring time and patience for effective use.
- Users find the **difficult setup** of IBM Turbonomic challenging, requiring significant time and effort to understand and configure.

#### What Are Recent G2 Reviews of IBM Turbonomic?

**["Advanced Infrastructure Optimizer with challenging configuration requirements."](https://www.g2.com/survey_responses/ibm-turbonomic-review-12821189)**

**Rating:** 4.0/5.0 stars

_— Pardeep J._

[Read full review](https://www.g2.com/survey_responses/ibm-turbonomic-review-12821189)

**["Smarter Resource Optimization with Real-Time Automation"](https://www.g2.com/survey_responses/ibm-turbonomic-review-12380847)**

**Rating:** 5.0/5.0 stars

_— Bishal D._

[Read full review](https://www.g2.com/survey_responses/ibm-turbonomic-review-12380847)

#### What Are G2 Users Discussing About IBM Turbonomic?

- [How much does Turbonomic cost?](https://www.g2.com/discussions/how-much-does-turbonomic-cost)
- [Who uses Turbonomic?](https://www.g2.com/discussions/who-uses-turbonomic)
- [What is Turbonomic IBM?](https://www.g2.com/discussions/what-is-turbonomic-ibm)
- [What is Turbonomic used for?](https://www.g2.com/discussions/what-is-turbonomic-used-for)

- &lsaquo; Prev‹ Prev
- 1
- [2](/categories/enterprise-monitoring?order=g2_score&page=2#product-list)
- [3](/categories/enterprise-monitoring?order=g2_score&page=3#product-list)
- [4](/categories/enterprise-monitoring?order=g2_score&page=4#product-list)
- [5](/categories/enterprise-monitoring?order=g2_score&page=5#product-list)
- [Next &rsaquo;Next ›](/categories/enterprise-monitoring?order=g2_score&page=2#product-list)

Spotlight Categories

[Marketing Automation Software](https://www.g2.com/categories/marketing-automation)

[ERP Systems](https://www.g2.com/categories/erp-systems)

[Cloud Content Collaboration Software](https://www.g2.com/categories/cloud-content-collaboration)

[Identity Verification Software](https://www.g2.com/categories/identity-verification)

[Live Chat Software](https://www.g2.com/categories/live-chat)

Similar Categories

- [AI Agent Observability](/categories/ai-agent-observability)
- [Application Performance Monitoring (APM)](/categories/application-performance-monitoring-apm)
- [Cloud Infrastructure Monitoring](/categories/cloud-infrastructure-monitoring)
- [Database Monitoring](/categories/database-monitoring)

- [Hardware Monitoring](/categories/hardware-monitoring)
- [Log Monitoring](/categories/log-monitoring)
- [Network Monitoring](/categories/network-monitoring)
- [Observability Pipeline](/categories/observability-pipeline)

- [Observability Software](/categories/observability-software)
- [Other Monitoring](/categories/other-monitoring)
- [Website Monitoring](/categories/website-monitoring)

[Browse Enterprise Monitoring Themes](/categories/enterprise-monitoring/themes)

 ![Tian Lin](/assets/transparent-ad5be28fbcd25b7b08d2cebe1d957125437fb5407d75ee717965ad22c8808791.gif "Tian Lin")
TL

Researched and written by [Tian Lin](https://research.g2.com/insights/author/tian-lin)

Updated April 10, 2026

Enterprise monitoring tools provide a single-pane-of-glass approach to overseeing a broad spectrum of IT systems, enabling businesses to monitor servers, applications, networks, databases, and more through a unified dashboard, generating real-time analytics and alerts to support proactive infrastructure management.

### Core Capabilities of Enterprise Monitoring Software

To qualify for inclusion in the Enterprise Monitoring category, a product must:

- Monitor activity and performance for several IT systems such as servers, databases, and networks
- Generate real-time analytics regarding monitored system activity
- Create and distribute detailed alerts via email, phone, and messaging for potential and active failures and errors
- Offer pre-built and custom reporting and dashboards for quick insights into system states

### Common Use Cases for Enterprise Monitoring Software

Server admins, network admins, and IT engineers use enterprise monitoring tools to maintain visibility and control across complex IT environments. Common use cases include:

- Monitoring multi-system environments including servers, databases, and network infrastructure from a single dashboard
- Setting up real-time alerts for performance degradation, outages, and anomalous activity
- Leveraging observability features, including event metrics, traces, logging, and metadata, to understand system state beyond basic monitoring

### How Enterprise Monitoring Software Differs from Other Tools

Enterprise monitoring solutions sometimes incorporate [machine learning](https://www.g2.com/categories/machine-learning) or [AIOps platform](https://www.g2.com/categories/aiops-platforms) capabilities to enhance standard monitoring with intelligent anomaly detection and predictive insights. Some tools are also extending into observability, going beyond reactive monitoring to provide deeper insight into system behavior through correlated metrics, traces, and logs, a capability more fully realized in dedicated observability platforms.

### Insights from G2 on Enterprise Monitoring Software

Based on category trends on G2, unified multi-system dashboards and customizable alerting stand out as the most valued capabilities. Improved incident detection speed and reduced mean time to awareness (MTTA) stand out as primary benefits of adoption.

Top Tools at a Glance

| Product | Best for | User Review |
| --- | --- | --- |
| [![Product Avatar Image](https://images.g2crowd.com/uploads/product/image/large_detail/large_detail_393746d0cdc8904473bde59b5858158e/datadog.png "Product Avatar Image")](https://www.g2.com/products/datadog/reviews)[Datadog](https://www.g2.com/products/datadog/reviews)[4.4/5(726)](https://www.g2.com/products/datadog/reviews) | Unified logs-metrics-traces for distributed incident triage | "Faster incident detection and root-cause analysis, leading to better customer experience." |
| [![Product Avatar Image](https://images.g2crowd.com/uploads/product/image/large_detail/large_detail_24bb2b0b5af8e7d875ea09d767bcb097/ibm-instana.jpg "Product Avatar Image")](https://www.g2.com/products/ibm-instana/reviews)[IBM Instana](https://www.g2.com/products/ibm-instana/reviews)[4.4/5(480)](https://www.g2.com/products/ibm-instana/reviews) | Zero-instrumentation distributed tracing for microservices observability | "Comprehensive Monitoring, Steep Learning Curve" |
| [![Product Avatar Image](https://images.g2crowd.com/uploads/product/image/large_detail/large_detail_a01e81b6f2792cba2e3bb40b05f0d265/paessler-prtg.jpg "Product Avatar Image")](https://www.g2.com/products/paessler-prtg/reviews)[Paessler PRTG](https://www.g2.com/products/paessler-prtg/reviews)[4.7/5(211)](https://www.g2.com/products/paessler-prtg/reviews) | Sensor-granular infrastructure monitoring with rapid auto-discovery | "Auto-Discovery That Actually Works—Deep Hardware Health via SNMP" |
| [![Product Avatar Image](https://images.g2crowd.com/uploads/product/image/large_detail/large_detail_044cfbf6c03d107e5357e29e95fd9136/dynatrace.png "Product Avatar Image")](https://www.g2.com/products/dynatrace/reviews)[Dynatrace](https://www.g2.com/products/dynatrace/reviews)[4.5/5(1,366)](https://www.g2.com/products/dynatrace/reviews) | AI-driven full-stack root cause analysis | "Comprehensive Observability, Excellent AI, but Complex Pricing" |
| [![Product Avatar Image](https://images.g2crowd.com/uploads/product/image/large_detail/large_detail_85137312b1d3d4846ec7ac7ec4333d41/opmanager-nexus.png "Product Avatar Image")](https://www.g2.com/products/opmanager-nexus/reviews)[OpManager Nexus](https://www.g2.com/products/opmanager-nexus/reviews)[4.6/5(227)](https://www.g2.com/products/opmanager-nexus/reviews) | Cross-infrastructure fault detection with unified NOC visibility | "Centralized NOC Dashboards and Real-Time Monitoring Made Simple" |
| [![Product Avatar Image](https://images.g2crowd.com/uploads/product/image/large_detail/large_detail_5174801a420fbd0562da518311a6ae2a/uptimerobot.png "Product Avatar Image")](https://www.g2.com/products/uptimerobot/reviews)[UptimeRobot](https://www.g2.com/products/uptimerobot/reviews)[4.7/5(300)](https://www.g2.com/products/uptimerobot/reviews) | External service-outage detection with multi-channel alerting | "Simple, Reliable Monitoring with Instant Alerts—A Daily Essential" |
| [![Product Avatar Image](https://images.g2crowd.com/uploads/product/image/large_detail/large_detail_2e92fe012a08dd42922cb07ca7cb955d/netscout-network-application-observability.png "Product Avatar Image")](https://www.g2.com/products/netscout-network-application-observability/reviews)[NETSCOUT Network &...](https://www.g2.com/products/netscout-network-application-observability/reviews)[4.5/5(90)](https://www.g2.com/products/netscout-network-application-observability/reviews) | Packet-level network and application root-cause analysis | "Essential for Real-Time Network Monitoring" |
| [![Product Avatar Image](https://images.g2crowd.com/uploads/product/image/large_detail/large_detail_91bcb2c063fcfb0a82dfedcf1a6463d1/splunk-enterprise.jpg "Product Avatar Image")](https://www.g2.com/products/splunk-enterprise/reviews)[Splunk Enterprise](https://www.g2.com/products/splunk-enterprise/reviews)[4.3/5(434)](https://www.g2.com/products/splunk-enterprise/reviews) | Centralized log correlation for SOC and ITOps | "Excellent Enterprise Observability and Log Management Solution for Hybrid Cloud Infrastructure" |
| [![Product Avatar Image](https://images.g2crowd.com/uploads/product/image/large_detail/large_detail_e302b9439c6c7eaa44ae03a965783362/logicmonitor.png "Product Avatar Image")](https://www.g2.com/products/logicmonitor/reviews)[LogicMonitor](https://www.g2.com/products/logicmonitor/reviews)[4.5/5(644)](https://www.g2.com/products/logicmonitor/reviews) | Extensible agentless monitoring across hybrid infrastructure | "LogicMonitor has cut our MTTR 42% and provided tight ROI." |
| [![Product Avatar Image](https://images.g2crowd.com/uploads/product/image/large_detail/large_detail_24bb2b0b5af8e7d875ea09d767bcb097/ibm-sevone.jpg "Product Avatar Image")](https://www.g2.com/products/ibm-sevone/reviews)[IBM SevOne](https://www.g2.com/products/ibm-sevone/reviews)[4.3/5(72)](https://www.g2.com/products/ibm-sevone/reviews) | High-frequency polling across hybrid network environments | "Real-Time Insights That Empower Network Teams" |

* * *

Show More
