Best Website Monitoring Software

How Many Website Monitoring Software Products Does G2 Track?

Total Products under this Category: 292

Category Stats (Sep 2026)

  • Average Rating: 4.57/5 The average rating of products in this category, based on all submitted ratings
  • Top Trending Product: Dotcom-Monitor (+0.38%) - Among all products in this category, Dotcom-Monitor recorded the largest rating increase compared to last month

Last updated: September 01, 2026

How Does G2 Rank Website Monitoring Software Products?

Why You Can Trust G2's Software Rankings:

  • 30 Analysts and Data Experts
  • 8,900+ Authentic Reviews
  • 292+ Products
  • Unbiased Rankings

G2's software rankings are built on verified user reviews, rigorous moderation, and a consistent research methodology maintained by a team of analysts and data experts. Each product is measured using the same transparent criteria, with no paid placement or vendor influence. While reviews reflect real user experiences, which can be subjective, they offer valuable insight into how software performs in the hands of professionals. Together, these inputs power the G2 Score, a standardized way to compare tools within every category.

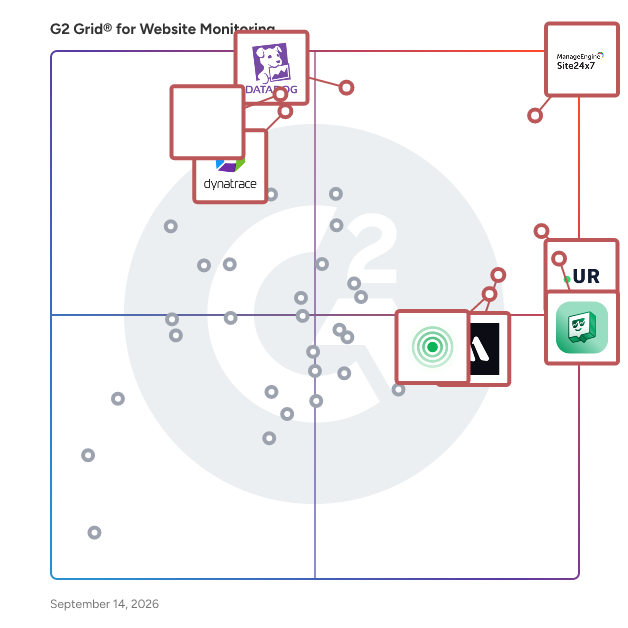
G2 Grid® for Website Monitoring Software

G2 Grid® for Website Monitoring Software plotting products by satisfaction and market presence

Highlighted products: Site24x7, UptimeRobot, Uptime.com, Datadog, Better Stack, Pulsetic, IBM Instana, and Dynatrace.

Underlying data: [Grid® JSON](https://www.g2.com/categories/website-monitoring/grids.json?focus%5B%5D=site24x7&focus%5B%5D=uptimerobot&focus%5B%5D=uptime-com&focus%5B%5D=datadog&focus%5B%5D=better-stack&focus%5B%5D=pulsetic&focus%5B%5D=ibm-instana&focus%5B%5D=dynatrace)

Site24x7

ManageEngine Site24x7 offers unified cloud monitoring for DevOps and IT operations within small to large organizations. The solution monitors the experience of real users accessing websites and applications from desktop and mobile devices. In-depth monitoring capabilities enable DevOps teams to monitor and troubleshoot applications, servers and network infrastructure, including private and public clouds. End-user experience monitoring is done from more than 100 locations across the world and various wireless carriers.

Average Rating: 4.6/5.0

Total Reviews: 463

How Do G2 Users Rate Site24x7?

  • Has the product been a good partner in doing business?: 8.9/10 (Category avg: 9.2/10)
  • Ease of Admin: 8.8/10 (Category avg: 8.9/10)
  • Baseline: 8.9/10 (Category avg: 9.0/10)
  • Reporting: 8.9/10 (Category avg: 8.9/10)

Who Is the Company Behind Site24x7?

  • Seller: Zoho
  • Year Founded: 1996
  • HQ Location: Austin, TX
  • Twitter: @Zoho
    137,880 Twitter followers
  • LinkedIn® Page: www.linkedin.com
    30,913 employees on LinkedIn®
  • Phone: +1 (888) 900-9646

Who Uses This Product?

  • Who Uses This: CEO, IT Manager
  • Top Industries: Information Technology and Services, Computer Software
  • Company Size: 46% Medium, 41% Small

What Do G2 Reviewers Say About Site24x7?

AI-generated summary from verified user reviews

Pros
  • Users appreciate the ease of use of Site24x7, making implementation and daily operations smooth and efficient.
  • Users appreciate the single pane of glass visibility in Site24x7, enhancing efficiency and monitoring flexibility.
  • Users appreciate the real-time monitoring capabilities of Site24x7, providing comprehensive oversight for networks and infrastructure.
  • Users value the extensive monitoring features of Site24x7, enabling efficient oversight of multiple resources from one interface.
  • Users enjoy the extensive visibility of Site24x7, appreciating its ease of setup and efficient monitoring capabilities.
Cons
  • Users face missing alerts and limited interface visibility, hindering their ability to monitor system efficiency effectively.
  • Users find the complexity of tool integration and plan options overwhelming, preferring a simplified default view.
  • Users find the pricing overwhelming and feel it could be more flexible for smaller businesses or startups.
  • Users find the learning curve for advanced features of Site24x7 challenging, impacting effective usage of the platform.
  • Users find the UI lacking modernity, making it difficult to adopt and navigate smoothly.

What Are Recent G2 Reviews of Site24x7?

What Are G2 Users Discussing About Site24x7?

UptimeRobot

The free online uptime monitoring service with an App available for iOS and Android (https://uptimerobot.com). With the Free Plan, you can monitor up to 50 URLs, check for the content of a website (using the keyword monitor), ping your server or monitor your ports in 5-minute intervals. You can create a status page to showcase your uptime. SMS or Call alerts can be bought anytime. Receive notifications via email, phone call, SMS, or integrations like Microsoft Teams, Telegram, Slack, Twitter, Zapier, Pagerduty, Splunk On-Call, Pushbullet, Webhooks, Google Chat, or Pushover. Upgrade to Pro to get more monitors, 1-minute intervals, unlimited status pages that you can customize, share announcements on your status page to which your customers can subscribe and receive them via email. With the Pro Plan, you can monitor SSL certificates or use the Heartbeat monitor to keep an eye on your cron jobs. Adjust and manage your monitoring with maintenance windows or advanced notifications, to avoid getting alerts during maintenance, or to receive notifications after a certain time of downtime.

Average Rating: 4.7/5.0

Total Reviews: 314

How Do G2 Users Rate UptimeRobot?

  • Has the product been a good partner in doing business?: 9.5/10 (Category avg: 9.2/10)
  • Ease of Admin: 9.5/10 (Category avg: 8.9/10)
  • Baseline: 9.2/10 (Category avg: 9.0/10)
  • Reporting: 9.0/10 (Category avg: 8.9/10)

Who Is the Company Behind UptimeRobot?

  • Seller: Uptime Robot
  • Year Founded: 2010
  • HQ Location: Sliema, Malta
  • Twitter: @uptimerobot
    17,426 Twitter followers
  • LinkedIn® Page: www.linkedin.com
    16 employees on LinkedIn®

Who Uses This Product?

  • Who Uses This: CEO, CTO
  • Top Industries: Information Technology and Services, Computer Software
  • Company Size: 72% Small, 18% Medium

What Do G2 Reviewers Say About UptimeRobot?

AI-generated summary from verified user reviews

Pros
  • Users value the immediate notifications from UptimeRobot, enhancing their response time and overall customer service experience.
  • Users love the easy setup of UptimeRobot, enabling quick monitoring without any complicated installations.
  • Users value the real-time monitoring of UptimeRobot, appreciating prompt notifications and user-friendly setup.
  • Users find UptimeRobot to be extremely easy to set up and use, providing timely notifications and a clean interface.
  • Users praise the reliability of UptimeRobot, ensuring proactive monitoring and instant alerts for seamless application performance.
Cons
  • Users are frustrated with inadequate notifications, receiving excessive emails and experiencing delays in alerting system status.
  • Users feel the free plan limitations restrict monitoring capabilities and options compared to competitors, impacting overall satisfaction.
  • Users find the pricing of UptimeRobot expensive, especially with limited free tier and additional costs for notifications.
  • Users are frustrated by the poor UI of UptimeRobot, which complicates navigation and overall user experience.
  • Users find UptimeRobot's limited monitoring capabilities frustrating, especially for internal network parameters and complex needs.

What Are Recent G2 Reviews of UptimeRobot?

What Are G2 Users Discussing About UptimeRobot?

Uptime.com

Uptime.com provides comprehensive, unified visibility into the availability and performance of critical services. Monitoring tools empower engineering, operations and SRE teams to maintain oversight of their web stack and respond to outages through customizable alerting channels. Uptime.com offers a broad set of monitoring capabilities, including web, network, and email. API and transaction checks offer synthetic monitoring to perform multi-step validations of critical flows and services. Monitor public and private resources through a unified interface that streamlines configuration and alerting. Set up and customize Status Pages with your company branding to communicate incidents and maintenance to both customers and internal teams. Provide a single-page overview that shows your overall service health at a glance. Robust and customizable SLA reporting allows stakeholders to stay informed on incidents and downtime. Scheduled Reports send a breakdown of monitoring status at your chosen frequency and timing. Simple & intuitive industry leading Enterprise-grade features delivered at a fair price, that are continuously improving. Used by small and large businesses, Uptime.com's services scale to any organizational size and structure. G2, Sourceforge and TechRadar Pro have recognized Uptime.com as one of the world’s best uptime monitors for several consecutive years, including current awards.

Average Rating: 4.6/5.0

Total Reviews: 388

How Do G2 Users Rate Uptime.com?

  • Has the product been a good partner in doing business?: 9.3/10 (Category avg: 9.2/10)
  • Ease of Admin: 9.0/10 (Category avg: 8.9/10)
  • Baseline: 9.0/10 (Category avg: 9.0/10)
  • Reporting: 8.8/10 (Category avg: 8.9/10)

Who Is the Company Behind Uptime.com?

  • Seller: Uptime.com
  • Company Website:
  • Year Founded: 2013
  • HQ Location: Longboat Key, Florida
  • Twitter: @UptimeDotCom
    1,244 Twitter followers
  • LinkedIn® Page: www.linkedin.com
    22 employees on LinkedIn®

Who Uses This Product?

  • Who Uses This: CTO, Software Engineer
  • Top Industries: Information Technology and Services, Computer Software
  • Company Size: 40% Medium, 37% Small

What Do G2 Reviewers Say About Uptime.com?

AI-generated summary from verified user reviews

Pros
  • Users find Uptime.com to have a user-friendly interface, making integration and setup effortless and efficient.
  • Users value the easy setup of Uptime.com, allowing quick onboarding and effective monitoring without technical hurdles.
  • Users value the reliable and timely notifications from Uptime.com, enhancing operational efficiency and responsiveness.
  • Users value the real-time monitoring capabilities of Uptime.com, ensuring system health and timely notifications for connectivity issues.
  • Users appreciate the real-time monitoring features of Uptime.com, ensuring optimal performance of their systems effectively.
Cons
  • Users find the complex configuration process cumbersome, impacting efficiency and overall user satisfaction.
  • Users feel that Uptime.com can be too expensive for small businesses, making budgeting a challenge.
  • Users report significant notification issues with Uptime.com, including false alerts and limited customization options affecting efficiency.
  • Users face challenges with inadequate notifications, as alerts can be inaccurate and lack flexibility, disrupting workflows.
  • Users find the difficult setup for SSL monitoring and lack of Android support frustrating and time-consuming.

What Are Recent G2 Reviews of Uptime.com?

What Are G2 Users Discussing About Uptime.com?

Datadog

Datadog is the monitoring, security and analytics platform for developers, IT operations teams, security engineers and business users in the cloud age. The SaaS platform integrates and automates infrastructure monitoring, application performance monitoring and log management to provide unified, real-time observability of our customers' entire technology stack. Datadog is used by organizations of all sizes and across a wide range of industries to enable digital transformation and cloud migration, drive collaboration among development, operations, security and business teams, accelerate time to market for applications, reduce time to problem resolution, secure applications and infrastructure, understand user behavior and track key business metrics.

Average Rating: 4.4/5.0

Total Reviews: 715

How Do G2 Users Rate Datadog?

  • Has the product been a good partner in doing business?: 8.5/10 (Category avg: 9.2/10)
  • Ease of Admin: 8.4/10 (Category avg: 8.9/10)
  • Baseline: 8.7/10 (Category avg: 9.0/10)
  • Reporting: 8.8/10 (Category avg: 8.9/10)

Who Is the Company Behind Datadog?

  • Seller: Datadog
  • Company Website:
  • Year Founded: 2010
  • HQ Location: New York
  • Twitter: @datadoghq
    51,207 Twitter followers
  • LinkedIn® Page: www.linkedin.com
    10,780 employees on LinkedIn®

Who Uses This Product?

  • Who Uses This: Software Engineer, DevOps Engineer
  • Top Industries: Information Technology and Services, Computer Software
  • Company Size: 47% Medium, 34% Large

What Do G2 Reviewers Say About Datadog?

AI-generated summary from verified user reviews

Pros
  • Users appreciate the ease of use of Datadog, enjoying intuitive dashboard creation and straightforward implementation.
  • Users appreciate the intuitive monitoring features of Datadog, enabling easy integration and insightful data analysis.
  • Users value the real-time monitoring capabilities of Datadog, enhancing oversight across various applications and infrastructures.
  • Users appreciate the user-friendly interface and robust integration capabilities of Datadog for effective monitoring.
  • Users value the intuitive dashboard creation in Datadog, which enhances monitoring and analysis efficiency.
Cons
  • Users find Datadog's pricing to be expensive, suggesting it should be more affordable given its features.
  • Users find pricing issues with Datadog, citing rapidly escalating costs and high subscription fees as concerns.
  • Users find the steep learning curve challenging, especially with rapidly evolving features and required knowledge.
  • Users find the costs to be unpredictable and excessively high, especially with data storage and additional features.
  • Users find learning difficulty in Datadog, noting that new users may require training to understand its complexities.

What Are Recent G2 Reviews of Datadog?

What Are G2 Users Discussing About Datadog?

Better Stack

Better Stack is an eBPF-based, AI SRE observability tool. It helps engineers ship high-quality software faster and be the hero of their engineering teams.

Average Rating: 4.8/5.0

Total Reviews: 341

How Do G2 Users Rate Better Stack?

  • Has the product been a good partner in doing business?: 9.5/10 (Category avg: 9.2/10)
  • Ease of Admin: 9.6/10 (Category avg: 8.9/10)
  • Baseline: 9.4/10 (Category avg: 9.0/10)
  • Reporting: 9.3/10 (Category avg: 8.9/10)

Who Is the Company Behind Better Stack?

  • Seller: Better Stack
  • Year Founded: 2021
  • HQ Location: San Francisco, CA
  • Twitter: @BetterStackHQ
    10,698 Twitter followers
  • LinkedIn® Page: www.linkedin.com
    27 employees on LinkedIn®

Who Uses This Product?

  • Who Uses This: CEO, Founder
  • Top Industries: Computer Software, Information Technology and Services
  • Company Size: 88% Small, 8% Medium

What Do G2 Reviewers Say About Better Stack?

AI-generated summary from verified user reviews

Pros
  • Users love the ease of use of Better Stack, praising its simple setup and excellent integration capabilities.
  • Users commend the easy setup of Better Stack, emphasizing its straightforward implementation and user-friendly interface.
  • Users praise the excellent user interface of Better Stack, which enhances workflow and simplifies monitoring tasks.
  • Users find the setup ease of Better Stack remarkable, achieving quick configurations and monitoring within minutes.
  • Users value the independent alerting system of Better Stack, ensuring timely notifications even during downtime for proactive responses.
Cons
  • Users find Better Stack's pricing expensive after exceeding free tier limits, affecting scalability for larger projects.
  • Users express frustration over the lack of features in Better Stack, such as missing integrations and limited site management.
  • Users note pricing issues with Better Stack, especially after exceeding free tier limits, making advanced features costly.
  • Users find the limited features in Better Stack may restrict growth and flexibility for larger projects.
  • Users find the log management process challenging and experience inconsistencies with the UI and data aggregation.

What Are Recent G2 Reviews of Better Stack?

What Are G2 Users Discussing About Better Stack?

Pulsetic

Pulsetic is a comprehensive website uptime monitoring solution that enables businesses to safeguard their online operations and maintain customer trust. The service delivers real-time browser monitoring and alerts via multiple channels, including phone call, SMS, email, and Slack, ensuring that website downtime is immediately identified and addressed. Additionally, Pulsetic features customizable status pages that provide transparent and up-to-date information to customers regarding website incidents, as well as status badges that allow for easy, on-demand status checks without the need to navigate away from the current page.

Average Rating: 4.8/5.0

Total Reviews: 222

How Do G2 Users Rate Pulsetic?

  • Has the product been a good partner in doing business?: 9.7/10 (Category avg: 9.2/10)
  • Ease of Admin: 9.5/10 (Category avg: 8.9/10)
  • Baseline: 9.5/10 (Category avg: 9.0/10)
  • Reporting: 9.3/10 (Category avg: 8.9/10)

Who Is the Company Behind Pulsetic?

  • Seller: Pulsetic
  • HQ Location: N/A
  • Twitter: @getpulsetic
    143 Twitter followers
  • LinkedIn® Page: www.linkedin.com
    1 employees on LinkedIn®

Who Uses This Product?

  • Who Uses This: Owner, Founder
  • Top Industries: Information Technology and Services, Computer Software
  • Company Size: 85% Small, 9% Medium

What Do G2 Reviewers Say About Pulsetic?

AI-generated summary from verified user reviews

Pros
  • Users appreciate the ease of use of Pulsetic, making it accessible and user-friendly for everyone.
  • Users commend the easy-to-use monitoring services of Pulsetic, ensuring reliable website performance and uptime tracking.
  • Users find the easy setup of Pulsetic enhances their experience, facilitating a smooth transition and effective monitoring.
  • Users value the automated downtime notifications from Pulsetic, enabling quick responses to uptime issues effortlessly.
  • Users value the reliable notifications from Pulsetic, ensuring prompt awareness of website downtime for effective management.
Cons
  • Users find the pricing model inflexible and desire better organization and a more user-friendly interface.
  • Users struggle with monitoring issues like inability to track GRPC endpoints and inadequate API documentation.
  • Users find the limited free services restrictive, wishing for more monitoring options and flexibility before upgrading.
  • Users find the pricing model expensive and inflexible, making access for teams a challenge for some budgets.
  • Users express concerns over the poor mobile compatibility of Pulsetic, lacking a dedicated mobile app for convenience.

What Are Recent G2 Reviews of Pulsetic?

IBM Instana

IBM Instana, now part of the Concert platform, discovers and maps all services, infrastructure, and their inter-dependencies automatically. Instana ingests all observability metrics, traces each request, profiles every process, and updates application dependency maps in real-time to deliver the context and actionable feedback needed by DevOps to optimize application performance, enable innovation and mitigate risk to help them add value and efficiency to the pipeline. IBM Instana is available on AWS Marketplace.

Average Rating: 4.4/5.0

Total Reviews: 468

How Do G2 Users Rate IBM Instana?

  • Has the product been a good partner in doing business?: 8.5/10 (Category avg: 9.2/10)
  • Ease of Admin: 8.3/10 (Category avg: 8.9/10)
  • Baseline: 9.2/10 (Category avg: 9.0/10)
  • Reporting: 9.2/10 (Category avg: 8.9/10)

Who Is the Company Behind IBM Instana?

  • Seller: IBM
  • Company Website:
  • Year Founded: 1911
  • HQ Location: Armonk, New York, United States
  • Twitter: @IBMSecurity
    74,660 Twitter followers
  • LinkedIn® Page: www.linkedin.com
    344,328 employees on LinkedIn®

Who Uses This Product?

  • Who Uses This: Software Engineer, System Engineer
  • Top Industries: Information Technology and Services, Computer Software
  • Company Size: 40% Medium, 36% Large

What Do G2 Reviewers Say About IBM Instana?

AI-generated summary from verified user reviews

Pros
  • Users value the ease of use of IBM Instana, which simplifies app tracking and enhances performance analysis.
  • Users value the fast and comprehensive monitoring capabilities of IBM Instana, ensuring robust protection across all environments.
  • Users value the real-time monitoring of IBM Instana, appreciating its ease of use and robust dashboard features.
  • Users value the fast and effective monitoring capabilities of IBM Instana, ensuring comprehensive system protection and anomaly detection.
  • Users highlight the effortless setup of IBM Instana, enabling seamless monitoring of complex applications without manual configuration.
Cons
  • Users express that the pricing can accumulate quickly as their environments grow, making it a significant concern.
  • Users find the user interface complex, leading to a steeper learning curve and affecting overall usability.
  • Users find the learning curve challenging, particularly for new team members navigating the complex interface and features.
  • Users find the difficult learning curve of IBM Instana challenging, hindering quick adaptation and efficient use of the tool.
  • Many users find the pricing structure of IBM Instana to be expensive, particularly for smaller teams and startups.

What Are Recent G2 Reviews of IBM Instana?

What Are G2 Users Discussing About IBM Instana?

Dynatrace

Dynatrace is advancing observability for today’s digital businesses, helping to transform the complexity of modern digital ecosystems into powerful business assets. By leveraging AI-powered insights, Dynatrace enables organizations to analyze, automate, and innovate faster to drive their business forward. To learn more about how Dynatrace can help your business, visit www.dynatrace.com, visit our blog and follow us on LinkedIn and X @dynatrace.

Average Rating: 4.5/5.0

Total Reviews: 1,236

How Do G2 Users Rate Dynatrace?

  • Has the product been a good partner in doing business?: 8.7/10 (Category avg: 9.2/10)
  • Ease of Admin: 8.2/10 (Category avg: 8.9/10)
  • Baseline: 8.8/10 (Category avg: 9.0/10)
  • Reporting: 8.0/10 (Category avg: 8.9/10)

Who Is the Company Behind Dynatrace?

  • Seller: Dynatrace
  • Year Founded: 2005
  • HQ Location: Boston, MA
  • Twitter: @Dynatrace
    18,668 Twitter followers
  • LinkedIn® Page: www.linkedin.com
    6,181 employees on LinkedIn®
  • Ownership: NYSE: DT

Who Uses This Product?

  • Who Uses This: Software Engineer, Senior Software Engineer
  • Top Industries: Information Technology and Services, Financial Services
  • Company Size: 69% Large, 23% Medium

What Do G2 Reviewers Say About Dynatrace?

AI-generated summary from verified user reviews

Pros
  • Users appreciate the ease of use of Dynatrace, enjoying seamless application instrumentation and comprehensive support.
  • Users value the insightful dashboarding of Dynatrace, enhancing executive views and simplifying monitoring processes.
  • Users value the comprehensive monitoring capabilities of Dynatrace, enhancing problem identification and prevention effectively.
  • Users value the effective debugging capabilities of Dynatrace, enhancing their ability to identify and resolve issues promptly.
  • Users value the robust analytics and integration features of Dynatrace, enhancing their monitoring and debugging capabilities.
Cons
  • Users find the steep learning curve of Dynatrace challenging, making it hard to fully utilize its features.
  • Users find that missing features in Dynatrace hinder detailed analysis and communication regarding updates and fixes.
  • Users find Dynatrace's complexity overwhelming, with a steep learning curve and costly pricing affecting usability.
  • Users find the learning difficulty challenging due to overwhelming information and inconsistencies in functionality.
  • Users find the costly nature of Dynatrace challenging, making it more suitable for large enterprises only.

What Are Recent G2 Reviews of Dynatrace?

What Are G2 Users Discussing About Dynatrace?

Freshping by Freshworks

Reliable & FREE FOREVER uptime and performance monitoring tool for startups, SMB's, Bloggers, Managed Service providers (MSPs) and DevOps communities. 50 Monitors, 1-minute interval, Public status pages, Multi-user login (30 users), Slack/SMS/Email alerts - FREE FOREVER

Average Rating: 4.6/5.0

Total Reviews: 949

How Do G2 Users Rate Freshping by Freshworks?

  • Has the product been a good partner in doing business?: 9.2/10 (Category avg: 9.2/10)
  • Ease of Admin: 9.3/10 (Category avg: 8.9/10)
  • Baseline: 9.1/10 (Category avg: 9.0/10)
  • Reporting: 9.0/10 (Category avg: 8.9/10)

Who Is the Company Behind Freshping by Freshworks?

  • Seller: Freshworks
  • Year Founded: 2010
  • HQ Location: San Mateo, CA
  • Twitter: @FreshworksInc
    19,020 Twitter followers
  • LinkedIn® Page: www.linkedin.com
    7,783 employees on LinkedIn®
  • Ownership: NASDAQ: FRSH

Who Uses This Product?

  • Who Uses This: CEO, Founder
  • Top Industries: Information Technology and Services, Computer Software
  • Company Size: 80% Small, 16% Medium

What Are Recent G2 Reviews of Freshping by Freshworks?

Sentry

Sentry is an application monitoring and error tracking platform that helps developers identify, debug, and resolve software issues in production environments across web, mobile, desktop, game, and AI-powered applications. The platform captures errors, crashes, and performance problems in real time, providing developers with stack traces, user context, and diagnostic data needed to reproduce and fix bugs. Sentry supports over 100 programming languages and frameworks, including JavaScript, Python, Java, Ruby, PHP, Go, React, Django, and mobile platforms like iOS and Android. Core monitoring capabilities: - Error tracking groups similar errors into issues, showing frequency, affected users, and the exact code location where problems occur - Performance monitoring traces requests through distributed systems to identify slow database queries, API bottlenecks, and code-level performance problems - Session Replay records user interactions leading up to errors, capturing clicks, network activity, and console logs for easier reproduction - Logs captures structured log data from your applications alongside errors and traces, enabling search and filtering by message content, severity level, and custom attributes - AI observability provides visibility into LLM applications, AI agents, and Model Context Protocol servers, tracking prompts, model calls, tool usage, and token consumption Developers integrate Sentry by installing an SDK and adding a few lines of code to their application. The platform automatically captures unhandled exceptions, while developers can manually track custom errors and performance metrics. Sentry processes events in real time, sending alerts through Slack, email, PagerDuty, or other notification channels when issues occur. Additional features and capabilities: - AI-powered debugging through Seer, which analyzes errors to identify root causes and suggest code fixes with high accuracy - Distributed tracing that follows requests across microservices, serverless functions, and third-party APIs to pinpoint failure points - Custom dashboards and alerts for monitoring specific metrics, error rates, or performance thresholds important to each team - Profiling tools that provide code-level visibility into where time is being spent in production, identifying slow functions, call stacks, and performance regressions across backend services and frontend/mobile user flows - Workflow integrations with GitHub, Jira, GitLab, Azure DevOps, and other development tools to create tickets or link errors to commits automatically The platform serves development teams at organizations ranging from individual developers to large enterprises. More than 100,000 organizations use Sentry, processing billions of error events daily. Sentry offers both cloud-hosted and self-hosted deployment options, with pricing tiers based on event volume. A free tier supports small projects and individual developers.

Average Rating: 4.5/5.0

Total Reviews: 224

How Do G2 Users Rate Sentry?

  • Has the product been a good partner in doing business?: 9.1/10 (Category avg: 9.2/10)
  • Ease of Admin: 8.8/10 (Category avg: 8.9/10)
  • Baseline: 7.8/10 (Category avg: 9.0/10)
  • Reporting: 9.1/10 (Category avg: 8.9/10)

Who Is the Company Behind Sentry?

  • Seller: Sentry
  • Company Website:
  • Year Founded: 2011
  • HQ Location: San Francisco, CA
  • Twitter: @getsentry
    295 Twitter followers
  • LinkedIn® Page: www.linkedin.com
    448 employees on LinkedIn®

Who Uses This Product?

  • Who Uses This: Software Engineer, Senior Software Engineer
  • Top Industries: Computer Software, Information Technology and Services
  • Company Size: 60% Small, 29% Medium

What Do G2 Reviewers Say About Sentry?

AI-generated summary from verified user reviews

Pros
  • Users appreciate the ease of use of Sentry, allowing quick implementation and straightforward monitoring of applications.
  • Users value the insightful error tracking of Sentry, enabling quicker issue resolution and improved application observability.
  • Users find Sentry's monitoring features indispensable, offering versatility in observability and easy application monitoring.
  • Users appreciate the easy setup of Sentry, enabling quick implementation and efficient error monitoring across projects.
  • Users value the real-time error tracking and detailed bug insights, enhancing team collaboration and issue resolution significantly.
Cons
  • Users find Sentry's pricing issues challenging, especially with limited plan options and frequent budget increases.
  • Users find Sentry expensive, particularly for small projects, with limited plan options and high entry costs.
  • Users experience frequent error budget exhaustion requiring constant adjustments, leading to monitoring challenges and unexpected failures.
  • Users find the UI to be complex and disorganized, particularly challenging for first-time users.
  • Users find the complex configuration of Sentry challenging, particularly during the initial setup and integration process.

What Are Recent G2 Reviews of Sentry?

What Are G2 Users Discussing About Sentry?

Elastic Observability

OpenTelemetry-native observability for fast, AI-driven root cause analysis Search, analyze, and act with logs, metrics, and traces. SRE leaders aim to proactively prevent downtime, simplify tool stacks, and reduce toil, but multi-cloud complexity and fragmented toolsets create visibility gaps that make it hard to stay ahead. OTel-native and AI-powered, Elastic Observability ingests and correlates petabytes of telemetry across your applications, services, and infrastructure, in real-time. Accelerate troubleshooting with built-in agentic workflows and an AI Assistant that goes well beyond chat to bolster team expertise and guide investigations, grounded with context from your organizational knowledge-bases. More data, more problems? Not anymore. Most observability and logging solutions weren’t built for today’s scale. Elastic is. Our architecture is designed to handle petabytes of logs with indexing, compression, and efficient searchable storage so you can keep all the telemetry you need, without breaking the bank. Store more, spend less, and resolve issues faster with a scalable, open, and extensible platform that unifies visibility across your entire environment.

Average Rating: 4.3/5.0

Total Reviews: 103

How Do G2 Users Rate Elastic Observability?

  • Has the product been a good partner in doing business?: 8.3/10 (Category avg: 9.2/10)
  • Ease of Admin: 7.3/10 (Category avg: 8.9/10)
  • Baseline: 7.5/10 (Category avg: 9.0/10)
  • Reporting: 9.2/10 (Category avg: 8.9/10)

Who Is the Company Behind Elastic Observability?

  • Seller: Elastic
  • Company Website:
  • Year Founded: 2012
  • HQ Location: San Francisco, CA
  • Twitter: @elastic
    65,200 Twitter followers
  • LinkedIn® Page: www.linkedin.com
    10,457 employees on LinkedIn®

Who Uses This Product?

  • Who Uses This: Software Engineer, Senior Software Engineer
  • Top Industries: Information Technology and Services, Computer Software
  • Company Size: 50% Large, 43% Medium

What Do G2 Reviewers Say About Elastic Observability?

AI-generated summary from verified user reviews

Pros
  • Users find Elastic Observability to be intuitively easy to use, facilitating effortless integration and quick setup for various needs.
  • Users value the real-time alerting capabilities of Elastic Observability, enhancing proactive monitoring and issue resolution.
  • Users value the excellent log collection and monitoring capabilities of Elastic Observability for efficient server management.
  • Users appreciate the excellent monitoring capabilities of Elastic Observability for comprehensive insights into their applications and infrastructure.
  • Users value the flexibility and unified view of Elastic Observability, enhancing troubleshooting and operational visibility.
Cons
  • Users face a steep learning curve with Elastic Observability, requiring extensive knowledge and training for effective use.
  • Users find the difficult learning curve for Elastic Observability challenging, particularly for teams unfamiliar with the Elastic Stack.
  • Users struggle with the lack of log integration and find log generation with APM challenging without ELK knowledge.
  • Users find the learning difficulty frustrating, particularly due to overwhelming logs and advanced feature navigation.
  • Users struggle with log management issues, from hardware corruption to lack of integration with existing log files.

What Are Recent G2 Reviews of Elastic Observability?

What Are G2 Users Discussing About Elastic Observability?

Dash0

Dash0 closes the loop from code to production in the AI era. Built natively on OpenTelemetry, Dash0 tracks what AI builds, observes everything running in production, and fixes problems autonomously, all powered by a single, OpenTelemetry native data foundation. Dash0 helps engineering teams ship more and break less in a world where code moves at machine speed.

Average Rating: 4.8/5.0

Total Reviews: 43

How Do G2 Users Rate Dash0?

  • Has the product been a good partner in doing business?: 9.9/10 (Category avg: 9.2/10)
  • Ease of Admin: 9.2/10 (Category avg: 8.9/10)
  • Baseline: 9.2/10 (Category avg: 9.0/10)
  • Reporting: 8.8/10 (Category avg: 8.9/10)

Who Is the Company Behind Dash0?

  • Seller: Dash0
  • Company Website:
  • Year Founded: 2023
  • HQ Location: New York
  • Twitter: @dash0hq
    2,320 Twitter followers
  • LinkedIn® Page: www.linkedin.com
    226 employees on LinkedIn®

Who Uses This Product?

  • Top Industries: Computer Software, Information Technology and Services
  • Company Size: 51% Small, 30% Medium

What Do G2 Reviewers Say About Dash0?

AI-generated summary from verified user reviews

Pros
  • Users find Dash0's ease of use exceptional, with intuitive features and straightforward setup for quick integration.
  • Users love Dash0's responsive customer support, finding the team's assistance crucial for a smooth experience.
  • Users value Dash0's intuitive UI/UX, appreciating its seamless integration and efficient observability features.
  • Users find the easy setup of Dash0 allows for quick integration and seamless data management in Kubernetes.
  • Users appreciate the easy integrations of Dash0, enabling seamless setup and fast transition from existing systems.
Cons
  • Users have noted limited features in Dash0, with many advanced tools still not available for use.
  • Users have experienced feature deficiencies with Dash0, though updates have improved functionality over time.
  • Users note the missing features in Dash0, expressing a desire for enhanced functionality and additional integrations.
  • Users face limited customization options with Dash0, impacting mobile usability and dashboard functionality.
  • Users note feature limitations in Dash0, seeking expanded capabilities and enhanced integrations for improved functionality.

What Are Recent G2 Reviews of Dash0?

Xurrent IMR

Xurrent IMR (Incident Management and Response) is an end-to-end platform designed to help infrastructure and support teams manage the full incident response lifecycle — from the first alert to the final post-mortem. Built for speed, clarity, and operational accountability, it gives on-call teams the structure they need to respond decisively when systems fail. At its core, Xurrent IMR brings together alert correlation, on-call scheduling, task delegation, and SLA compliance into a single, unified workflow. Rather than stitching together multiple point solutions, teams get a coherent system that handles every stage of incident response without context-switching. Key capabilities include: Intelligent alert routing and correlation: Custom routing rules and alert context surface the right information at the right time, helping teams accelerate root cause analysis and reduce noise. On-call management with escalation policies: Fully customizable schedules and escalation chains ensure incidents are acknowledged and resolved within SLA thresholds, with no gaps in coverage. Incident roles, task templates, and playbooks: Structured delegation frameworks reduce chaos during high-severity events, ensuring every team member knows their responsibilities before an incident strikes. Response automation: Automated workflows enable self-healing system behaviors, reducing mean time to resolution and minimizing manual intervention for recurring failure patterns. Advanced analytics and reporting: Team, service, and user-level reporting gives engineering and operations leaders the visibility to measure performance, identify gaps, and continuously improve. Xurrent IMR integrates with 150+ monitoring, observability, and ticketing tools — including Datadog, Prometheus, PagerDuty, Splunk, Jira, ServiceNow, Grafana, New Relic, and AWS CloudWatch — making it compatible with the stacks modern infrastructure teams already rely on. Whether managing a distributed engineering organization or a lean operations team, Xurrent IMR provides the coordination layer that turns reactive firefighting into a repeatable, measurable discipline.

Average Rating: 4.5/5.0

Total Reviews: 194

How Do G2 Users Rate Xurrent IMR?

  • Has the product been a good partner in doing business?: 9.4/10 (Category avg: 9.2/10)
  • Ease of Admin: 9.1/10 (Category avg: 8.9/10)
  • Baseline: 10.0/10 (Category avg: 9.0/10)
  • Reporting: 10.0/10 (Category avg: 8.9/10)

Who Is the Company Behind Xurrent IMR?

  • Seller: Xurrent
  • Company Website:
  • Year Founded: 2010
  • HQ Location: Santa Barbara, US
  • Twitter: @4me
    250 Twitter followers
  • LinkedIn® Page: www.linkedin.com
    176 employees on LinkedIn®

Who Uses This Product?

  • Who Uses This: Software Engineer, Senior Software Engineer
  • Top Industries: Computer Software, Information Technology and Services
  • Company Size: 49% Medium, 27% Small

What Do G2 Reviewers Say About Xurrent IMR?

AI-generated summary from verified user reviews

Pros
  • Users value the ease of use of Xurrent IMR, noting its simple implementation and user-friendly interface.
  • Users appreciate the easy handling of alerts in Xurrent IMR, enhancing notification management and communication seamlessly.
  • Users value the seamless integrations Xurrent IMR offers, enhancing their systems and improving overall efficiency.
  • Users praise the quick and helpful customer support of Xurrent IMR, enhancing their overall experience significantly.
  • Users love the smooth and intuitive UI of Xurrent IMR, making it easy for beginners to navigate.
Cons
  • Users find the missing features in Xurrent IMR limit its functionality and hinder effective incident management.
  • Users often face notification issues with Xurrent IMR, leading to missed updates and confusion during on-call swaps.
  • Users face scheduling issues with Xurrent IMR due to non-intuitive UI and complicated access for team collaboration.
  • Users find the learning curve steep for Zenduty, especially those new to incident management and its terminology.
  • Users note feature issues with Xurrent IMR, including navigation challenges and the need for enhanced automation and reporting.

What Are Recent G2 Reviews of Xurrent IMR?

What Are G2 Users Discussing About Xurrent IMR?

Checkmk

Checkmk is a full-stack monitoring and observability platform designed to provide unified visibility into hybrid IT infrastructures. With more than 2,000 built-in integrations, it offers broad coverage across networks, servers, cloud workloads, Kubernetes and applications. The platform is highly automated, featuring auto-discovery of hosts and services and rule-based configuration to reduce manual setup. It is highly scalable, capable of efficiently monitoring thousands of hosts and millions of services. A central web-based interface allows users to manage configuration, visualize data with customizable dashboards, and track system performance over time. Checkmk is available as packages for all common Linux distributions, as a virtual or physical appliance, through AWS and Azure Marketplace images, or as SaaS. Checkmk is available in four editions: Checkmk Community offers free and open source monitoring for small infrastructures. Checkmk Pro allows for monitoring at speed and scale for data center infrastructures. Checkmk Ultimate offers full-stack observability for hybrid and cloud-native infrastructures which is also available with multi-tenancy and data segregation to support security and compliance. And Checkmk Cloud for full-stack observability for hybrid and cloud-native infrastructures in a SaaS platform. Available extensions include synthetic monitoring and OpenTelemetry for application monitoring. The Checkmk Relay enables secure data collection for segmented networks using outbound-only communication, supporting fully air-gapped and zero-inbound monitoring deployments. Checkmk supports integration with ITSM tools and third-party platforms, enabling automatic ticket creation and consistent alerting. Features such as forecasting, capacity planning, and asset inventory as well as lifecycle management and auto-registration help teams manage dynamic IT environments. Monitoring capabilities: - Monitoring of hybrid infrastructures: cloud, on-premises, virtual, and container environments. - 2000+ built-in integrations networks, servers, cloud workloads, Kubernetes and applications out-of-the-box dashboards provide key metrics for AWS and Azure environments, Linux and Windows servers, and Kubernetes clusters. - Automated discovery and configuration. - Alerting with native ITSM integrations. Operational benefits: - Provides insights into system health, capacity trends, and future resource needs through built-in assessments and forecasting tools. - Reduces manual effort with auto-discovery, rule-based configuration, and centralized agent management as well as auto-registration and host lifecycle management. - Accelerates incident response time by using custom self-healing workflows via the ‘Alert Handler’. - Allows creation of tailored dashboards and views to focus on the most relevant metrics for each team. - Maintains an up-to-date inventory of hardware and software assets, enriched with live monitoring data. - Supports distributed monitoring and can handle massive amounts of data. Why choose Checkmk? - Cost Efficiency: Transparent pricing model with a strong price-performance ratio - Security: Meets stringent security requirements, including fully air-gapped deployments and zero-inbound monitoring. - Visibility: Delivers broad and deep visibility with flexible deployment options. - Scalability: Scales efficiently to support large, distributed environments with high host and service counts. - Extensibility: Supports custom plug-ins, integrations, synthetic monitoring to monitor you applications from the user’s perspective and OpenTelemetry for application monitoring. Customers include: Adobe, Cloudera, Fujitsu, Siemens, Orange, VW, HP, Zalando, Fitbit, NEC, Continental, NHL, Capgemini, Sixt, Intesa SanPaolo

Average Rating: 4.7/5.0

Total Reviews: 295

How Do G2 Users Rate Checkmk?

  • Has the product been a good partner in doing business?: 9.0/10 (Category avg: 9.2/10)
  • Ease of Admin: 8.2/10 (Category avg: 8.9/10)
  • Baseline: 8.3/10 (Category avg: 9.0/10)
  • Reporting: 7.6/10 (Category avg: 8.9/10)

Who Is the Company Behind Checkmk?

  • Seller: Checkmk
  • Company Website:
  • Year Founded: 2007
  • HQ Location: Munich, DE
  • Twitter: @checkmk
    1,755 Twitter followers
  • LinkedIn® Page: www.linkedin.com
    232 employees on LinkedIn®

Who Uses This Product?

  • Who Uses This: IT Engineer, Systemadministrator
  • Top Industries: Information Technology and Services, Computer & Network Security
  • Company Size: 42% Medium, 40% Large

What Do G2 Reviewers Say About Checkmk?

AI-generated summary from verified user reviews

Pros
  • Users appreciate the ease of use of Checkmk, finding it quick to deploy and well-documented.
  • Users commend Checkmk for its flexibility and powerful monitoring capabilities, effectively managing diverse IT infrastructures.
  • Users appreciate the comprehensive monitoring capabilities of Checkmk, enabling effective oversight of diverse IT environments.
  • Users value the flexibility and customization of Checkmk, making it a powerful solution tailored to their needs.
  • Users value Checkmk for its real-time monitoring capabilities, allowing efficient oversight of diverse systems and applications.
Cons
  • Users find the steep learning curve challenging, making onboarding difficult for non-regular users and complicating their experience.
  • Users find difficult learning due to complex customization and limited data insights in Checkmk, affecting usability.
  • Users find the configuration process overly complex, especially during onboarding for new and non-regular users.
  • Users find the learning difficulty steep due to complex configurations and lacking intuitive documentation for advanced features.
  • Users find the complex setup of Checkmk challenging, especially for newcomers unfamiliar with the system.

What Are Recent G2 Reviews of Checkmk?

What Are G2 Users Discussing About Checkmk?

Dotcom-Monitor

Dotcom-Monitor is a synthetic monitoring platform built around web application monitoring, using real-browser testing to confirm that websites, web applications, and APIs work correctly for actual users. Founded in 1998 and based in Minnesota, it runs checks continuously from more than 30 locations across 6 continents, combining outside-in visibility with private, behind-the-firewall monitoring in one platform. Web application monitoring is the core. The EveryStep Web Recorder captures multi-step user journeys without coding, so teams can monitor login, search, cart, and checkout flows the way customers experience them. Scripts run in real browsers with full JavaScript rendering, validating dynamic content and single-page applications, not just whether a home page responds. Page-load waterfalls, element-level timing, and performance reports show where a transaction slows down or breaks, and screenshots and video capture the exact failure for faster diagnosis. API monitoring covers REST, SOAP, and GraphQL endpoints, along with imported Postman and Insomnia collections. Multi-step API workflows chain requests and pass dynamic data between calls, while response checks validate JSON and XML payloads using JSONPath and XPath. Authenticated monitoring supports OAuth 2.0, JWT, API keys, Basic Auth, mTLS, AWS Signature, NTLM, and Kerberos, so protected and production-grade APIs can be tested end to end. Monitoring can also be created and controlled through a REST API, so checks run inside CI/CD pipelines and gate releases before deployment. Server, infrastructure, and network monitoring round out the platform. Checks cover HTTP and HTTPS, DNS resolution and record validation, SSL certificate validity and expiration, email services (SMTP, POP3, IMAP), FTP and FTPS, TCP ports, WebSocket connections, SIP and VoIP systems, and streaming media. Uptime monitoring verifies availability from multiple locations and confirms failures from more than one site before alerting, which reduces false positives. Private Agents extend the same checks inside data centers, private networks, and staging or pre-production environments, so internal applications and services behind the firewall receive the same coverage as public endpoints, using outbound HTTPS without inbound firewall changes. Results surface in real-time dashboards, historical performance reports, and waterfall charts, and alerts route to Slack, Microsoft Teams, PagerDuty, Opsgenie, ServiceNow, VictorOps, xMatters, email, SMS, phone, and webhooks. Escalation policies, on-call schedules, and maintenance windows keep notifications targeted, and acknowledgment and resolution tracking keep incident state clear. Common use cases include verifying login and authentication, validating e-commerce checkout and payment flows, tracking SaaS application performance, monitoring API endpoints against service-level targets, preventing SSL certificate expirations, and detecting DNS resolution problems early. The platform is often run as a primary synthetic monitoring system and as a complement to observability tools, confirming that applications behave correctly from the end-user perspective rather than only that infrastructure is healthy. Dotcom-Monitor serves DevOps, site reliability, platform, and IT operations teams, along with QA and web engineers, at organizations of all sizes. It is used across e-commerce and retail, financial services and fintech, SaaS and cloud platforms, healthcare and telemedicine, media and entertainment, and government and the public sector, wherever reliable validation of application performance and availability across complex user workflows matters. By combining real-browser web application monitoring, API monitoring, and infrastructure monitoring with both public and private deployment options, the platform gives teams a single view of how their digital services behave for users around the world

Average Rating: 4.5/5.0

Total Reviews: 33

How Do G2 Users Rate Dotcom-Monitor?

  • Has the product been a good partner in doing business?: 9.0/10 (Category avg: 9.2/10)
  • Ease of Admin: 8.9/10 (Category avg: 8.9/10)
  • Baseline: 8.6/10 (Category avg: 9.0/10)
  • Reporting: 8.6/10 (Category avg: 8.9/10)

Who Is the Company Behind Dotcom-Monitor?

  • Seller: Dotcom-Monitor LoadView
  • Year Founded: 1998
  • HQ Location: Spring Park, MN
  • Twitter: @Dotcom_Monitor
    1,556 Twitter followers
  • LinkedIn® Page: www.linkedin.com
    25 employees on LinkedIn®
  • Ownership: Dotcom-Monitor

Who Uses This Product?

  • Top Industries: Information Technology and Services
  • Company Size: 61% Small, 33% Medium

What Do G2 Reviewers Say About Dotcom-Monitor?

AI-generated summary from verified user reviews

Pros
  • Users find Dotcom-Monitor incredibly easy to use and navigate, making it helpful for managing multiple online stores.
  • Users find Dotcom-Monitor's navigation ease highly beneficial for managing multiple online stores efficiently.
  • Users value the real-time performance data from multiple locations, facilitating rapid identification of regional issues.
  • Users value the real-time monitoring capabilities of Dotcom-Monitor, enabling swift identification of regional performance issues.
  • Users find the user-friendly interface of Dotcom-Monitor easy to navigate, making it helpful for managing multiple online stores.

What Are Recent G2 Reviews of Dotcom-Monitor?

Tian Lin
TL
Researched and written by Tian Lin
Updated April 9, 2026

Learn More About Website Monitoring Software

What is Website Monitoring Software?

Website monitoring software allows users to consistently track performance metrics for websites in real time. These metrics can be displayed as reports or on a visual dashboard. Baseline performance metrics can be customized to meet the minimum requirements of maintaining the uptime and performance of websites.

A quality web page is usually the first line of contact customers, partners, and prospective employees have with a company. It can be a reliable resource for anyone wanting to know more about a company or an organization and legitimize a brand to a potential consumer. However, if a company’s web page has any issues, it creates a negative experience that leads to missed sales opportunities and a damaged reputation. Website monitoring tools are designed to ensure this second scenario never happens and that web performance remains consistent for all website visitors.

The term “uptime" means a website is running as expected, with a steady flow of data between the web server and the site’s users. Conversely, “downtime" means any interruption, when incoming web traffic can’t access a complete website. Website performance monitoring software maximizes uptime and minimizes downtime, so new and repeat visitors can enjoy a website as intended, whether learning about a company or engaging with a company’s content. Depending on a company’s network, the complexity of its site, and the level of web activity they experience, website speed, load time, and other performance metrics can vary by the hour. In some cases, a site can crash entirely without warning.

The tools in this category actively monitor a company’s site by web API and transaction monitoring, test it from all angles, and offer real-time alerts when there are outages so companies can quickly address the issue. Some tools in this category generate valuable insights from user activity monitoring that help adjust strategy and web offerings for optimal results. Performance dashboards in certain products offer complete visibility into a website (or websites), so companies can identify potential issues before they arise and continually improve the user experience, which translates to desirable business outcomes across an organization.

What Types of Website Monitoring Software Exist?

Free edition

Many website monitoring software offer free plans. These solutions check customers’ website uptime from a couple of times a day to every couple of minutes. They have a basic performance dashboard and can alert IT staff when the website goes dark. However, they might not offer advanced features such as root cause analysis on what is causing the outage. For small businesses, this is a true bargain if they don’t require an online presence.

Paid edition

Paid website monitoring software provides frequent uptime checks from every couple minutes to under a minute. They also provide comprehensive monitoring services including real user monitoring (web user analytics), website content monitoring (unexpected changes on website content), and multiple location checks (server performance in another geo). These features help companies quickly identify key performance errors which reduces downtime. Any companies that have online shopping transactions or digital-centered strategies are recommended to use the paid edition to ensure a consistent online user experience.

What are the Common Features of Website Monitoring Software?

The following are some core features within website monitoring software that can help users in tracking website performance, observing traffic and user data, and alerting users of technical issues plus their underlying cause:

Uptime monitoring: Uptime monitoring or availability monitoring is tracking a website’s live and accessible feed. An uptime robot tests the website at consecutive intervals with web APIs. These tests simulate attempted sessions from users in various locations or different channels. Following tests by an uptime robot, these programs generate uptime reports detailing a website’s availability. Depending on the platform used, uptime robots might test complete web pages including HTML, CSS, scripts, and images, with corresponding data for how these components load for users. Certain tools also help companies understand their site’s performance as it relates to different browsers, platforms, and countries. Uptime tests may be pre configured in a website monitoring service, or companies may be able to customize and manage tests to meet their preferred specifications.

Downtime alerts: Downtimes are gaps in a website’s uptime, and they usually last from a couple of seconds to hours. Downtime can happen at inconvenient hours or during high-traffic moments. Depending on the situation, it may require immediate attention to get the site back to its regular functionality. Several platforms offer downtime alerts or notifications that ping the appropriate users when a site or certain content becomes unavailable, regardless of the underlying cause. Every second that a site is down is translated to missed sales opportunities or negative user experiences. Downtime notifications instantly call attention to these situations, so administrators can work to quickly find a solution.

Downtime alerts may be customizable so the most appropriate actions can be taken. This can include varying levels of urgency based on the extent of site disruption, different data points related to the problem, or automatic escalations to specific users based on situation details. Downtime alerts don’t fix websites, but they draw attention to performance issues instantly, and in some cases, draw conclusions about the cause. With real-time information, teams can make informed decisions to remedy the problem with as little downtime as possible. Some vendors also set up site public status pages and social media posts to alert customers when the website is down.

Performance data: Along with uptime and downtime, it benefits web administrators to monitor the overall performance of company websites. With certain tools in this category, users collect data such as page speed, element load times, and network data flow, which helps deepen their understanding of the site and user experience. A great website is never complete and requires continued effort to run smoothly. If a company has multiple active web pages, it can benefit from as much data as possible. It’s important to consider various metrics that might help a team maintain each web page at the highest level, and to keep this in mind when researching the features in a possible web monitoring solution.

Real user monitoring (RUM): Digital businesses use RUM to analyze customers’ digital experiences by looking at how online visitors are interacting with a website. It analyzes everything from page load events to HTTP requests to bounce rates. Advanced website monitoring package includes RUM to correlate website performance to revenue generation. If customers start leaving the website and there is no performance issue, companies can identify content issues attributed to a high bounce rate. Since RUM tracks revenue generation on each site, it also allows users to optimize the areas on site that will bring the most revenue down to an accurate dollar amount on every page.
What are the Benefits of Website Monitoring Software?

Increase website performance: Downtime is inevitable, but website monitoring solutions can significantly reduce downtime by alerting users, pinpointing the cause of downtime, and offering suggestions to fix the problem. This will allow IT teams to fix the downtime quickly and keep customers from leaving the sites because of performance issues.

Save money: Average website uptime is around 99.5% and that costs businesses more than $50,000 on average in revenue. That also means the website is down for nearly 43 hours a year. On the other hand, website monitoring cost from free to a couple of hundred dollars a month. There is no reason not to use website monitoring software since they are so inexpensive compared to the benefit they bring. 

Increase end-user satisfaction: A quick turnaround on performance issues leads to happier consumers. Website monitoring solutions assist in identifying stress points and bottlenecks within sites to focus on troubleshooting exactly where it is needed. They also provide public status pages to tell end users when there is an outage. 

Who Uses Website Monitoring Software?

IT teams: Traditionally, a company’s IT department or IT specialists are tasked with launching, monitoring, and maintaining its web properties. These are the ideal users for web monitoring and testing tools. If there are any performance issues, IT specialists should be the first to know, as they have the skills to fix the problem. The data generated by these platforms is beneficial for IT departments to understand and continuously improve user experience. Additionally, user monitoring features help teams get a clear picture of their audience and their unique interactions with the brand as a whole.

ITSM tool implementation, consulting, and managed services providers: For smaller companies without a designated IT team, companies may outsource website building and maintenance to website design companies or other third-party agencies. Third-party agencies will buy website monitoring software to use on the clients’ sites. While agencies might not be as dedicated as permanent employees, they are cost effective for startups and small businesses. 

Software Related to Website Monitoring Software

The following are related solutions that can be used together with website monitoring software to help IT teams track their performance, collect valuable data, and keep things organized throughout the business lifecycle:

Application performance monitoring software: If a company offers any sort of web application it will need to consistently monitor its uptime and performance separately from its primary web page. Application performance monitoring software, or APM software, offers activity monitoring for web applications in a similar fashion to a website monitoring service. Just like a website, application performance varies wildly throughout the day based on several factors, from server connections to user activity, and random events can trigger downtime or other complications. Implementing an APM tool helps teams monitor active applications and their respective uptimes so they can take ongoing action toward maintaining and improving applications.

Network monitoring software: The performance and reliability of IT networks are important for modern businesses, without which they could not run and maintain websites or applications, let alone perform essential job functions. Network monitoring software helps IT departments monitor entire computer networks, track baseline metrics, and be notified of performance issues so they can quickly remedy them. Network monitoring is crucial for larger businesses concurrently running hundreds of computers and executing various programs for internal and external use. A small hiccup in network performance causes substantial problems for an interconnected company and its customer base. These tools provide a holistic view of IT network performance and activity, with infrastructure monitoring and employee monitoring for anyone connected to a primary network.

Website security software: As a company establishes its internal process to monitor websites, it is important to stay conscious of viruses and other cyber threats that could corrupt a website and endanger a company and its customers alike. Website security software is a natural complement to website performance monitoring efforts, helping to protect sites from threats such as data theft and malware. Website monitoring tools may offer certain features of these tools, such as vulnerability monitoring or virus detection, but can not provide comprehensive protection on their own. There are thousands of internet-based threats and more are created each day; website security tools help monitor suspicious activity and build a line of defense against intrusive behavior targeting a company’s web properties.

Challenges with Website Monitoring Software

Software solutions can come with their own set of challenges. 

Inefficient optimization strategy: Website monitoring provides performance data but that is usually not enough for businesses to effectively improve customer satisfaction. There is always room for optimization so companies need to determine which sites are the most important for customers and revenue generation. Companies should contextualize network performance to business metrics. For example, a customer might be experiencing slow page speed and load time for two specific sites. One site might have a low bounce rate while the other a high one. The IT team should prioritize the high bounce rate sites that contribute to revenue loss. Instead of trying to fix every problem, businesses need to have a website monitoring strategy that tackles high-impact problems. 

Unplanned user growth: Website monitoring doesn’t always predict future growth. 

How a website is performing now with 100 users will be different with 10,000 users. Enterprises need to project what the state of their network will be in the future, especially when there is a marketing campaign or new product launch. 

Multiple location checks: Companies need to keep in mind that website performance checks are done by API server interactions between one server to another server in different locations. If a US east coast server passes a good performance check, that only shows users on the east coast will experience a good network connection. Companies can’t assume that users on the west coast will have the same experience. Companies should identify where their target customers are located and perform server checks in these locations. This ensures that end users from different locations will experience the same web performance.

How to Buy Website Monitoring Software

Requirements Gathering (RFI/RFP) for Website Monitoring Software

When searching for website monitoring software, companies should first look at their specifically desired data and metrics. For example, the user may be most interested in monitoring and improving performance for response time within their website. Buyers should make a ranked list of the website metrics that most directly address the problems they’re trying to solve, then reference G2 reviews to find the right fit. If the requirement is low, then free tools might even be the best choice.

Prioritizing the desired feature set can help narrow down the potential pool of website monitoring solutions, allowing teams to then apply further considerations for budgets, ease of integration with other systems, security requirements, and more. This holistic approach empowers buyers to move forward with a focused checklist, which can be used in conjunction with G2 scoring to select the best website monitoring product for the business.

Compare Website Monitoring Software Products

Create a long list

Buyers should start with a large pool of website monitoring software vendors. Keeping the desired must-have features in mind, buyers must perform consistent inquiries during demos by which they can effectively compare the pros and cons of each software.

Create a short list

It helps to cross reference the results of initial vendor evaluations with G2 reviews from other buyers, the combination of which will help to narrow in on a short three to five product list. From there, buyers can compare pricing and features to determine the best fit.

Conduct demos

As a rule of thumb, companies should make sure to demo all of the products that end up on their short list. During demos, buyers should ask specific questions related to the functionalities they care most about; for example, one might ask to be walked through a typical performance issue from alerting to remediation within the tool. 

Selection of Website Monitoring Software

Choose a selection team

Regardless of a company’s size, it’s important to involve the most relevant personas when beginning the software selection process. Larger companies may include individual team members from e-commerce teams, digital teams, and IT professionals and developers working with the software most closely. Smaller companies with fewer employees might overlap roles. 

Negotiation

Many companies offer full monitoring platforms that go beyond website monitoring to include network monitoring, infrastructure monitoring, and more. While some companies will not budge on the configurations of their packages, buyers looking to trim costs should try to negotiate down to the specific functions that matter to them to get the best price. For example, a vendor’s pricing page for website monitoring functionality might only be included with a robust all-in-one monitoring package, whereas a sales conversation may prove otherwise. 

Final decision

After this stage, it is important to perform a trial run if possible with a small selection of IT professionals or developers. This will help to ensure that the website monitoring software of choice integrates well with an IT administrator’s systems setup or a developers’ day-to-day work. If the website monitoring tool is well liked and well utilized, the buyer can take that as a sign that their selection is the right one. If not, reevaluation of the options may be necessary.