Best Mobile App Analytics Tools

How Many Mobile App Analytics Tools Products Does G2 Track?

Total Products under this Category: 119

Category Stats (Nov 2026)

  • Average Rating: 4.51/5 (↑0.01 vs Oct 2026) The average rating of products in this category, based on all submitted ratings
  • Top Trending Product: AppstoreSpy (+7.02%) - Among all products in this category, AppstoreSpy recorded the largest rating increase compared to last month

Last updated: November 01, 2026

How Does G2 Rank Mobile App Analytics Tools Products?

Why You Can Trust G2's Software Rankings:

  • 30 Analysts and Data Experts
  • 31,300+ Authentic Reviews
  • 119+ Products
  • Unbiased Rankings

G2's software rankings are built on verified user reviews, rigorous moderation, and a consistent research methodology maintained by a team of analysts and data experts. Each product is measured using the same transparent criteria, with no paid placement or vendor influence. While reviews reflect real user experiences, which can be subjective, they offer valuable insight into how software performs in the hands of professionals. Together, these inputs power the G2 Score, a standardized way to compare tools within every category.

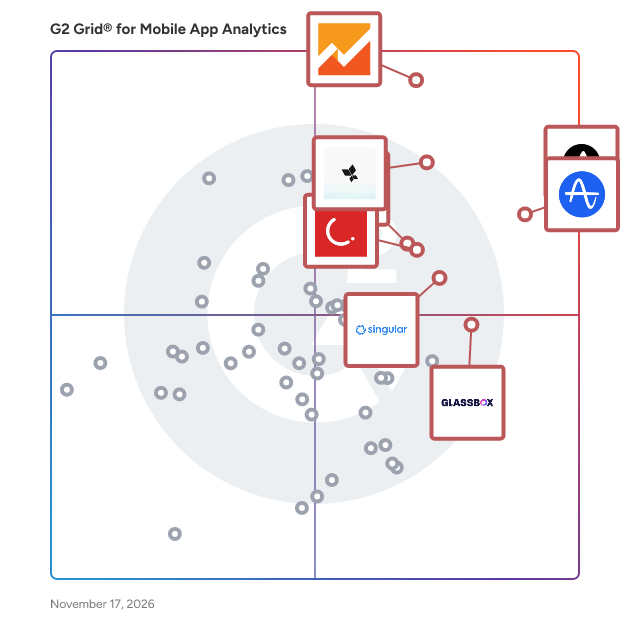
G2 Grid® for Mobile App Analytics Tools

G2 Grid® for Mobile App Analytics Tools plotting products by satisfaction and market presence

Highlighted products: Adjust, Google Analytics, Amplitude Analytics, AppsFlyer, CleverTap, Singular, Mixpanel, and Glassbox.

Underlying data: [Grid® JSON](https://www.g2.com/categories/mobile-app-analytics/grids.json?focus%5B%5D=adjust&focus%5B%5D=google-analytics&focus%5B%5D=amplitude-analytics&focus%5B%5D=appsflyer&focus%5B%5D=clevertap&focus%5B%5D=singular&focus%5B%5D=mixpanel&focus%5B%5D=glassbox)

Adjust

Adjust is a mobile measurement partner (MMP) used by more than 300,000 apps to accurately measure performance, optimize campaigns, and confidently grow their app businesses. As a comprehensive suite for attribution, analytics, deep linking, fraud prevention, incrementality testing, audience segmentation, ad spend tracking, and AI-driven optimization through our AI Growth Copilot, Adjust gives marketers and developers the clear, reliable data they need to make smarter decisions and maximize ROI. At the core of Adjust is precise, privacy-centric attribution that helps teams understand exactly which channels and touchpoints drive value. Combined with powerful deep linking and full cross-platform journey support (including mobile web, desktop web, app, CTV, PC, console, offline, QR codes, and more), Adjust enables seamless user experiences from any channel or device to app while maintaining complete measurement visibility across the entire lifecycle. Our fraud prevention suite protects marketing budgets and ensures clean datasets by proactively preventing invalid traffic before it impacts reporting. With this measurement foundation, app businesses can confidently analyze performance, optimize spend, and scale more efficiently.

Average Rating: 4.7/5.0

Total Reviews: 793

How Do G2 Users Rate Adjust?

  • Return: 8.6/10 (Category avg: 8.5/10)
  • Retention: 8.8/10 (Category avg: 8.6/10)
  • Engagement: 8.8/10 (Category avg: 8.7/10)
  • Has the product been a good partner in doing business?: 9.2/10 (Category avg: 9.1/10)

Who Is the Company Behind Adjust?

  • Seller: adjust.com
  • Company Website:
  • Year Founded: 2012
  • HQ Location: Berlin, Berlin
  • LinkedIn® Page: www.linkedin.com
    474 employees on LinkedIn®

Who Uses This Product?

  • Who Uses This: UA Marketing, UA
  • Top Industries: Marketing and Advertising, Computer Games
  • Company Size: 48% Medium, 39% Small

What Do G2 Reviewers Say About Adjust?

AI-generated summary from verified user reviews

Pros
  • Users value the intuitive dashboard of Adjust, making tracking and optimization easy and efficient across campaigns.
  • Users value the responsive and helpful customer support of Adjust, enhancing implementation and troubleshooting efficiency.
  • Users value Adjust’s exceptional real-time attribution and intuitive dashboard, enhancing campaign performance tracking across multiple networks.
  • Users value the highly accurate attribution and real-time reporting from Adjust, enhancing campaign optimization and performance tracking.
  • Users value the highly accurate attribution tracking of Adjust, enhancing campaign optimization and performance analysis.
Cons
  • Users find the complexity of Adjust's setup and advanced features to be a significant challenge for marketers.
  • Users often face slow loading times and errors, leading to frustrating delays in accessing data and refreshing pages.
  • Users find the pricing structure quite expensive, especially as user acquisition scales, posing challenges for growth.
  • Users often face slow performance when loading large datasets, causing frustrating delays in data refresh and page loading.
  • Users struggle with dashboard issues due to complexity, making data interpretation and extraction cumbersome and time-consuming.

What Are Recent G2 Reviews of Adjust?

What Are G2 Users Discussing About Adjust?

Google Analytics

Improve the customer experience with digital analytics for your website or mobile app — for free. Google Analytics gives companies rich insights about their websites, their audiences and their digital marketing. Powerful, flexible and easy to use, Analytics helps savvy marketers find the messages and channels that earn them the best results. State-of-the-art conversion attribution and testing tools help companies large and small build better user experiences and maximize their digital strategy. Get user insights that only Google can give you. Understand your site and app users to better evaluate the performance of your content, products, and more. Whether your business is big or small, Google can help you see what’s working and fix what’s not. Let Google Analytics work for you. Learn more at google.com/analytics.

Average Rating: 4.5/5.0

Total Reviews: 6,616

How Do G2 Users Rate Google Analytics?

  • Return: 8.6/10 (Category avg: 8.5/10)
  • Retention: 8.8/10 (Category avg: 8.6/10)
  • Engagement: 8.8/10 (Category avg: 8.7/10)
  • Has the product been a good partner in doing business?: 8.4/10 (Category avg: 9.1/10)

Who Is the Company Behind Google Analytics?

  • Seller: Google
  • Year Founded: 1998
  • HQ Location: Mountain View, CA
  • LinkedIn® Page: www.linkedin.com
    301,144 employees on LinkedIn®
  • Ownership: NASDAQ:GOOG
  • Phone: +1 (650) 253-0000

Who Uses This Product?

  • Who Uses This: Owner, Founder
  • Top Industries: Marketing and Advertising, Information Technology and Services
  • Company Size: 60% Small, 29% Medium

What Do G2 Reviewers Say About Google Analytics?

AI-generated summary from verified user reviews

Pros
  • Users love the user-friendly insights from Google Analytics, enabling effective website performance analysis without a large budget.
  • Users appreciate the comprehensive traffic tracking of Google Analytics, enhancing insights and optimizing website performance.
  • Users find Google Analytics to be very user-friendly, allowing effortless daily analysis of website traffic and performance.
  • Users appreciate the easy integrations of Google Analytics, allowing seamless tracking of traffic from various sources.
  • Users value the clear, data-driven insights of Google Analytics, enabling them to effectively optimize marketing strategies.
Cons
  • Users find Google Analytics' steep learning curve challenging, making reporting and basic insights difficult to access.
  • Users find the complexity of Google Analytics can hinder beginners and complicate simple metric tracking.
  • Users find the learning difficulty of Google Analytics challenging, especially for beginners struggling with its complex dashboard.
  • Users find Google Analytics not intuitive, facing a steep learning curve and difficulty accessing essential insights.
  • Users find the steep learning curve of Google Analytics challenging, leading to frustrations with report navigation.

What Are Recent G2 Reviews of Google Analytics?

What Are G2 Users Discussing About Google Analytics?

Amplitude Analytics

The core of the Amplitude AI Analytics Platform, Amplitude Analytics lets you dig into the real-time data about what users are doing in your digital products and experiences. These quantitative insights help you quickly and deeply understand what’s working, what’s not, and what to do more of to drive growth. Amplitude Analytics makes it fast and easy for product teams, marketing teams, data teams, or anyone to get actionable insights: • Track every click and metric across the full customer journey to understand conversion, adoption, retention, and more in real time. • Self-serve access lets teams explore insights with simple AI prompts, break down information silos, and free up data teams for higher-impact analysis. • AI Agents automatically surface new trends, unexpected behaviors, and action plans for an unfair advantage. • Marketing analytics gives marketers purpose-built tools to see full-funnel customer behavior, improve ROI, and scale insights with other teams. • Trust your data with precision tracking schema design, AI-enhanced data governance controls, and enterprise-level security. And if you’re new to analytics, don’t worry: you can get started fast with Autocapture event tracking, chat-based interfaces, and expert-built dashboard templates. Coupled with the rest of the Amplitude platform, Analytics’s quantitative insights are just the beginning. Turn behavioral cohorts into A/B test segments, deliver smarter in-app engagement, and activate your data for precise personalization throughout your tech stack. Which you’ll also be able to shrink, thanks to our consolidated platform. Amplitude Analytics lets you understand what your users want so you can give it to them. Use it to get the answers you need to grow relentlessly.

Average Rating: 4.4/5.0

Total Reviews: 3,043

How Do G2 Users Rate Amplitude Analytics?

  • Return: 8.3/10 (Category avg: 8.5/10)
  • Retention: 8.4/10 (Category avg: 8.6/10)
  • Engagement: 8.6/10 (Category avg: 8.7/10)
  • Has the product been a good partner in doing business?: 8.7/10 (Category avg: 9.1/10)

Who Is the Company Behind Amplitude Analytics?

  • Seller: Amplitude
  • Company Website:
  • Year Founded: 2012
  • HQ Location: San Francisco, CA
  • LinkedIn® Page: www.linkedin.com
    1,635 employees on LinkedIn®
  • Ownership: NASDAQ: AMPL

Who Uses This Product?

  • Who Uses This: Product Manager, Software Engineer
  • Top Industries: Computer Software, Information Technology and Services
  • Company Size: 46% Medium, 31% Small

What Do G2 Reviewers Say About Amplitude Analytics?

AI-generated summary from verified user reviews

Pros
  • Users appreciate the intuitive design and AI tools of Amplitude Analytics, enhancing data understanding and efficiency in decision-making.
  • Users find Amplitude Analytics to be extremely user-friendly, enabling quick data analysis and report generation effortlessly.
  • Users appreciate the visibility into feature usage Amplitude Analytics provides, enabling data-driven decision-making effectively.
  • Users find Amplitude Analytics to be intuitive and easy to use, enhancing their data analysis and reporting experiences.
  • Users value the intuitive and powerful UI of Amplitude Analytics, making data analysis quick and effortless.
Cons
  • Users find the learning curve challenging, especially with complex dashboards and report configurations in Amplitude Analytics.
  • Users find the steep learning curve of Amplitude Analytics challenging, especially for those new to the platform.
  • Users often face missing features, particularly with limited functionalities across plans and slow automated tools.
  • Users often struggle with the complex event management and learning curve, which can hinder usability for new users.
  • Users note that complex features may overwhelm new users, complicating the analysis and setup processes.

What Are Recent G2 Reviews of Amplitude Analytics?

What Are G2 Users Discussing About Amplitude Analytics?

AI can help you find the answers. G2 helps you trust them.

Connect G2 to Claude or ChatGPT for answers grounded in G2's trusted reviews, comparisons, and pricing from real user insights.

How it works

AppsFlyer

AppsFlyer is the Modern Marketing Cloud that helps businesses transform complex data into clarity and growth. A foundation for unified, measurable, autonomous marketing, AppsFlyer breaks down silos across measurement, deep linking, data collaboration, and autonomous AI workflows. For more than a decade, AppsFlyer has been the leader in mobile attribution, trusted by over 15,000 businesses worldwide. To learn more, visit www.appsflyer.com.

Average Rating: 4.5/5.0

Total Reviews: 775

How Do G2 Users Rate AppsFlyer?

  • Return: 8.4/10 (Category avg: 8.5/10)
  • Retention: 8.5/10 (Category avg: 8.6/10)
  • Engagement: 8.6/10 (Category avg: 8.7/10)
  • Has the product been a good partner in doing business?: 8.6/10 (Category avg: 9.1/10)

Who Is the Company Behind AppsFlyer?

  • Seller: AppsFlyer
  • Company Website:
  • Year Founded: 2011
  • HQ Location: San Francisco, CA
  • LinkedIn® Page: www.linkedin.com
    1,577 employees on LinkedIn®

Who Uses This Product?

  • Who Uses This: Product Manager, Marketing Manager
  • Top Industries: Marketing and Advertising, Financial Services
  • Company Size: 42% Medium, 31% Small

What Do G2 Reviewers Say About AppsFlyer?

AI-generated summary from verified user reviews

Pros
  • Users value the holistic analytics of AppsFlyer, which simplifies campaign management and improves mobile app performance tracking.
  • Users value the holistic mobile marketing measurement of AppsFlyer, appreciating its reliable and user-friendly analytics features.
  • Users appreciate the ease of use of AppsFlyer, enabling non-technical teams to efficiently manage campaigns.
  • Users value the accurate cross-channel attribution of AppsFlyer, which enhances decision-making and optimizes marketing efforts.
  • Users value the accurate attribution of AppsFlyer, enhancing decision-making and campaign management capabilities.
Cons
  • Users find the pricing can be high for startups and small teams, impacting accessibility for some.
  • Users struggle with data inaccuracy in AppsFlyer, experiencing mismatches and challenges in user identification across platforms.
  • Users find AppsFlyer's high pricing challenging, especially for smaller teams and startups with limited budgets.
  • Users face data management issues with challenging aggregation, mismatches, and unclear attribution across platforms.
  • Users find the dashboard complex and tricky for new users, affecting navigation and customization capabilities.

What Are Recent G2 Reviews of AppsFlyer?

What Are G2 Users Discussing About AppsFlyer?

CleverTap

CleverTap is the all-in-one engagement platform that helps brands unlock limitless customer lifetime value by helping them create personalized experiences to retain their most valuable customers. The platform empowers businesses to orchestrate experiences for individuals across their lifecycles and design personalized journeys that span a lifetime. It offers analytics that encompasses every aspect of the lifecycle, enabling businesses to measure and optimize each experience in real time. The all-in-one platform unifies experiences from every touchpoint, paving the way for a new era of customer engagement. CleverTap's CleverAI™ Decisioning Engine and Agentic Universe is designed to maximize ROI. It enables true individualization, where every customer is a segment of one. A suite of intelligent, purpose-built AI agents works seamlessly in the background, optimizing every interaction across message, content, channel, and timing, so teams can stay focused on outcomes. The platform is powered by TesseractDB™ – the world’s first purpose-built database for customer engagement, offering both speed and economies of scale. CleverTap is trusted by 2000 customers, including TiltingPoint, Gamebasics, Big Fish, MobilityWare, English Premier League, TD Bank, Carousell, AirAsia, Papa John’s, and Tesco. Backed by leading investors such as Peak XV Partners, Tiger Global, Accel, CDPQ and 360 One, the company is headquartered in Mountain View, California, with presence in San Francisco, New York, São Paulo, Bogota, London, Amsterdam, Sofia, Dubai, Mumbai, Bangalore, Singapore, and Jakarta. For more information, visit clevertap.com or follow us on: LinkedIn: https://www.linkedin.com/company/clevertap/ Twitter: https://twitter.com/CleverTap

Average Rating: 4.5/5.0

Total Reviews: 756

G2 Deal: 75% discount for the first 6 months on CleverTap Essentials plan

CleverTap is the all-in-one engagement platform that helps brands unlock limitless customer lifetime value by helping them create personalized experiences to retain their most valuable customers. Get 75% off for 6 months, 30-day free trial & much more.

View this exclusive G2 deal

How Do G2 Users Rate CleverTap?

  • Return: 9.0/10 (Category avg: 8.5/10)
  • Retention: 9.0/10 (Category avg: 8.6/10)
  • Engagement: 9.1/10 (Category avg: 8.7/10)
  • Has the product been a good partner in doing business?: 9.2/10 (Category avg: 9.1/10)

Who Is the Company Behind CleverTap?

  • Seller: CleverTap
  • Company Website:
  • Year Founded: 2013
  • HQ Location: Mountain View, California
  • LinkedIn® Page: www.linkedin.com
    642 employees on LinkedIn®

Who Uses This Product?

  • Who Uses This: Product Manager, Marketing Manager
  • Top Industries: Financial Services, Internet
  • Company Size: 53% Medium, 29% Small

What Do G2 Reviewers Say About CleverTap?

AI-generated summary from verified user reviews

Pros
  • Users value the real-time analytics of CleverTap, enhancing campaign tracking and personalized marketing efforts across channels.
  • Users value CleverTap's responsive customer support, which aids in overcoming challenges and enhancing the user experience.
  • Users find CleverTap very easy to use, simplifying campaign creation and integration across multiple channels effectively.
  • Users value the convenient automation features of CleverTap, enhancing campaign management and performance optimization effortlessly.
  • Users commend the ease of creating multi-channel campaigns with CleverTap, appreciating its robust analytics and support.
Cons
  • Users find the learning curve steep due to the complicated interface and overwhelming analytics tools.
  • Users find the missing features frustrating, particularly the lack of campaign creation and poor third-party integration.
  • Users find the cost to be high, limiting the product's accessibility and value for their businesses.
  • Users find the analytics not intuitive, making it challenging to utilize CleverTap’s extensive features effectively.
  • Users find the complex interface of CleverTap overwhelming, making it difficult to navigate and utilize effectively.

What Are Recent G2 Reviews of CleverTap?

What Are G2 Users Discussing About CleverTap?

Mixpanel

Mixpanel's product intelligence turns data clarity into innovation. Trusted by more than 29,000 companies, including Workday, Pinterest, LG, and Rakuten Viber, Mixpanel’s AI-first product analytics help teams accelerate adoption, improve retention, and ship with confidence. Powering this is an industry-leading platform that combines product and web analytics, session replay, experimentation, feature flags, and metric trees. Mixpanel delivers insights built for the AI era.

Average Rating: 4.5/5.0

Total Reviews: 1,359

How Do G2 Users Rate Mixpanel?

  • Return: 8.7/10 (Category avg: 8.5/10)
  • Retention: 8.7/10 (Category avg: 8.6/10)
  • Engagement: 9.0/10 (Category avg: 8.7/10)
  • Has the product been a good partner in doing business?: 8.8/10 (Category avg: 9.1/10)

Who Is the Company Behind Mixpanel?

  • Seller: Mixpanel
  • Company Website:
  • Year Founded: 2009
  • HQ Location: San Francisco, CA
  • LinkedIn® Page: www.linkedin.com
    767 employees on LinkedIn®

Who Uses This Product?

  • Who Uses This: Product Manager, Software Engineer
  • Top Industries: Computer Software, Information Technology and Services
  • Company Size: 53% Small, 37% Medium

What Do G2 Reviewers Say About Mixpanel?

AI-generated summary from verified user reviews

Pros
  • Users love Mixpanel's ease of use, allowing effortless dashboard creation and straightforward event tracking for insights.
  • Users value Mixpanel's flexible dashboard design and its reliable, user-friendly analytics for informed decision-making.
  • Users appreciate the super clean and easy-to-use UI of Mixpanel, enabling non-technical teams to access data effortlessly.
  • Users appreciate the intuitive user interface of Mixpanel, making analytics enjoyable and accessible for everyone.
  • Users appreciate the robust reporting capabilities of Mixpanel, enhancing their ability to analyze data effectively and intuitively.
Cons
  • Users find a steep learning curve with advanced features in Mixpanel, complicating efficient usage and updates.
  • Users face a steep learning curve with Mixpanel, particularly for mastering advanced features and managing updates efficiently.
  • Users find a clunky event tracking process in Mixpanel, complicating the analysis of user activity feeds.
  • Users find Mixpanel expensive and challenging to manage A/B tests effectively without substantial effort and cost.
  • Users find the complexity of Mixpanel overwhelming, especially lacking proper onboarding for effective usage and feature access.

What Are Recent G2 Reviews of Mixpanel?

What Are G2 Users Discussing About Mixpanel?

Singular

Singular is the only end-to-end marketing attribution and analytics platform that uncovers true ROI across all marketing channels. We transform complex marketing data into actionable insights by unifying campaign data from thousands of channels with cross-device attribution data. Leading brands like LinkedIn, Nike, WB Games, and Rovio rely on Singular to maximize every marketing dollar, eliminate wasted spend, and drive higher user retention. With superior ROI reporting, advanced fraud prevention, user engagement capabilities, and unmatched data accessibility, marketers can finally drive faster growth with smarter insights.

Average Rating: 4.6/5.0

Total Reviews: 549

How Do G2 Users Rate Singular?

  • Return: 8.3/10 (Category avg: 8.5/10)
  • Retention: 8.3/10 (Category avg: 8.6/10)
  • Engagement: 8.4/10 (Category avg: 8.7/10)
  • Has the product been a good partner in doing business?: 9.2/10 (Category avg: 9.1/10)

Who Is the Company Behind Singular?

  • Seller: Singular
  • Company Website:
  • Year Founded: 2014
  • HQ Location: Palo Alto, California
  • LinkedIn® Page: www.linkedin.com
    361 employees on LinkedIn®

Who Uses This Product?

  • Who Uses This: User Acquisition Manager, Marketing Manager
  • Top Industries: Computer Games, Financial Services
  • Company Size: 52% Medium, 27% Small

What Do G2 Reviewers Say About Singular?

AI-generated summary from verified user reviews

Pros
  • Users praise the support and professionalism of Singular, enhancing issue tracking and overall user experience.
  • Users praise the ease of use of Singular, highlighting its straightforward setup and user-friendly navigation.
  • Users value the support and professionalism of Singular, enhancing their tracking and attribution processes effectively.
  • Users value the intuitive interface and reliable insights of Singular, enhancing data analysis and decision-making efficiency.
  • Users value the clear and reliable reporting of Singular, which streamlines campaign analysis and decision-making.
Cons
  • Users find the poor interface design of Singular makes some workflows unintuitive and difficult to navigate effectively.
  • Users struggle with the poor UI of Singular, finding it outdated and not intuitive, hindering efficient use.
  • Users find the exporting features clunky and report difficulties with data access and iOS user attribution.
  • Users express frustration over data limitations, including restricted exports and lack of access to older datasets.
  • Users note the limited attribution capabilities for iOS users, affecting tracking and overall effectiveness.

What Are Recent G2 Reviews of Singular?

What Are G2 Users Discussing About Singular?

Glassbox

Glassbox is a customer intelligence and digital experience analytics platform designed to help enterprises understand, optimize, and enhance the customer experience and digital accessibility of their digital channels. One of the standout features of Glassbox is its capability to securely capture 100% of user sessions across both web and mobile applications. This end-to-end visibility allows teams to analyze every step of the customer journey, effectively pinpointing friction points and enabling real-time action. By utilizing advanced artificial intelligence, Glassbox captures and analyzes data from every online interaction, providing businesses with a comprehensive view of customer behavior and preferences. This wealth of data empowers organizations to act swiftly, transforming raw data into actionable insights that improve both the customer experience and the conversion rate. Large global enterprises in sectors such as finance, insurance, and healthcare, Glassbox serves as a vital tool for uncovering the root causes of customer challenges. It assists organizations in remediating customer experience issues and creating digital journeys that are inclusive, seamless, and engaging. The platform’s AI-powered insights not only enhance accessibility monitoring but also incorporate fraud prevention capabilities, giving organizations the agility to respond to issues within minutes and adapt to the evolving needs of their customers. Glassbox has been recognized by G2 as a leader in customer intelligence solutions and product analytics, reflecting its effectiveness in delivering the clarity and confidence that enterprises require. By providing a robust framework for creating compliant, accessible, and impactful digital experiences, Glassbox stands out in its category, offering unique selling points that cater to the diverse needs of its users. With its focus on data-driven decision-making and customer-centric strategies, Glassbox is positioned as a crucial ally for organizations aiming to thrive in the digital landscape.

Average Rating: 4.9/5.0

Total Reviews: 788

How Do G2 Users Rate Glassbox?

  • Return: 10.0/10 (Category avg: 8.5/10)
  • Retention: 10.0/10 (Category avg: 8.6/10)
  • Engagement: 10.0/10 (Category avg: 8.7/10)
  • Has the product been a good partner in doing business?: 9.9/10 (Category avg: 9.1/10)

Who Is the Company Behind Glassbox?

  • Seller: Glassbox
  • Company Website:
  • Year Founded: 2010
  • HQ Location: London
  • LinkedIn® Page: www.linkedin.com
    278 employees on LinkedIn®

Who Uses This Product?

  • Who Uses This: Digital Analyst, Product Owner
  • Top Industries: Financial Services, Insurance
  • Company Size: 77% Large, 18% Medium

What Do G2 Reviewers Say About Glassbox?

AI-generated summary from verified user reviews

Pros
  • Users value the ease of use of Glassbox, facilitating effortless access to insightful data and streamlined reporting.
  • Users value the real-time session replay of Glassbox for its clarity and effectiveness in enhancing user experience.
  • Users value the real-time data capture and comprehensive insights of Glassbox for enhancing customer experience.
  • Users appreciate the real-time insight into user interactions provided by Glassbox, enhancing troubleshooting and customer experience.
  • Users appreciate the in-depth customer understanding Glassbox provides, enabling data-driven decisions and improved user experiences.
Cons
  • Users experience significant session issues with Glassbox, including lag and difficulties finding session links.
  • Users find Glassbox to be not intuitive, with a steep learning curve and occasional performance issues.
  • Users often face session link splitting issues, making it challenging to keep track of recorded sessions.
  • Users find the learning curve steep with Glassbox, requiring more training to navigate its complex features effectively.
  • Users find the missing features of Glassbox frustrating, hindering functionality and session recording capabilities.

What Are Recent G2 Reviews of Glassbox?

What Are G2 Users Discussing About Glassbox?

Adobe Analytics

Adobe Analytics empowers marketing, product, and business teams with insights to understand their customers and the journeys they take across digital channels, products, content, and services. From digital data collection and relational clickstream processing to in-depth analysis, and reporting, Adobe Analytics helps you understand visitor engagement across your digital properties — making it possible to optimize digital marketing strategies, improve user experience, and drive business growth. Features: - Collect and ingest behavioral data in real-time from your web and mobile channels. - Automatically convert raw data for unlimited analysis to discover customer patterns, spot anomalies, identify friction in your digital experiences, and uncover insights from digital journeys. - Equip marketers and analysts with AI capabilities that speed through analyses so they can quickly and confidently generate insights to improve the digital experience. - Integrate and share insights, segments, and outputs from your data across other business applications.

Average Rating: 4.2/5.0

Total Reviews: 1,189

How Do G2 Users Rate Adobe Analytics?

  • Return: 8.6/10 (Category avg: 8.5/10)
  • Retention: 8.8/10 (Category avg: 8.6/10)
  • Engagement: 9.0/10 (Category avg: 8.7/10)
  • Has the product been a good partner in doing business?: 8.0/10 (Category avg: 9.1/10)

Who Is the Company Behind Adobe Analytics?

  • Seller: Adobe
  • Company Website:
  • Year Founded: 1982
  • HQ Location: San Jose, CA
  • LinkedIn® Page: www.linkedin.com
    42,975 employees on LinkedIn®
  • Ownership: NASDAQ:ADBE

Who Uses This Product?

  • Who Uses This: Data Analyst, Analyst
  • Top Industries: Marketing and Advertising, Information Technology and Services
  • Company Size: 43% Large, 30% Medium

What Do G2 Reviewers Say About Adobe Analytics?

AI-generated summary from verified user reviews

Pros
  • Users value the advanced segmentation and customizable dashboards of Adobe Analytics for effective data analysis and visualization.
  • Users love the advanced segmentation and customizable dashboards in Adobe Analytics, enabling detailed data analysis and visualization.
  • Users value the ease of use in Adobe Analytics, enabled by advanced segmentation and customizable dashboards for efficient data analysis.
  • Users love Adobe Analytics for its advanced segmentation and customizable dashboards, enhancing data analysis and visualization significantly.
  • Users value the customizable reporting in Adobe Analytics, enabling in-depth analysis and meaningful insights for marketing strategies.
Cons
  • Users struggle with a steep learning curve and complex setup in Adobe Analytics, making initial usage challenging.
  • Users often face a steep learning curve with Adobe Analytics, making setup and tracking complex and challenging for newcomers.
  • Users find Adobe Analytics expensive, particularly for smaller teams, and its complex setup adds to the overall burden.
  • Users experience slow performance with Adobe Analytics, especially when handling large datasets, impacting overall efficiency.
  • Users find the complexity of setup in Adobe Analytics challenging, especially for new users and smaller teams.

What Are Recent G2 Reviews of Adobe Analytics?

What Are G2 Users Discussing About Adobe Analytics?

Amazon Pinpoint

In today’s digitally transformed world, it’s more important than ever to have a deep understanding of your customers and to engage them with personalized messages through the channels that they prefer. Amazon Pinpoint enables marketers and developers to deliver customer-centric engagement experiences. Better experiences lead to stronger relationships with your customers and reduces customer churn.

Average Rating: 4.2/5.0

Total Reviews: 44

How Do G2 Users Rate Amazon Pinpoint?

  • Return: 8.7/10 (Category avg: 8.5/10)
  • Retention: 8.5/10 (Category avg: 8.6/10)
  • Engagement: 9.3/10 (Category avg: 8.7/10)
  • Has the product been a good partner in doing business?: 8.5/10 (Category avg: 9.1/10)

Who Is the Company Behind Amazon Pinpoint?

Who Uses This Product?

  • Top Industries: Computer Software, Information Technology and Services
  • Company Size: 56% Small, 29% Medium

What Do G2 Reviewers Say About Amazon Pinpoint?

AI-generated summary from verified user reviews

Cons
  • Users find that Amazon Pinpoint can negatively impact their domain health, affecting overall email deliverability.

What Are Recent G2 Reviews of Amazon Pinpoint?

What Are G2 Users Discussing About Amazon Pinpoint?

AppMetrica

AppMetrica is an affordable and reliable (yes, it is possible) all-in-one mobile app analytics tool that provides a comprehensive analysis of your mobile app user behavior, in-app revenue, mobile acquisition campaigns and crashlytics. Launched in 2013, it enables over 60 000 mobile apps like Azur Games, METRO, Burger King, Brave Stars worldwide to find actionable insights and maximize their app revenue. AppMetrica is used by user acquisition teams, product managers, revenue managers and analytics experts across multiple industries. Why switch to AppMetrica: - You need more functionality from your current product analytics tool, i.e. funnels, segmentation, and user-level data. - You are expanding your user acquisition campaigns beyond Google Ads and need an MMP. - Your current product analytics or MMP is too expensive. - You are overwhelmed with data and want to get an easy way to find insights for your app’s growth. - You value high-quality support 24/7. After all, no need to switch, you could use AppMetrica as an alternative source of truth. Simply create a free account. For more information visit: https://appmetrica.yandex.com/about

Average Rating: 4.5/5.0

Total Reviews: 45

How Do G2 Users Rate AppMetrica?

  • Return: 8.8/10 (Category avg: 8.5/10)
  • Retention: 9.0/10 (Category avg: 8.6/10)
  • Engagement: 8.6/10 (Category avg: 8.7/10)
  • Has the product been a good partner in doing business?: 9.2/10 (Category avg: 9.1/10)

Who Is the Company Behind AppMetrica?

  • Seller: Yandex Ads
  • Year Founded: 2004
  • HQ Location: Dubai
  • LinkedIn® Page: www.linkedin.com
    16 employees on LinkedIn®
  • Ownership: AppMetrica
  • Total Revenue (USD mm): $218,344

Who Uses This Product?

  • Top Industries: Computer Games, Information Technology and Services
  • Company Size: 61% Small, 30% Medium

What Do G2 Reviewers Say About AppMetrica?

AI-generated summary from verified user reviews

Pros
  • Users appreciate the ease of use of AppMetrica, finding insights simple to obtain and track.
  • Users value the easy integrations of AppMetrica, finding the implementation process simple and problem-free.
  • Users appreciate the easy setup of AppMetrica, enabling straightforward event tracking and seamless performance monitoring.
  • Users value the easy integration of AppMetrica, enabling seamless implementation and effective data-driven decision-making.
  • Users appreciate the ease of filtration and A/B testing in AppMetrica, enhancing user behavior analysis effortlessly.
Cons
  • Users express disappointment over missing features, especially in the mobile app, limiting their overall experience.
  • Users experience difficulties with report management, facing empty reports and lack of intuitive setup features.
  • Users experience inadequate reporting with empty reports and lack of customization, impacting the effectiveness of AppMetrica.
  • Users find the search difficulty in AppMetrica frustrating, especially with empty reports and limited UTM options.
  • Users experience inadequate tracking due to limited app features and lack of ad network integration.

What Are Recent G2 Reviews of AppMetrica?

What Are G2 Users Discussing About AppMetrica?

Dataroid

Dataroid is an AI-powered, enterprise-grade digital analytics and customer engagement platform that enables companies to measure, analyze, and optimize customer interactions and experiences across multiple digital channels. Designed to unify fragmented data sources, Dataroid provides organizations with a single source of truth about their customers, helping them transform raw data into insights that drive growth, retention, and loyalty. At its core, Dataroid offers advanced product and customer journey analytics that allow businesses to deeply understand user behavior across every touchpoint. Teams can visualize customer paths through funnels and journey maps, identify friction points, optimize conversion flows, and deliver seamless experiences tailored to each user segment. With these tools, companies can continuously improve their digital products and create experiences that resonate. Dataroid’s platform combines enriched customer profiles, behavioral analytics, application performance monitoring, and predictive data modeling into a unified ecosystem that provides end-to-end visibility for marketing, product, and technology teams. Through customizable dashboards, teams can track KPIs, monitor engagement, and make faster, smarter decisions based on live data. Meanwhile, Dataroid’s Push and In-App Engagement capabilities enable personalized, context-aware communication with users, helping brands deliver the right message, to the right audience, at the right moment. Dataroid seamlessly collects and processes data from diverse digital touchpoints through its flexible SDKs and lightweight APIs, ensuring smooth integration with mobile apps, web platforms, and backend systems. This architecture allows companies to gather real-time behavioral, performance, and contextual data without compromising application speed or user experience. With adaptable deployment options and enterprise-grade security, Dataroid makes it easy to connect existing infrastructures and scale analytics capabilities as business needs evolve. Trusted by leading enterprises, Dataroid is already powering customer experience transformation for major banks, airlines, and other digital-first institutions, including Türkiye İş Bankası, Garanti BBVA, ING, Pegasus Airlines, and Azercell, among others. These organizations rely on Dataroid to better understand their customers, optimize digital experiences, and increase lifetime value. Today, Dataroid’s technology helps reshape the digital journeys of over 120 million users worldwide, driving measurable impact through data intelligence, real-time engagement, and continuous optimization.

Average Rating: 4.7/5.0

Total Reviews: 96

How Do G2 Users Rate Dataroid?

  • Return: 10.0/10 (Category avg: 8.5/10)
  • Retention: 10.0/10 (Category avg: 8.6/10)
  • Engagement: 9.4/10 (Category avg: 8.7/10)
  • Has the product been a good partner in doing business?: 9.5/10 (Category avg: 9.1/10)

Who Is the Company Behind Dataroid?

  • Seller: Dataroid
  • Company Website:
  • HQ Location: Sariyer, TR
  • LinkedIn® Page: www.linkedin.com
    64 employees on LinkedIn®

Who Uses This Product?

  • Who Uses This: Product Manager
  • Top Industries: Banking, Financial Services
  • Company Size: 55% Large, 26% Medium

What Do G2 Reviewers Say About Dataroid?

AI-generated summary from verified user reviews

Pros
  • Users commend Dataroid for its excellent customer support, highlighting quick responses and valuable assistance in enhancing channels.
  • Users value the fast analytics and engagement capabilities of Dataroid, enabling quick and effective user targeting.
  • Users appreciate the ease of use of Dataroid, highlighting its intuitive features and responsive support team.
  • Users find the customer support and APIs of Dataroid extremely helpful, ensuring smooth integration and enhanced user experience.
  • Users value the rapid and effective audience engagement capabilities of Dataroid, enhancing user retention and campaign success.
Cons
  • Users face integration challenges with Dataroid, impacting access to essential features and increasing setup complexity.
  • Users find the limitations on attributes and data storage restrict their ability to perform in-depth analysis.
  • Users find missing features like limited engagement tools and short data retention hinder their analysis capabilities.
  • Users find the limit on event attributes restrictive, hindering advanced analytics and customization options for their needs.
  • Users face integration difficulties with Dataroid, hindering the use of essential features and causing frustration.

What Are Recent G2 Reviews of Dataroid?

What Are G2 Users Discussing About Dataroid?

WalkMe

WalkMe, an SAP company, is the critical layer that makes enterprise AI work. Copilots and AI agents are powerful, but incomplete. They can't see what's on an employee's screen, move across applications, or act where work actually happens. WalkMe can. Built on over a decade of experience in enterprise deployments, WalkMe gives AI the real-time context, cross-application reach, and workflow execution it needs to deliver results. WalkMe helps organizations adapt faster, make better decisions, and build a workforce that learns continuously. Trusted by global leaders including IBM, Nestlé, ThermoFisher Scientific, and the U.S. federal government, WalkMe turns AI investments into business outcomes. Visit www.walkme.com.

Average Rating: 4.6/5.0

Total Reviews: 578

How Do G2 Users Rate WalkMe?

  • Return: 8.2/10 (Category avg: 8.5/10)
  • Retention: 8.1/10 (Category avg: 8.6/10)
  • Engagement: 8.4/10 (Category avg: 8.7/10)
  • Has the product been a good partner in doing business?: 8.9/10 (Category avg: 9.1/10)

Who Is the Company Behind WalkMe?

  • Seller: SAP
  • Company Website:
  • Year Founded: 1972
  • HQ Location: Walldorf
  • LinkedIn® Page: www.linkedin.com
    149,349 employees on LinkedIn®
  • Ownership: NYSE:SAP

Who Uses This Product?

  • Who Uses This: Instructional Designer, Digital Adoption Specialist
  • Top Industries: Computer Software, Financial Services
  • Company Size: 61% Large, 27% Medium

What Do G2 Reviewers Say About WalkMe?

AI-generated summary from verified user reviews

Pros
  • Users value the ease of use of WalkMe, citing its intuitive interface and smooth navigation through complex processes.
  • Users value the helpful support from WalkMe's team, enhancing their learning and overall satisfaction with the platform.
  • Users praise WalkMe's responsive customer support, noting quick resolutions and assistance, enhancing overall user experience.
  • Users love WalkMe for its intuitive guidance and powerful analytics, enhancing user experience and boosting productivity remarkably.
  • Users commend the effective training courses of WalkMe, enhancing user confidence and streamlining the learning process.
Cons
  • Users face a challenging learning curve, particularly with advanced workflows and custom setups requiring technical expertise.
  • Users find complexity in setup with WalkMe, noting it slows down workflows and requires more technical knowledge.
  • Users note a steep learning curve with WalkMe, especially for advanced features and initial setup complexity.
  • Users find limited customization options in WalkMe frustrating, hindering their ability to tailor the experience effectively.
  • Users find the setup process time-consuming, especially for advanced workflows and dynamic elements in SAP systems.

What Are Recent G2 Reviews of WalkMe?

What Are G2 Users Discussing About WalkMe?

AppFollow

AppFollow makes it easy to understand and elevate your app’s reputation. AppFollow is an integrated service for working with app stores. It includes tools for review management and automation, organic app performance analysis, competitor research, app performance monitoring, and analysis. AppFollow makes it easy to understand and elevate your app’s reputation. We help more than 100K+ users to utilize data across the app lifecycle to build successful apps with the power of our tools: — app performance monitor; — user review engagement tools; — app growth acceleration tools; — review management automation; — a vast number of integrations with Salesforce, Zendesk, Slack, Helpshift, Tableau, and more.

Average Rating: 4.6/5.0

Total Reviews: 190

How Do G2 Users Rate AppFollow?

  • Return: 9.2/10 (Category avg: 8.5/10)
  • Retention: 9.2/10 (Category avg: 8.6/10)
  • Engagement: 10.0/10 (Category avg: 8.7/10)
  • Has the product been a good partner in doing business?: 9.1/10 (Category avg: 9.1/10)

Who Is the Company Behind AppFollow?

Who Uses This Product?

  • Who Uses This: CEO, Social Media Manager
  • Top Industries: Information Technology and Services, Computer Games
  • Company Size: 65% Small, 23% Medium

What Do G2 Reviewers Say About AppFollow?

AI-generated summary from verified user reviews

Pros
  • Users appreciate the ease of use of AppFollow, simplifying review tracking and management with robust features.
  • Users appreciate the efficiency of AI integration in AppFollow, streamlining review tracking and response processes.
  • Users value the centralization of reviews in AppFollow, simplifying app store optimization and user feedback management.
  • Users value the efficient AI review responses and strong ASO tools for sustained business growth with AppFollow.
  • Users love the centralized management of AppFollow, efficiently streamlining both app store optimization and user feedback.
Cons
  • Users experience data inaccuracy with AppFollow, as the AI sometimes displays incorrect Google Play Console ratings.
  • Users consider the pricing to be on the higher side, which may be challenging for smaller businesses or developers.
  • Users desire improvements in multi-site review selection for easier access to comments from both platforms simultaneously.
  • Users report occasional inaccuracies in rating information from AppFollow, leading to confusion about app performance.
  • Users wish for better review management by allowing simultaneous selection of CH Play and App Store for easier access.

What Are Recent G2 Reviews of AppFollow?

What Are G2 Users Discussing About AppFollow?

Adapty.io

Adapty helps mobile developers analyze and grow in-app subscriptions, integrate in-app purchases within a few hours, and run monetization experiments faster and cheaper. - Test prices of in-app purchases without app releases. - Integrate IAPs within a few hours with a simple, developer-friendly SDK. No server coding required. - Double your subscription revenue in 3 months with A/B testing for paywalls. - Measure your in-app economy from trials to refunds with real-time analytics. 99.5% accuracy with App Store Connect.

Average Rating: 4.7/5.0

Total Reviews: 253

How Do G2 Users Rate Adapty.io?

  • Return: 8.7/10 (Category avg: 8.5/10)
  • Retention: 8.9/10 (Category avg: 8.6/10)
  • Engagement: 8.6/10 (Category avg: 8.7/10)
  • Has the product been a good partner in doing business?: 9.4/10 (Category avg: 9.1/10)

Who Is the Company Behind Adapty.io?

  • Seller: Adapty.io
  • Year Founded: 2020
  • HQ Location: New York, US
  • LinkedIn® Page: www.linkedin.com
    152 employees on LinkedIn®

Who Uses This Product?

  • Who Uses This: CEO, Co-Founder
  • Top Industries: Computer Software, Health, Wellness and Fitness
  • Company Size: 89% Small, 7% Medium

What Do G2 Reviewers Say About Adapty.io?

AI-generated summary from verified user reviews

Pros
  • Users value the ease of use of Adapty.io, enabling quick setup and intuitive navigation for monetization strategies.
  • Users appreciate the comprehensive features of Adapty.io, enjoying effortless A/B testing and powerful analytics for in-app purchases.
  • Users value the seamless paywall management of Adapty.io, enhancing convenience and flexibility in subscription strategies.
  • Users value the quick and efficient A/B testing capabilities of Adapty, enabling rapid monetization strategies.
  • Users appreciate the responsive and helpful customer support at Adapty.io, essential for successful monetization strategies.
Cons
  • Users find the paywall issues concerning, as many features essential for normal use are locked behind a subscription.
  • Users find the limited features of Adapty.io restrictive, especially with many essential tools hidden behind a paywall.
  • Users are frustrated by the expensive subscription model, as many essential features are only available to premium users.
  • Users find feature limitations frustrating, especially with many options locked behind premium subscriptions and minimal functionality for free users.
  • Users desire a broader feature set in Adapty.io's free tier, highlighting delays in promised updates.

What Are Recent G2 Reviews of Adapty.io?

What Are G2 Users Discussing About Adapty.io?

Adam Crivello
AC
Researched and written by Adam Crivello
Updated October 3, 2024

Learn More About Mobile App Analytics Tools

What is Mobile App Analytics Software?

The increased presence and influence of mobile devices has driven the necessity for mobile applications—and by extension, mobile app analytics software. Whether designed for e-commerce, gaming, finance, productivity, loyalty programs, or otherwise, there seems to be an application for almost anything one can imagine. Because of this lasting trend towards mobility, businesses are pushing hard to get their service or product out onto the mobile landscape.

There is a need to understand how users interact with the applications one has built for their business. An app is only valuable if people are actually using it with any sense of regularity, and the ability to interact with the app easily or conveniently can play a huge role in whether the app succeeds. Mobile app analytics solutions allow companies to examine how users interact with their apps, providing all kinds of data including the type of device users are accessing from, how long they spend on pages in the app, how frequently a user opens the app, and more. The result is a data-driven picture of an app’s performance and how it fits into the marketplace.

Using mobile app analytics software gives companies real-time data that informs continued product development. Depending on the tool used, teams can gain insight into unforeseen issues with new software updates, track usage patterns by demographics such as age and location, and more. Leveraging this data, development teams can constantly maintain and update their app’s interface to encourage the most desirable user journeys through their apps. If sudden, irregular patterns emerge, such as a sharp decline in traffic that might indicate downtime, mobile app analytics software can automatically alert teams via notifications to ensure a rapid response.

Overall, mobile app analytics software gives teams an invaluable set of monitoring tools, data-gathering functions, and dashboards which allows them to manage their released applications in a way that reflects and responds to real user experiences. 

What are the Common Features of Mobile App Analytics Software?

The following are some core features within mobile app analytics software:

OS-based tracking: Mobile app analytics tools need to be able to evaluate app performance based on the mobile operating system (OS) the app is running on. iOS and Android are the biggest players in mobile OS, but they are not the only platforms that mobile apps can run on. Some mobile app analytics solutions will also track the device type running an OS, accounting for other niche or proprietary systems and the respective OS version, for trending and further data analysis.

Session analytics: The most basic mobile app analytics tool feature, session analytics, informs teams on the basics of how a user’s time is spent in an app. How long the app was used, wherein the app users went, and the kinds of activities they performed with the app are all valuable pieces of information that every company will want to know about their user audience.

Regional analytics: Understanding where, geographically, users are accessing an application can give companies unique insights into their user base. This type of data can enable more effective targeted advertising, and it can generate particularly interesting insights and trends when combined with other usage data like carrier, device, and time spent using the app.

Date filtering: Understanding usage data in the context of timeframes can lead to beneficial insights for one’s business. Aside from the more obvious analysis of app intelligence—for example, understanding how bug fixes affect rates of usership—businesses can garner more subtle insights, such as how usership changes after implementing subtle user interface updates or backend performance overhauls.

Audience analytics: Is the application free, or does it require a one-time purchase? Does the application have paid features? Understanding how free and paid audience members interact with an app can give teams better insight into how the price of their application affects the way users interact with the app in their day to day.

Market trends: It is as important to understand how a company’s apps compare to other apps on the market as it is to understand the users’ in-app activity. For an application to compete, the business needs to understand exactly what it is competing against. Mobile app analytics tools should provide market intelligence so that a business can always understand how its apps are performing in context with the market as a whole.

Reporting: As with any analytics tool, reporting is a powerful way of consolidating key information into an easily digestible format. Mobile app analytics tools should be able to turn out reports regarding any data factor it tracks, allowing companies to get summaries of any possible data they might find to be important.

Data visualization: This works similarly to the reporting functionality of other analytics tools. Data visualization—the process of turning raw data into charts, graphs, and other forms of visual representations—is a perfect at-a-glance representation of an app’s users, functions, and success. Data visualizations can be highly valuable for revealing trends in data that might otherwise be lost under the sheer volume that is captured by a mobile app analytics tool.

Code performance analysis: Occurrences that negatively affect the user experience might originate from the application’s code. Some mobile app analytics tools will track performance down to the code level, which can reveal any code segments that are performing suboptimally.

Network filtering: Understanding users’ networks can help lead to a better overall user experience. WiFi and carrier networks each have their connection strengths and consistencies, and some mobile app analytics tools will allow the filtering of performance data based on the method of network connection or other distinguishing network-adjacent traits like carrier name or region.

Other Features of Mobile App Analytics Tools: Heat maps, Session replay

What are the Benefits of Mobile App Analytics Software?

Usage insights: What pages get the most traffic? What about the least? How often do users buy after putting an item in the app’s cart? What page do users bounce (leave the app) from the most? How much time do users spend in the app? These questions and more can all be answered with mobile app analytics solutions. Mobile app analytics tools focus on allowing businesses to leverage usage data into data-driven insights, helping them make better decisions about the app’s future direction and build.

Carrier and device insights: The impact that certain carriers, devices, and operating systems can have on an app’s functionality and overall success tends to be overlooked. Mobile app analytics tools can offer insights into these factors. Such insights can help expose potential incompatibilities an app might have with the targeted user demographic. Armed with that information, developers can update the app to better fit its users’ preferences.

Performance insights: While mobile app analytics software might not provide log outputs comparable to those of software testing tools, companies can discern other functional issues from their data. Notice a page or feature is rarely used? Maybe a disproportionate number of app closures after the loading of a specific app page? These might be indicators that something is not functioning properly on those pages and can inform developers to reexamine that build.

Who Uses Mobile App Analytics Software?

Mobile app analytics tools can provide significant, valuable insights for a business. While different teams might find value in different elements of this software, the following list rounds up the most common team members who would most regularly interact with mobile app analytics tools.

Product managers: These users find value in mobile app analytics tools’ application quality of life (QoL) tracking. Changes in application QoL affect application usage and performance. The high-level insights drawn from mobile app analytics tools can help create a more well-informed product direction and improve the overall quality of an application.

Data analysts: Data analysts should find significant value in mobile app analytics tools. The volume of data at their disposal allows data analysts to craft in-depth insights around numerous aspects of an application’s performance. Additionally, the in-software visualization and filtering features can help clarify the mass of data points that mobile app analytics generate.

Application developers: Using mobile app analytics tools, application developers can specifically target application workflows for optimization or upkeep based on data. In-depth analytics around user interactions, region and network data, and code performance can be extremely valuable toward improving an application’s build and client-side operation.

Marketing teams: Marketing teams can take the information collected by mobile app analytics tools and turn them into more effective targeted marketing campaigns. While some of the more technical in-app performance data might not be as useful to these teams, marketers can lean on invaluable resources like demographic, regional, and carrier data as they move toward a more well-informed marketing campaign.

Software Related to Mobile App Analytics Software

Related solutions that can be used together with Mobile App Analytics Software include:

Digital analytics software: Digital analytics software performs many of the same functions that mobile app analytics solutions do but specifically focused on website traffic and web page activity. Combining these two software resources can give businesses a more complete look at how customers interact with their digital offerings.

Mobile app optimization software: Focusing more on user interaction with an application rather than user habits, mobile app optimization software helps companies better solicit the most advantageous user interactions with an application. Mobile app optimization tools focus on the most and least used aspects of an app, explore trends in app usage, and help turn that data into actionable insights.

Challenges with Mobile App Analytics Software

Software solutions can come with their own set of challenges. 

Overtracking: Overtracking can be a real issue for businesses. Because mobile app analytics solutions offer the ability to track so many aspects of an app’s existence, it is incredibly tempting to try to track all of it. Companies need to be sure to track and analyze what is important for their app’s success, and this may differ from company to company. For example, mobile video game app companies will want to track different data points than a retailer might for their store’s mobile app. If a business cannot fight the temptation to track every little aspect, it is really easy to get lost in the data and, in turn, the data will end up polluting its analysis with nonfactors.

Device attribution: Mobile devices, as a hardware archetype, are composed of a massive collection of device manufacturers, data carriers, and operating system variations. For a mobile app analytics solution to be truly effective, it has to be able to analyze application events in context with the hardware and software the application is run on. Failure to properly capture these details could mean missing out on version, hardware, or carrier-influenced problems, leading to increased time in troubleshooting issues.

Data security: As mentioned above, a hot topic with app analytics is the extent to which user data is tracked and secured. Because of how much data can be acquired about users with app analytics tools, data security and data privacy are genuine and valid concerns. When using a mobile app analytics tool, businesses should also be investing in data security solutions.

How to Buy Mobile App Analytics Software

G2’s reviews from authentic software buyers can serve as a great anchor point for any company ready to start the search for a mobile app analytics solution. With that in mind, there are a few important criteria to consider when looking for the right tool.

Features: Different mobile app analytics software tools can have quite different feature sets. One solution might focus on highly detailed user journeys while another may be able to provide insight into the device models an app’s audience is using. The best fit solution will vary depending on the data that an organization finds most valuable. Authentic G2 reviews made by peers from similar companies can shed light on these factors. A prioritized list of the business’ most desired features enables the software selection team to move forward with a clear idea of what to look for.

Security: Collecting user data is a highly sensitive undertaking that requires constantly up-to-date security and compliance. When searching for a mobile app analytics solution, companies should ensure that the software they’d like to use has a verified history of compliance and high-security standards to protect user data. In some cases, separate data security solutions are preferred to help ensure security compliance and privacy.