Best Financial Research Software

How Many Financial Research Software Products Does G2 Track?

Total Products under this Category: 314

Category Stats (Sep 2026)

  • Average Rating: 4.52/5 (↑0.01 vs Aug 2026) The average rating of products in this category, based on all submitted ratings
  • Top Trending Product: Dasseti ENGAGE (+1.76%) - Among all products in this category, Dasseti ENGAGE recorded the largest rating increase compared to last month

Last updated: September 15, 2026

How Does G2 Rank Financial Research Software Products?

Why You Can Trust G2's Software Rankings:

  • 30 Analysts and Data Experts
  • 4,000+ Authentic Reviews
  • 314+ Products
  • Unbiased Rankings

G2's software rankings are built on verified user reviews, rigorous moderation, and a consistent research methodology maintained by a team of analysts and data experts. Each product is measured using the same transparent criteria, with no paid placement or vendor influence. While reviews reflect real user experiences, which can be subjective, they offer valuable insight into how software performs in the hands of professionals. Together, these inputs power the G2 Score, a standardized way to compare tools within every category.

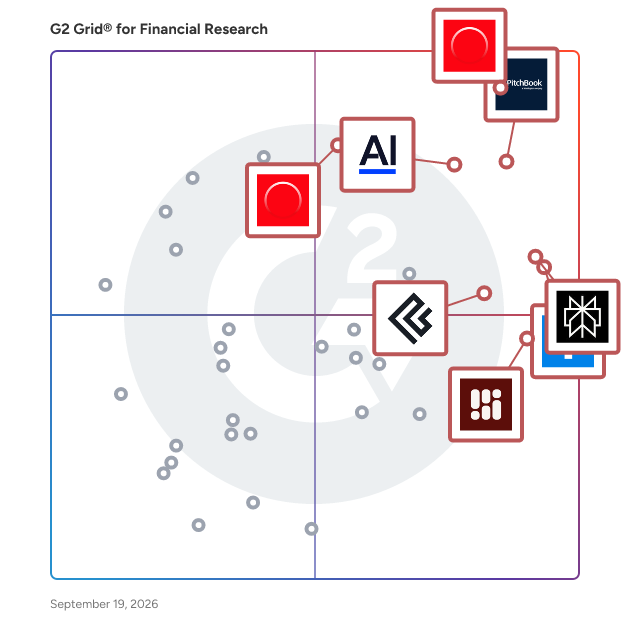
G2 Grid® for Financial Research Software

G2 Grid® for Financial Research Software plotting products by satisfaction and market presence

Highlighted products: Morningstar Direct, PitchBook, AlphaSense, YCharts, Perplexity, Morningstar Direct Advisory Suite (formerly Advisor Workstation), Koyfin, and Inven.

Underlying data: [Grid® JSON](https://www.g2.com/categories/financial-research/grids.json?focus%5B%5D=morningstar-direct&focus%5B%5D=pitchbook&focus%5B%5D=alphasense&focus%5B%5D=ycharts&focus%5B%5D=perplexity&focus%5B%5D=morningstar-direct-advisory-suite-formerly-advisor-workstation&focus%5B%5D=koyfin&focus%5B%5D=inven)

Morningstar Direct

What is Morningstar Direct? Morningstar Direct is a global investment platform that combines in-depth data, institutional research, and industry-recognized ratings with powerful analytics, intuitive design, and robust reporting tools. With Morningstar Direct, professional investors can search and screen investments, perform competitive analysis, conduct manager research and due diligence, explore a portfolio’s full holdings and exposures, monitor performance, and generate easy-to-read, compliant reports at scale. Built on a comprehensive database of over 800,000 investments worldwide, Direct empowers users to make confident, data-driven decisions. Who is Morningstar Direct for? Morningstar Direct is designed for the complex workflows of asset and wealth management firms but is also valuable for other financial professionals. Typical users include portfolio managers, investment researchers, analysts, advisors, product and marketing teams, performance and risk analysts, and data scientists. Key Features: Investment Research & Discovery: Locate investments, explore data across asset classes, and refine securities using custom screens, datasets, and Morningstar’s trusted ratings. Portfolio Management & Analysis: Build resilient portfolios, stress test holdings, and conduct attribution analysis to understand performance drivers. Reporting & Communication: Create custom-branded reports, presentations, and scorecards with Morningstar’s data and analytics, ensuring impactful communication. Time-Saving Automation: Streamline workflows with tools like Presentation Studio and Report Portal, enabling teams to generate reports and insights on demand. Morningstar Direct is the trusted partner for investment professionals seeking clarity, confidence, and tools to turn insights into action.

Average Rating: 4.1/5.0

Total Reviews: 438

How Do G2 Users Rate Morningstar Direct?

  • Financial Analysis: 7.5/10 (Category avg: 8.6/10)
  • Ease of Admin: 7.1/10 (Category avg: 8.7/10)
  • Charting: 7.6/10 (Category avg: 8.2/10)
  • Document Search: 5.7/10 (Category avg: 8.3/10)

Who Is the Company Behind Morningstar Direct?

  • Seller: Morningstar
  • Company Website:
  • Year Founded: 1984
  • HQ Location: Chicago, IL
  • Twitter: @MorningstarInc
    238,484 Twitter followers
  • LinkedIn® Page: www.linkedin.com
    11,991 employees on LinkedIn®

Who Uses This Product?

  • Who Uses This: Investment Analyst, Analyst
  • Top Industries: Financial Services, Investment Management
  • Company Size: 34% Small, 33% Large

What Do G2 Reviewers Say About Morningstar Direct?

AI-generated summary from verified user reviews

Pros
  • Users value the vast data accessibility of Morningstar Direct, making it a go-to for fund analysis.
  • Users appreciate the ease of use in Morningstar Direct, praising its simple setup and shareable templates.
  • Users value the comprehensive data in Morningstar Direct, enabling detailed insights and extensive reporting opportunities.
  • Users appreciate the breadth of data availability in Morningstar Direct, making data access and analysis seamless.
  • Users appreciate the ease of access to powerful tools and helpful customer support within Morningstar Direct.
Cons
  • Users find the poor usability of Morningstar Direct frustrating, citing complex menus and an unintuitive interface.
  • Users experience slow performance and frequent crashes, leading to disruptions and frustration during workflow with Morningstar Direct.
  • Users find Morningstar Direct to have a not user-friendly interface, making navigation and feature utilization challenging.
  • Users experience data inaccuracy with Morningstar Direct, leading to incorrect numbers and frustrating workflow interruptions.
  • Users find the difficult learning process of Morningstar Direct challenging, often requiring extensive support for navigation.

What Are Recent G2 Reviews of Morningstar Direct?

PitchBook

PitchBook is an all-in-one private capital market solution. Access vital data and insights on millions of companies, investors, professionals, and more with robust platform and intuitive features. PitchBook provides the most comprehensive, accurate, and timely private market intel so that you can work smarter, seize opportunities faster, execute strategies with confidence, and stay ahead of the competition.

Average Rating: 4.5/5.0

Total Reviews: 260

How Do G2 Users Rate PitchBook?

  • Financial Analysis: 8.0/10 (Category avg: 8.6/10)
  • Ease of Admin: 8.4/10 (Category avg: 8.7/10)
  • Charting: 7.5/10 (Category avg: 8.2/10)
  • Document Search: 7.5/10 (Category avg: 8.3/10)

Who Is the Company Behind PitchBook?

  • Seller: PitchBook Data
  • Company Website:
  • Year Founded: 2007
  • HQ Location: Seattle, WA
  • Twitter: @PitchBook
    48,994 Twitter followers
  • LinkedIn® Page: www.linkedin.com
    1,568 employees on LinkedIn®

Who Uses This Product?

  • Who Uses This: Analyst, Associate
  • Top Industries: Financial Services, Venture Capital & Private Equity
  • Company Size: 38% Small, 35% Large

What Do G2 Reviewers Say About PitchBook?

AI-generated summary from verified user reviews

Pros
  • Users value the data accessibility of PitchBook, enabling easy mobile access and real-time notifications for market insights.
  • Users commend the excellent customer support of PitchBook, ensuring a smooth and efficient user experience.
  • Users value PitchBook for its comprehensive database, facilitating informed investment decisions with ease and efficiency.
  • Users find PitchBook to be incredibly easy to use, benefiting from its intuitive interface and excellent customer support.
  • Users appreciate the ease of accessing comprehensive company information, enhancing their market research and strategic initiatives.
Cons
  • Users note that information can be outdated, requiring additional research to confirm company statuses and details.
  • Users note the limited and outdated data on smaller companies often necessitates additional research for accuracy.
  • Users often face data inaccuracy issues with PitchBook, including inconsistent company information and incorrect deal tagging.
  • Users find PitchBook to be expensive, especially for smaller organizations or those who don't utilize all features.
  • Users find company exclusions problematic, as important Canadian firms and real estate data are often missing from PitchBook.

What Are Recent G2 Reviews of PitchBook?

What Are G2 Users Discussing About PitchBook?

AlphaSense

Meet AlphaSense: the world's leading market intelligence and search platform. AlphaSense is a market intelligence platform used by the world’s top companies and financial institutions to help professionals make better business decisions with confidence and speed. Since 2011, our AI-based technology has delivered insights from an extensive universe of public and private content—including realtime and aftermarket broker research, expert calls, private company data, SEC filings, earnings transcripts, regulatory content, news and trade journals. Our platform is trusted by over 4,000 enterprise customers, including a majority of the S&P 500. For more information, please visit www.alpha-sense.com.

Average Rating: 4.6/5.0

Total Reviews: 347

How Do G2 Users Rate AlphaSense?

  • Financial Analysis: 7.7/10 (Category avg: 8.6/10)
  • Ease of Admin: 8.8/10 (Category avg: 8.7/10)
  • Charting: 6.4/10 (Category avg: 8.2/10)
  • Document Search: 9.3/10 (Category avg: 8.3/10)

Who Is the Company Behind AlphaSense?

  • Seller: AlphaSense
  • Company Website:
  • Year Founded: 2011
  • HQ Location: New York
  • Twitter: @AlphaSenseInc
    34,479 Twitter followers
  • LinkedIn® Page: www.linkedin.com
    3,341 employees on LinkedIn®

Who Uses This Product?

  • Who Uses This: Analyst, Associate
  • Top Industries: Financial Services, Pharmaceuticals
  • Company Size: 46% Large, 33% Small

What Do G2 Reviewers Say About AlphaSense?

AI-generated summary from verified user reviews

Pros
  • Users appreciate the ease of use of AlphaSense, enjoying efficient access to valuable insights and time-saving summaries.
  • Users value the search functionality of AlphaSense, enabling access to unique presentations and timely data easily.
  • Users value the top-notch content and user-friendliness of AlphaSense, enhancing their market research experience significantly.
  • Users value the advanced AI capabilities of AlphaSense for efficient competitive monitoring and insightful data summaries.
  • Users appreciate the helpful support and intuitive interface of AlphaSense, enhancing their research capabilities significantly.
Cons
  • Users find the search functionality lacking, struggling to filter for high-quality articles and avoid irrelevant results.
  • Users express frustration over insufficient information, particularly the need for more structured industry reports and documentation.
  • Users find the difficult learning curve of AlphaSense challenging, often requiring more time and familiarity to use effectively.
  • Users find the learning difficulty of AlphaSense frustrating, often needing to rely on others for assistance.
  • Users note a lack of information accessibility in AlphaSense, often struggling to find relevant reports and data efficiently.

What Are Recent G2 Reviews of AlphaSense?

What Are G2 Users Discussing About AlphaSense?

Perplexity

Perplexity is an AI-powered search engine designed to transform how users discover and interact with information. By processing user queries through advanced language models, it delivers concise, conversational answers backed by verifiable sources. Each response includes citations and links to original content, enabling users to verify information and delve deeper into topics. This approach streamlines the search experience, moving beyond traditional search engines that present numerous links for users to sift through. Key Features and Functionality: - Conversational Search Interface: Users can ask questions in natural language and receive direct, concise answers. - Real-Time Web Integration: The platform searches the web in real-time to provide up-to-date information. - Source Citations: Each response includes citations and links to original sources, ensuring transparency and credibility. - Multiple AI Model Integration: Perplexity integrates cutting-edge AI models, including OpenAI's GPT models and Anthropic's Claude, allowing users to choose the model that best fits their specific needs. - Freemium Model: Offers a free version with access to a proprietary large language model, while the paid Perplexity Pro subscription provides access to advanced models like GPT-4, Claude 3, Mistral Large, Llama 3, and an experimental Perplexity model. Primary Value and User Solutions: Perplexity addresses the inefficiencies of traditional search engines by providing direct, concise answers to user queries, eliminating the need to sift through numerous links. Its integration of multiple AI models and real-time web search capabilities ensures that users receive accurate and current information. The inclusion of source citations enhances transparency and trustworthiness, making it a valuable tool for researchers, professionals, and the general public seeking reliable information efficiently.

Average Rating: 4.4/5.0

Total Reviews: 355

How Do G2 Users Rate Perplexity?

  • Financial Analysis: 8.0/10 (Category avg: 8.6/10)
  • Ease of Admin: 9.0/10 (Category avg: 8.7/10)
  • Charting: 5.6/10 (Category avg: 8.2/10)
  • Document Search: 8.1/10 (Category avg: 8.3/10)

Who Is the Company Behind Perplexity?

  • Seller: Perplexity AI
  • Year Founded: 2022
  • HQ Location: San Francisco, California
  • Twitter: @perplexity_ai
    494,413 Twitter followers
  • LinkedIn® Page: www.linkedin.com
    1,372 employees on LinkedIn®

Who Uses This Product?

  • Who Uses This: Founder, Software Engineer
  • Top Industries: Information Technology and Services, Computer Software
  • Company Size: 54% Small, 17% Medium

What Do G2 Reviewers Say About Perplexity?

AI-generated summary from verified user reviews

Pros
  • Users praise the ease of use of Perplexity, highlighting its simple setup and intuitive interface for efficient research.
  • Users appreciate the ease of use and quick implementation of Perplexity, enhancing their research and learning experience.
  • Users find Perplexity extremely helpful for providing accurate data and quality content from trusted sources.
  • Users praise Perplexity for its easy setup, allowing for quick and seamless integration into their research workflows.
  • Users value Perplexity's multi-modal capabilities, enabling deep research and custom AI assistants for efficient workflows.
Cons
  • Users note the usage limitations of Perplexity, feeling restricted by the features available in the free version.
  • Users feel that Perplexity's answer quality needs improvement, particularly regarding complex topics and understanding human behavior.
  • Users feel that Perplexity has significant limitations in understanding human behavior, affecting answer accuracy and overall usability.
  • Users note the need for improved context understanding, as responses can be inaccurate or oversimplified.
  • Users experience inaccurate data from Perplexity, often needing to verify and correct outputs for reliability.

What Are Recent G2 Reviews of Perplexity?

YCharts

YCharts is an all-in-one platform for investment research, proposal generation, and risk/stress testing that is trusted by thousands of financial professionals. According to the 2025 Kitces Tech Report, YCharts leads the way in momentum and market-share growth and earns the highest satisfaction scores in risk and stress testing. With a 98% customer satisfaction rate and clients staying with us for an average of 8+ years, it’s clear teams rely on YCharts for the ideal balance of cost, capability, and user experience. Advisors use YCharts to make smarter investment decisions and communicate more effectively with clients—through FINRA-reviewed report templates, customizable dashboards, and comprehensive data coverage spanning equities, mutual funds, ETFs, and economic indicators. The platform also saves time with powerful stock and fund screeners, deep portfolio integrations, and a seamless Excel add-in. Join thousands of professionals who already trust YCharts, start a free trial today at www.ycharts.com.

Average Rating: 4.7/5.0

Total Reviews: 135

How Do G2 Users Rate YCharts?

  • Financial Analysis: 9.3/10 (Category avg: 8.6/10)
  • Ease of Admin: 9.5/10 (Category avg: 8.7/10)
  • Charting: 9.6/10 (Category avg: 8.2/10)
  • Document Search: 8.4/10 (Category avg: 8.3/10)

Who Is the Company Behind YCharts?

  • Seller: YCharts
  • Year Founded: 2009
  • HQ Location: Chicago, IL
  • Twitter: @ycharts
    40,578 Twitter followers
  • LinkedIn® Page: www.linkedin.com
    197 employees on LinkedIn®

Who Uses This Product?

  • Who Uses This: Financial Advisor
  • Top Industries: Financial Services, Investment Management
  • Company Size: 71% Small, 10% Medium

What Do G2 Reviewers Say About YCharts?

AI-generated summary from verified user reviews

Pros
  • Users value YCharts for its ease of use, featuring intuitive navigation and seamless integration with Excel tools.
  • Users praise the ease of use of YCharts, which enhances data access and simplifies client interactions.
  • Users highly value the exceptional customer support of YCharts, noting their knowledgeable and responsive assistance throughout the experience.
  • Users value detailed and accessible research data from YCharts, enhancing portfolio analysis and client communication.
  • Users appreciate the instant and accessible data YCharts provides, enhancing their financial analysis and client discussions.
Cons
  • Users find limited data availability in YCharts, lacking essential information for comprehensive analysis and reporting.
  • Users find YCharts to be expensive, often wishing for more affordable pricing and fewer additional costs.
  • Users face integration issues with YCharts, particularly with Redtail and custodian compatibility, limiting overall functionality.
  • Users find the difficult learning curve due to the vast capabilities of YCharts challenging despite its useful features.
  • Users face limited customization options in YCharts, making it challenging to tailor their investment experience effectively.

What Are Recent G2 Reviews of YCharts?

What Are G2 Users Discussing About YCharts?

Morningstar Direct Advisory Suite (formerly Advisor Workstation)

Morningstar Direct Advisory Suite (formerly Advisor Workstation) is a comprehensive software platform designed to empower financial advisors in delivering exceptional investment advice and managing client relationships. By combining advanced investment research, personalized planning tools, and seamless integrations, the suite simplifies operations, enhances client engagement, and supports informed decision-making. Key features include robust analytics for crafting investment plans aligned with client goals, compliance tools to ensure regulatory alignment, and the ability to generate FINRA-reviewed reports with visuals like portfolio comparisons. Advisors can also streamline workflows by integrating with CRMs, custodial platforms, and internal systems. The platform provides firmwide insights through enterprise dashboards, enabling advisory firms to track key metrics, identify growth opportunities, and standardize processes for consistent service delivery. Morningstar Direct Advisory Suite is ideal for financial advisors and firms seeking to optimize their practices, build trust, and scale their businesses while prioritizing client relationships.

Average Rating: 4.1/5.0

Total Reviews: 301

How Do G2 Users Rate Morningstar Direct Advisory Suite (formerly Advisor Workstation)?

  • Financial Analysis: 7.8/10 (Category avg: 8.6/10)
  • Ease of Admin: 7.7/10 (Category avg: 8.7/10)
  • Charting: 7.3/10 (Category avg: 8.2/10)
  • Document Search: 6.7/10 (Category avg: 8.3/10)

Who Is the Company Behind Morningstar Direct Advisory Suite (formerly Advisor Workstation)?

  • Seller: Morningstar
  • Company Website:
  • Year Founded: 1984
  • HQ Location: Chicago, IL
  • Twitter: @MorningstarInc
    238,484 Twitter followers
  • LinkedIn® Page: www.linkedin.com
    11,991 employees on LinkedIn®

Who Uses This Product?

  • Who Uses This: Financial Advisor, Financial Planner
  • Top Industries: Financial Services, Investment Management
  • Company Size: 61% Small, 24% Large

What Do G2 Reviewers Say About Morningstar Direct Advisory Suite (formerly Advisor Workstation)?

AI-generated summary from verified user reviews

Pros
  • Users value the comprehensive information available in Morningstar Direct Advisory Suite, enhancing their investment decisions.
  • Users praise the efficient data access of Morningstar Direct Advisory Suite, enhancing model comparisons and analysis.
  • Users value the easy analytics provided by Morningstar Direct, enabling effortless portfolio evaluation and insights.
  • Users find the ease of use in Morningstar Direct Advisory Suite allows for quick portfolio analysis and management.
  • Users appreciate the extensive research support of Morningstar Direct, enabling in-depth analysis of investments and portfolios.
Cons
  • Users find the interface not user-friendly, reporting challenges in navigation and accessing information effectively.
  • Users find the poor usability of Morningstar Direct Advisory Suite frustrating, citing clunky research areas and an outdated layout.
  • Users experience poor customer support, facing delays and unhelpful responses that hinder their overall productivity.
  • Users find the client organization confusing and lacking essential functionality compared to previous versions, causing clutter in reports.
  • Users find limited customization in Morningstar Direct Advisory Suite, hindering functionality and overall user experience.

What Are Recent G2 Reviews of Morningstar Direct Advisory Suite (formerly Advisor Workstation)?

Koyfin

Koyfin is a modern and cost-effective financial analytics platform used by over 50,000 financial advisors and wealth managers. It provides tools to create model portfolios, analyze client portfolios, create client proposals, and research stocks, ETFs, mutual funds, and macroeconomic data. Koyfin provides extensive financial data, customization options, and efficient workflows. Key Features: ▪️ Portfolio Tracking and Analysis: Monitor and analyze model portfolios and client portfolios with advanced metrics and visualizations. ▪️ Client Proposals and Reports: Create sleek, digestible client proposals and reports that are easy for ordinary investors to understand, unlike traditional tools that produce dense and complex reports. ▪️ Comprehensive Research Tools: Research stocks, ETFs, and mutual funds. Access extensive macroeconomic data. ▪️ Create Substitutions for Existing Portfolio Holdings: Identify and monitor substitution holdings to be prepared for model changes. ▪️ Intuitive Interface: Simplifies complex data analysis with visualization tools. ▪️ Collaboration: Easily share and collaborate on watchlists and portfolios with your team. ▪️ Affordability: Offers a cost-effective solution with transparent pricing. For more information, sign up for free at koyfin.com or contact help@koyfin.com

Average Rating: 4.8/5.0

Total Reviews: 134

How Do G2 Users Rate Koyfin?

  • Financial Analysis: 9.3/10 (Category avg: 8.6/10)
  • Ease of Admin: 9.3/10 (Category avg: 8.7/10)
  • Charting: 9.2/10 (Category avg: 8.2/10)
  • Document Search: 8.4/10 (Category avg: 8.3/10)

Who Is the Company Behind Koyfin?

  • Seller: Koyfin
  • Year Founded: 2016
  • HQ Location: New York, New Mexico, United States
  • Twitter: @KoyfinCharts
    74,086 Twitter followers
  • LinkedIn® Page: www.linkedin.com
    60 employees on LinkedIn®

Who Uses This Product?

  • Who Uses This: Financial Advisor
  • Top Industries: Financial Services, Investment Management
  • Company Size: 81% Small, 9% Medium

What Do G2 Reviewers Say About Koyfin?

AI-generated summary from verified user reviews

Pros
  • Users value Koyfin for its user-friendly interface, making data access and analysis straightforward and efficient.
  • Users appreciate Koyfin's intuitive user interface, which enhances efficiency and simplifies investment analysis and reporting.
  • Users value the ease of access and intuitive interface of Koyfin, enhancing their efficiency for investment analysis.
  • Users appreciate the user-friendly interface and customization options in Koyfin, enhancing their investment analysis efficiency.
  • Users value the extensive customization options in Koyfin, enhancing their market analysis and efficiency significantly.
Cons
  • Users find feature deficiencies in Koyfin, particularly in charting tools and financial data export options.
  • Users find Koyfin has limited data, particularly lacking in features for stock listings and UK market information.
  • Users express a desire for insufficient data available on Koyfin, especially for UK and FTSE 100 information.
  • Users find the difficult learning curve of Koyfin can be overwhelming and may hinder the initial experience.
  • Users feel Koyfin's pricing is a bit high for the portfolio outputs and many features require additional costs.

What Are Recent G2 Reviews of Koyfin?

Inven

Inven – AI for M&A Inven helps M&A teams see the full private market, map sectors in minutes, and find the targets others miss — across 28M+ companies. Trusted by 1,000+ investment banks, private equity firms, consultancies, and corporate development teams, Inven delivers traceable data, market-scale analysis, and decision-ready outputs. Join the world's leading M&A firms using Inven to: → Find 10× more relevant targets → Enrich hundreds of companies at one go → Map any market in minutes → Go from raw data to polished decks in a fraction of the time

Average Rating: 4.7/5.0

Total Reviews: 101

How Do G2 Users Rate Inven?

  • Financial Analysis: 6.2/10 (Category avg: 8.6/10)
  • Ease of Admin: 9.5/10 (Category avg: 8.7/10)
  • Charting: 6.1/10 (Category avg: 8.2/10)
  • Document Search: 5.9/10 (Category avg: 8.3/10)

Who Is the Company Behind Inven?

  • Seller: Inven
  • Company Website:
  • Year Founded: 2022
  • HQ Location: Helsinki, Uusimaa
  • Twitter: @inven_ai
    188 Twitter followers
  • LinkedIn® Page: www.linkedin.com
    96 employees on LinkedIn®

Who Uses This Product?

  • Who Uses This: Analyst
  • Top Industries: Venture Capital & Private Equity, Investment Banking
  • Company Size: 68% Small, 15% Medium

What Do G2 Reviewers Say About Inven?

AI-generated summary from verified user reviews

Pros
  • Users find Inven's ease of use exceptional, allowing quick onboarding and effortless access to valuable data.
  • Users praise Inven's efficient search functionality, enabling quick identification of relevant companies and opportunities globally.
  • Users value the integrated AI search functionality of Inven, enhancing precision in targeting and uncovering opportunities.
  • Users commend Inven for its effective target identification, enabling strategic decisions through reliable insights and user-friendly interface.
  • Users appreciate the time-saving capabilities of Inven, finding it easy to use and efficient for projects.
Cons
  • Users report inaccuracy in search results, resulting in irrelevant companies and increased manual filtering time.
  • Users experience company exclusion issues due to inaccurate contact info and unsuitable companies being displayed.
  • Users find the limited geographic coverage restricts valuable financial insights across Europe, affecting data completeness and quality.
  • Users face inadequate filtering in Inven, leading to irrelevant results and increased manual search efforts.
  • Users find that information can be outdated, requiring manual verification and limiting trust in the database accuracy.

What Are Recent G2 Reviews of Inven?

Crunchbase

Crunchbase defines predictive intelligence for private markets. We turn our proprietary data into private company forecasts that help your team spot emerging opportunities long before the competition. With predictions on funding, growth, exits, and risk grounded in best-in-class data, you gain the clarity to move early and win.

Average Rating: 4.4/5.0

Total Reviews: 408

How Do G2 Users Rate Crunchbase?

  • Financial Analysis: 8.5/10 (Category avg: 8.6/10)
  • Ease of Admin: 8.9/10 (Category avg: 8.7/10)
  • Charting: 8.2/10 (Category avg: 8.2/10)
  • Document Search: 8.0/10 (Category avg: 8.3/10)

Who Is the Company Behind Crunchbase?

  • Seller: Crunchbase
  • Company Website:
  • Year Founded: 2007
  • HQ Location: San Francisco, CA
  • Twitter: @crunchbase
    152,773 Twitter followers
  • LinkedIn® Page: www.linkedin.com
    245 employees on LinkedIn®

Who Uses This Product?

  • Who Uses This: Founder, Account Executive
  • Top Industries: Computer Software, Information Technology and Services
  • Company Size: 56% Small, 29% Medium

What Do G2 Reviewers Say About Crunchbase?

AI-generated summary from verified user reviews

Pros
  • Users find Crunchbase to be easy to use, streamlining prospecting with reliable information and efficient research tools.
  • Users value the data accuracy of Crunchbase, appreciating its up-to-date information and comprehensive resources for research.
  • Users find Crunchbase to be a comprehensive data source for deep research and insights into companies.
  • Users value the comprehensive information provided by Crunchbase, enhancing research and business development efforts effectively.
  • Users find Crunchbase's thorough contact information invaluable for company research and business development efforts.
Cons
  • Users find the pricing to be a downside, as costs are high for essential insights and features.
  • Users often face outdated information in Crunchbase, particularly affecting mid-market and non-US company profiles.
  • Users find the missing information in Crunchbase limiting, particularly for non-US businesses and mid-market companies.
  • Users feel the outdated data hinders comprehensive insights and timely information on investments and partnerships.
  • Users are frustrated by the limited data available for smaller or newer companies on Crunchbase, impacting their research.

What Are Recent G2 Reviews of Crunchbase?

What Are G2 Users Discussing About Crunchbase?

FactSet Workstation

The FactSet Workstation is a dynamic platform designed to empower financial professionals with seamless data access, advanced analytics, and intuitive technology. Integrating over 800 data sources across asset classes and markets, it consolidates crucial insights and elevates decision-making. Equipped with AI-powered tools, including smart search and chat features, the workstation simplifies complex workflows, enabling users to uncover insights quickly and improve collaboration. From research and portfolio construction to wealth management, the platform adapts to diverse needs, offering unparalleled configurability and real-time integration within existing workflows. With its focus on boosting productivity and streamlining processes, the FactSet Workstation is a solution built for success in fast-paced financial environments. For more information, visit www.factset.com.

Average Rating: 4.2/5.0

Total Reviews: 70

How Do G2 Users Rate FactSet Workstation?

  • Financial Analysis: 8.4/10 (Category avg: 8.6/10)
  • Ease of Admin: 7.7/10 (Category avg: 8.7/10)
  • Charting: 6.8/10 (Category avg: 8.2/10)
  • Document Search: 7.9/10 (Category avg: 8.3/10)

Who Is the Company Behind FactSet Workstation?

  • Seller: FactSet Research Systems
  • Company Website:
  • Year Founded: 1978
  • HQ Location: Norwalk, CT
  • Twitter: @FactSet
    121,234 Twitter followers
  • LinkedIn® Page: www.linkedin.com
    15,326 employees on LinkedIn®

Who Uses This Product?

  • Top Industries: Financial Services, Investment Management
  • Company Size: 46% Small, 27% Large

What Do G2 Reviewers Say About FactSet Workstation?

AI-generated summary from verified user reviews

Pros
  • Users value the ease of use and convenience of FactSet Workstation, appreciating its comprehensive data and simple layout.
  • Users appreciate the abundance of historical financial data provided by FactSet, enhancing their research capabilities significantly.
  • Users value the customization options in FactSet Workstation, enhancing research capabilities and team collaboration effectively.
  • Users find the ease of use of FactSet Workstation impressive, with essential tools centralized for efficient equity research.
  • Users value the comprehensive historical financial data of FactSet, enhancing research efficiency and simplifying analysis.
Cons
  • Users find poor usability in FactSet Workstation, struggling with clunky APIs and repetitive alerts affecting their workflow.
  • Users find the complexity of existing reports in FactSet limits potential improvements and user adaptability.
  • Users experience data inaccuracies with FactSet Workstation, including clunky Excel API and erroneous date filings.
  • Users find the difficult navigation of FactSet cumbersome, making it hard to locate specific information quickly.
  • Users note occasional inaccuracies in EV calculations, particularly related to payment space and cash treatment.

What Are Recent G2 Reviews of FactSet Workstation?

What Are G2 Users Discussing About FactSet Workstation?

Macrobond

Macrobond is an integrated research platform designed to eliminate inefficiencies in traditional financial research workflows. We replace siloed spreadsheets with a dynamic, fully connected environment powered by a robust time-series database and enriched with data from 2,400+ global and proprietary sources. Our platform supports the entire research lifecycle—from discovery and data management to analysis and publication—through flexible Desktop and API offerings. Economists, strategists, and investment professionals use Macrobond to work faster, think deeper, and deliver more compelling insights. By unifying high-quality macroeconomic and financial data with advanced analytics, automation, and collaboration tools, Macrobond provides a single source of truth that enhances efficiency, consistency, and confidence across research teams—whether working interactively on desktop or integrating data directly into internal systems via our API. Request a demo here: https://www.macrobond.com/demo

Average Rating: 4.7/5.0

Total Reviews: 51

How Do G2 Users Rate Macrobond?

  • Financial Analysis: 6.0/10 (Category avg: 8.6/10)
  • Ease of Admin: 8.7/10 (Category avg: 8.7/10)
  • Charting: 9.1/10 (Category avg: 8.2/10)
  • Document Search: 6.9/10 (Category avg: 8.3/10)

Who Is the Company Behind Macrobond?

  • Seller: Macrobond
  • Company Website:
  • Year Founded: 2008
  • HQ Location: London, UK
  • LinkedIn® Page: www.linkedin.com
    301 employees on LinkedIn®

Who Uses This Product?

  • Top Industries: Financial Services, Consulting
  • Company Size: 45% Large, 31% Small

What Do G2 Reviewers Say About Macrobond?

AI-generated summary from verified user reviews

Pros
  • Users value the easy integrations of Macrobond, streamlining data handling and enhancing productivity across platforms.
  • Users value the ease of use of Macrobond, finding it powerful and time-saving for data management.
  • Users value the efficiency of Macrobond, finding it a powerful time-saving tool in their workflow.
  • Users appreciate the data accessibility of Macrobond, finding it easy to chart and integrate with other tools.
  • Users value the all-in-one data solution of Macrobond, appreciating its intuitive UI and comprehensive analytics capabilities.
Cons
  • Users find Macrobond's interface complex, navigating multiple functions can be overwhelming and challenging for average users.
  • Users find the search functionality lacking, often leading to challenges in navigating the extensive database effectively.
  • Users find limited data on individual companies in Macrobond, missing deeper market insights found in competitors.
  • Users find the poor usability of Macrobond overwhelming, especially with complex tools and an unintuitive interface.
  • Users note a difficult learning curve with Macrobond, making complex analyses challenging and less intuitive to navigate.

What Are Recent G2 Reviews of Macrobond?

S&P Capital IQ Pro

The S&P Capital IQ Pro platform combines fundamental data with sector-specific metrics and analytics that are relevant to the industries we cover, plus key asset data, mapping tools, regulatory insight, and more.

Average Rating: 4.3/5.0

Total Reviews: 67

How Do G2 Users Rate S&P Capital IQ Pro?

  • Financial Analysis: 9.7/10 (Category avg: 8.6/10)
  • Ease of Admin: 7.8/10 (Category avg: 8.7/10)
  • Charting: 10.0/10 (Category avg: 8.2/10)
  • Document Search: 9.7/10 (Category avg: 8.3/10)

Who Is the Company Behind S&P Capital IQ Pro?

  • Seller: S&P Global
  • HQ Location: New York, NY
  • Twitter: @SPGlobal
    47,349 Twitter followers
  • LinkedIn® Page: www.linkedin.com
    40,459 employees on LinkedIn®
  • Ownership: NYSE: SPGI

Who Uses This Product?

  • Who Uses This: Associate
  • Top Industries: Financial Services, Investment Banking
  • Company Size: 37% Large, 32% Medium

What Are Recent G2 Reviews of S&P Capital IQ Pro?

What Are G2 Users Discussing About S&P Capital IQ Pro?

Gain

Gain is the Private Markets Super App, a connected global platform transforming how leading investors, advisors, and corporates source, evaluate, and execute deals. By combining investment-grade intelligence, AI-powered workflows, and your team’s proprietary data in one unified platform, Gain enables top deal teams to move faster, reduce risk, and build conviction with confidence. Gain is trusted across more than $1 trillion of private capital, used by 100% of MBB and Big Four firms, and by 80% of the world’s top 20 M&A advisory houses. Recognized for fast innovation and impact, Gain has been named both US and EU Data Provider of the Year by PE Wire, awarded Global Financial Market Review’s Best Use of AI in Finance, and ranked in Sifted’s Top 100 Fastest-Growing Companies, the Forbes 1000, and the Deloitte Technology Fast 50. Gain operates globally with offices in New York, London, Amsterdam, Frankfurt, Warsaw, and Bangalore.

Average Rating: 4.5/5.0

Total Reviews: 66

How Do G2 Users Rate Gain?

  • Financial Analysis: 8.9/10 (Category avg: 8.6/10)
  • Ease of Admin: 8.5/10 (Category avg: 8.7/10)
  • Charting: 7.7/10 (Category avg: 8.2/10)
  • Document Search: 7.6/10 (Category avg: 8.3/10)

Who Is the Company Behind Gain?

  • Seller: Gain
  • Company Website:
  • Year Founded: 2018
  • HQ Location: Amsterdam, Netherlands
  • LinkedIn® Page: www.linkedin.com
    572 employees on LinkedIn®

Who Uses This Product?

  • Top Industries: Venture Capital & Private Equity, Financial Services
  • Company Size: 35% Small, 33% Large

What Do G2 Reviewers Say About Gain?

AI-generated summary from verified user reviews

Pros
  • Users commend the ease of use of Gain.pro, appreciating its simple interface for quick and reliable insights.
  • Users highly value the comprehensive and accurate information provided by Gain.pro for informed investment decisions.
  • Users value Gain.pro for its comprehensive data coverage, enabling insightful analysis and streamlined company searches.
  • Users commend Gain for its high data accuracy and fast insights into private companies across Europe.
  • Users praise the high accuracy of data on Gain, trusting it more than other platforms for informed decisions.
Cons
  • Users find the limited data insufficient for smaller enterprises and would prefer more quantitative insights.
  • Users are concerned about data inaccuracy, particularly regarding outdated financial information available on Gain.pro.
  • Users find the limited geographic coverage of Gain restricts access to essential company information.
  • Users find Gain to be a pricy solution, especially challenging for smaller teams with budget constraints.
  • Users find the lack of detail in reports limiting, particularly regarding quantitative market size for smaller enterprises.

What Are Recent G2 Reviews of Gain?

Wokelo AI

Wokelo is an Agentic AI platform for dealmaking and consulting, designed by domain experts to power sourcing, diligence, and strategy. Our domain-tuned LLMs think like dealmakers, integrating proprietary knowledge, licensed datasets, and public intelligence to produce cited, decision-ready outputs from unstructured information. Leading Private Equity, Venture Capital, Investment Banking, Consulting, and Corporate teams trust Wokelo to automate their investment workflows across the deal lifecycle and strategic initiatives.

Average Rating: 4.9/5.0

Total Reviews: 19

How Do G2 Users Rate Wokelo AI?

  • Financial Analysis: 8.9/10 (Category avg: 8.6/10)
  • Ease of Admin: 9.2/10 (Category avg: 8.7/10)
  • Document Search: 9.3/10 (Category avg: 8.3/10)

Who Is the Company Behind Wokelo AI?

Who Uses This Product?

  • Top Industries: Venture Capital & Private Equity
  • Company Size: 89% Small, 16% Large

What Do G2 Reviewers Say About Wokelo AI?

AI-generated summary from verified user reviews

Pros
  • Users praise Wokelo AI for its detailed insights delivery, making investment research straightforward and highly effective.
  • Users value Wokelo AI for its effective synthesis of information, significantly streamlining research and enhancing decision-making.
  • Users find Wokelo AI's efficient synthesis of research sources invaluable for saving time and enhancing report accuracy.
  • Users value the detailed insights provided by Wokelo AI reports, enhancing strategic decision-making and overall efficiency.
  • Users love the ease of use of Wokelo AI, facilitating rapid report creation and quick team implementation.
Cons
  • Users find that Wokelo AI has slow performance, as data generation can be time-consuming during urgent needs.
  • Users encounter inaccuracy issues with Wokelo AI, particularly in context storage and hallucination problems.
  • Users find the reports excessively detailed, contributing to a sense of information overload with Wokelo AI.
  • Users find the company exclusion feature inadequate, sometimes displaying irrelevant companies in the market map function.
  • Users express a desire for improved integration capabilities with other tools to enhance the overall experience.

What Are Recent G2 Reviews of Wokelo AI?

Hebbia AI

Hebbia is an advanced AI platform purpose-built for financial institutions to transform how analysts, bankers, and investors handle document-intensive workflows. Its flagship product, Matrix, serves as a co-pilot for finance, automating processes that rely on parsing and analyzing vast sets of PDFs, spreadsheets, and data rooms. How Matrix Works Matrix leverages large language models (LLMs) such as OpenAI and Anthropic, but extends them with agentic execution that decomposes financial queries into multi-step actions. The system presents results in a transparent data grid with citations, so teams can audit, verify, and collaborate in real time. Key Features Financial Data Analysis at Scale: Extracts and structures information from CIMs, loan agreements, credit models, and filings with unmatched speed and accuracy. Multi-Modal Processing: Handles PDFs, spreadsheets, redlines, emails, and nested tables seamlessly. Agentic Execution: Breaks down valuation, comps, and diligence queries into actionable steps for precise outcomes. Transparent AI Grid: Shows every reasoning step, making workflows auditable and collaborative. Enterprise-Grade Security: End-to-end encryption trusted by top investment banks and funds. The Value Matrix makes financial workflows up to ten times faster and more accurate. By automating the extraction, structuring, and analysis of millions of documents, Hebbia helps finance professionals overcome information overload and move from raw data to investment decisions in record time. Unlike generic LLM solutions, Hebbia integrates seamlessly with existing financial data sources and requires no custom model training—delivering immediate business value that compounds over time.

Average Rating: 4.4/5.0

Total Reviews: 51

How Do G2 Users Rate Hebbia AI?

  • Financial Analysis: 7.8/10 (Category avg: 8.6/10)
  • Ease of Admin: 8.7/10 (Category avg: 8.7/10)
  • Charting: 5.3/10 (Category avg: 8.2/10)
  • Document Search: 8.6/10 (Category avg: 8.3/10)

Who Is the Company Behind Hebbia AI?

  • Seller: Hebbia
  • Year Founded: 2020
  • HQ Location: New York, NY
  • LinkedIn® Page: www.linkedin.com
    192 employees on LinkedIn®
  • Phone: 212-655-5043

Who Uses This Product?

  • Top Industries: Financial Services, Information Technology and Services
  • Company Size: 44% Medium, 42% Small

What Do G2 Reviewers Say About Hebbia AI?

AI-generated summary from verified user reviews

Pros
  • Users find Hebbia AI's intuitive matrix and cognitive search features enhance productivity and streamline information extraction effectively.
  • Users appreciate the document management capabilities of Hebbia AI, streamlining workflows and enhancing research efficiency.
  • Users value the efficient document navigation of Hebbia AI, enhancing their ability to analyze insights quickly.
  • Users praise the user-friendly platform of Hebbia AI, enabling efficient navigation and extraction of key insights.
  • Users highlight the helpfulness of Hebbia AI, as it significantly streamlines document analysis and market research tasks.
Cons
  • Users find that the file management interface lacks intuitiveness, making organization and uploading cumbersome and challenging.
  • Users find usage limitations frustrating, particularly regarding integration with SharePoint and document uploading processes.
  • Users find the poor usability of Hebbia AI makes document organization and navigation frustrating, impacting efficiency.
  • Users find the uploading and managing files in Hebbia cumbersome, especially without Sharepoint integration availability.
  • Users report limited context understanding in Hebbia AI, leading to misalignment between queries and responses provided.

What Are Recent G2 Reviews of Hebbia AI?

Nathan Calabrese
NC
Researched and written by Nathan Calabrese
Updated October 3, 2024

Learn More About Financial Research Software

What is Financial Research Software?

Financial research software is vital for investment sector professionals that need to access up-to-date financial market information. They use products in this category to carry out in-depth research and analysis to make informed investment decisions. Financial services professionals use financial research software to conduct research to fuel strategic decisions, carry out analysis on potential mergers and acquisitions, and stay informed on market movements. Many financial research platforms are now AI-enabled, which augments their ability to conduct detailed analysis of potential investments to improve decision-making.

Key Benefits of Financial Research Software

  • Up-to-date market information
  • Investment analysis
  • Historical market data
  • Visualization tools

Why Use Financial Research Software?

Financial research software is extremely useful for investment professionals looking to obtain a solid understanding of potential investments.

Research potential investments — One of the main uses for financial research software is diving into potential investments. Investors use these platforms to stay updated on company news and examine the details of specific earnings calls, market moves, and more.

Stay current on market news — Staying current in the financial services world is vital to success, and financial research platforms make this possible. Financial research software gathers market data and news from various sources and compiles it into a searchable format, allowing users to digest relevant news items and craft narratives that support their investment choices.

Craft comprehensive financial strategy — In addition to driving investment choices in individual companies, financial research software helps investors develop comprehensive investment strategies across industries. This may include identifying potential mergers and acquisitions, opportunities, and pitfalls across various industries.

Who Uses Financial Research Software?

Financial services professionals, specifically investment advisors and fund managers, use financial research software most often. Business and market analysts will also use the software to predict trends and create compelling content based on accurate market data.

Investment advisors — Investment advisors are the most avid users of financial research software. They rely on these applications to fuel their decision-making, basing their investments on a sound base of information and reasonable assumptions made from historical data patterns they observe.

Analysts — Industry analysts use financial research software to conduct detailed trend analysis on the environment within certain sectors. The segmenting and reporting capabilities that financial research software provides allow analysts to write accurate predictions and analyze trends.

Consultants — Consultants leverage the insights gleaned from financial research software to give their clients comprehensive, data-grounded recommendations. These recommendations can include everything from investment advice to merger and acquisition strategy. The comprehensive information provided by financial research platforms can be used as a solid starting point for research into specific companies’ readiness for acquisition or to accrue information on potential acquisitions to consider. Analysis of the financial health of a company, rumors about potential company moves, product pipeline, and more, can all be of great value when making important decisions regarding who to acquire.

Financial Research Software Features

Financial research software often includes, but is not limited to, the following features:

Real-time alerts — Users receive real-time notifications based on keyword alerts the user inputs. This can be used to track a multitude of updates on many types of information, from regulatory actions to stock screening.

Document comparison — Documents are shared and compared with old versions, highlighting changes. This feature is useful for quick analysis on updated documents.

Team collaboration — This functionality allows teammates to engage in document sharing, note taking, annotations, and highlighting directly within relevant documents.

Financial data — It’s important for users to have direct access to financial data of multiple types, including: earnings call transcripts, SEC and global filings, broker research, etc.

Data comparison — Users can use this feature to compare different types of data in multiple fields.

Analytics — Some solutions include predictive analytical tools, which digest historical data and make informed predictions about future movements.

Integrations — Many users have other software. These solutions integrate with other financial services software.

Data visualization — This software often contains tools that create visual representations of data gathered by the system.

Reporting — Users can access prebuilt reporting templates, which craft reports according to user input. Investors can use these reports to help build out strategy based on historical data.

Potential Issues with Financial Research Software

Data newness — A key component of financial research software is the inclusion of updated market news and information. Investment decisions are made in real time, and any delay in information acquisition could lead to a poor investment choice. It is imperative that the data sources and the means by which the data is gathered work without issue.

Overabundance of data — The more data there is, the more difficult it is to make sense of. Financial research software provides access to so much information that it may be difficult to parse and extract relevant information. Users should be wary of getting lost in the sheer volume of information available and leverage the increasing number of financial research tools that are good at slicing relevant news to help users make sense of those large amounts of data.