Best Digital Analytics Software for Medium-Sized Businesses - Page 3

How Many Digital Analytics Software Products Does G2 Track?

Total Products under this Category: 329

Category Stats (Nov 2026)

  • Average Rating: 4.45/5 (↑0.01 vs Oct 2026) The average rating of products in this category, based on all submitted ratings
  • Top Trending Product: Plausible Analytics (+8.33%) - Among all products in this category, Plausible Analytics recorded the largest rating increase compared to last month

Last updated: November 01, 2026

How Does G2 Rank Digital Analytics Software Products?

Why You Can Trust G2's Software Rankings:

  • 30 Analysts and Data Experts
  • 41,900+ Authentic Reviews
  • 329+ Products
  • Unbiased Rankings

G2's software rankings are built on verified user reviews, rigorous moderation, and a consistent research methodology maintained by a team of analysts and data experts. Each product is measured using the same transparent criteria, with no paid placement or vendor influence. While reviews reflect real user experiences, which can be subjective, they offer valuable insight into how software performs in the hands of professionals. Together, these inputs power the G2 Score, a standardized way to compare tools within every category.

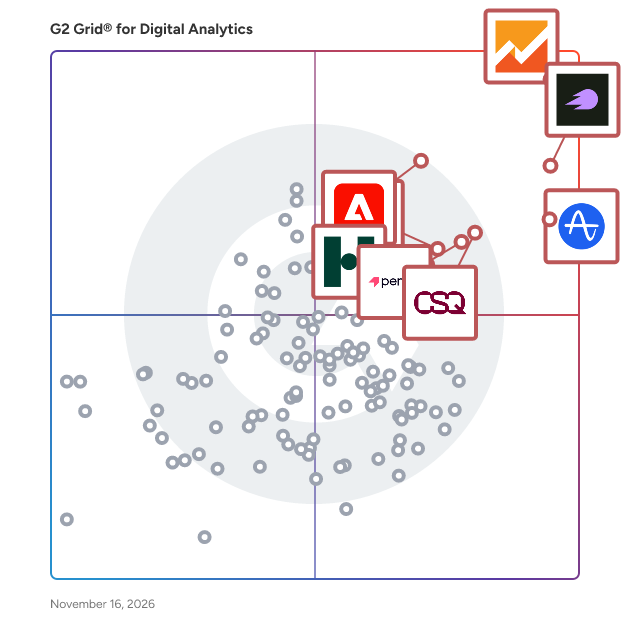
G2 Grid® for Digital Analytics Software

G2 Grid® for Digital Analytics Software plotting products by satisfaction and market presence

Highlighted products: Google Analytics, Semrush, Amplitude Analytics, Pendo, Contentsquare, Mixpanel, Adobe Analytics, and Funnel.

Underlying data: [Grid® JSON](https://www.g2.com/categories/digital-analytics/grids.json?focus%5B%5D=google-analytics&focus%5B%5D=semrush&focus%5B%5D=amplitude-analytics&focus%5B%5D=pendo-io-pendo&focus%5B%5D=contentsquare&focus%5B%5D=mixpanel&focus%5B%5D=adobe-analytics&focus%5B%5D=funnel&segment=mid-market)

Dataroid

Dataroid is an AI-powered, enterprise-grade digital analytics and customer engagement platform that enables companies to measure, analyze, and optimize customer interactions and experiences across multiple digital channels. Designed to unify fragmented data sources, Dataroid provides organizations with a single source of truth about their customers, helping them transform raw data into insights that drive growth, retention, and loyalty. At its core, Dataroid offers advanced product and customer journey analytics that allow businesses to deeply understand user behavior across every touchpoint. Teams can visualize customer paths through funnels and journey maps, identify friction points, optimize conversion flows, and deliver seamless experiences tailored to each user segment. With these tools, companies can continuously improve their digital products and create experiences that resonate. Dataroid’s platform combines enriched customer profiles, behavioral analytics, application performance monitoring, and predictive data modeling into a unified ecosystem that provides end-to-end visibility for marketing, product, and technology teams. Through customizable dashboards, teams can track KPIs, monitor engagement, and make faster, smarter decisions based on live data. Meanwhile, Dataroid’s Push and In-App Engagement capabilities enable personalized, context-aware communication with users, helping brands deliver the right message, to the right audience, at the right moment. Dataroid seamlessly collects and processes data from diverse digital touchpoints through its flexible SDKs and lightweight APIs, ensuring smooth integration with mobile apps, web platforms, and backend systems. This architecture allows companies to gather real-time behavioral, performance, and contextual data without compromising application speed or user experience. With adaptable deployment options and enterprise-grade security, Dataroid makes it easy to connect existing infrastructures and scale analytics capabilities as business needs evolve. Trusted by leading enterprises, Dataroid is already powering customer experience transformation for major banks, airlines, and other digital-first institutions, including Türkiye İş Bankası, Garanti BBVA, ING, Pegasus Airlines, and Azercell, among others. These organizations rely on Dataroid to better understand their customers, optimize digital experiences, and increase lifetime value. Today, Dataroid’s technology helps reshape the digital journeys of over 120 million users worldwide, driving measurable impact through data intelligence, real-time engagement, and continuous optimization.

Average Rating: 4.7/5.0

Total Reviews: 96

How Do G2 Users Rate Dataroid?

  • Sessions - Digital Analytics: 9.5/10 (Category avg: 8.8/10)
  • Engagement: 9.4/10 (Category avg: 8.7/10)
  • Trending: 9.2/10 (Category avg: 8.4/10)
  • Has the product been a good partner in doing business?: 9.5/10 (Category avg: 9.0/10)

Who Is the Company Behind Dataroid?

  • Seller: Dataroid
  • Company Website:
  • HQ Location: Sariyer, TR
  • LinkedIn® Page: www.linkedin.com
    64 employees on LinkedIn®

Who Uses This Product?

  • Who Uses This: Product Manager
  • Top Industries: Banking, Financial Services
  • Company Size: 55% Large, 26% Medium

What Do G2 Reviewers Say About Dataroid?

AI-generated summary from verified user reviews

Pros
  • Users commend Dataroid for its excellent customer support, highlighting quick responses and valuable assistance in enhancing channels.
  • Users value the fast analytics and engagement capabilities of Dataroid, enabling quick and effective user targeting.
  • Users appreciate the ease of use of Dataroid, highlighting its intuitive features and responsive support team.
  • Users find the customer support and APIs of Dataroid extremely helpful, ensuring smooth integration and enhanced user experience.
  • Users value the rapid and effective audience engagement capabilities of Dataroid, enhancing user retention and campaign success.
Cons
  • Users face integration challenges with Dataroid, impacting access to essential features and increasing setup complexity.
  • Users find the limitations on attributes and data storage restrict their ability to perform in-depth analysis.
  • Users find missing features like limited engagement tools and short data retention hinder their analysis capabilities.
  • Users find the limit on event attributes restrictive, hindering advanced analytics and customization options for their needs.
  • Users face integration difficulties with Dataroid, hindering the use of essential features and causing frustration.

What Are Recent G2 Reviews of Dataroid?

What Are G2 Users Discussing About Dataroid?

Medallia Digital Experience Analytics (DXA)

Digital leaders rely on feedback as the lifeblood of their experience program. But what happens when customers leave confusing, inactionable feedback? Or when customers don’t leave feedback at all? Go beyond feedback and exceed customers expectations with Medallia Digital Experience Analytics (DXA). Medallia DXA contextualizes every piece of feedback with relevant behavioral insights, so teams can take action on what customers say and what they do, driving organization-wide impact.

Average Rating: 4.4/5.0

Total Reviews: 34

How Do G2 Users Rate Medallia Digital Experience Analytics (DXA)?

  • Sessions - Digital Analytics: 8.5/10 (Category avg: 8.8/10)
  • Engagement: 8.6/10 (Category avg: 8.7/10)
  • Trending: 7.4/10 (Category avg: 8.4/10)
  • Has the product been a good partner in doing business?: 9.5/10 (Category avg: 9.0/10)

Who Is the Company Behind Medallia Digital Experience Analytics (DXA)?

  • Seller: Medallia
  • Year Founded: 2001
  • HQ Location: San Francisco, CA
  • LinkedIn® Page: www.linkedin.com
    2,765 employees on LinkedIn®
  • Phone: 650-321-3000

Who Uses This Product?

  • Top Industries: Insurance, Telecommunications
  • Company Size: 50% Large, 36% Medium

What Do G2 Reviewers Say About Medallia Digital Experience Analytics (DXA)?

AI-generated summary from verified user reviews

Pros
  • Users appreciate the visibility into real customer behavior provided by Medallia DXA, enhancing decision-making for improvements.
  • Users appreciate the visual communication of insights in Medallia DXA, enhancing stakeholder alignment and decision-making.
  • Users appreciate the ease of use of Medallia DXA, which simplifies understanding customer behavior and sharing insights.
  • Users value the variety of features in Medallia DXA, enhancing insights into customer behavior and journey analysis.
  • Users value the visual filtering options in Medallia DXA, enhancing understanding of customer behavior and improving decision-making.
Cons
  • Users find the manual effort for insights extraction in Medallia DXA burdensome, affecting overall efficiency and adoption.
  • Users find the complex configuration of Medallia DXA to be time-consuming and challenging for effective adoption.
  • Users find Medallia DXA's complex features require significant manual effort, hindering efficient use and adoption.
  • Users find the setup complexity of Medallia DXA burdensome, requiring significant manual effort and ongoing resource attention.
  • Users find complex querying in Medallia DXA burdensome, requiring significant manual effort and slowing down adoption efforts.

What Are Recent G2 Reviews of Medallia Digital Experience Analytics (DXA)?

What Are G2 Users Discussing About Medallia Digital Experience Analytics (DXA)?

Smartlook

Smartlook is an analytics solution for websites, iOS/Android apps, and various app frameworks, that answers the "whys" behind your users' actions. Learn more about our features ↩️ Brands can easily understand how customers precisely interact with their website and app by: - Watching recordings of every user, and seeing exactly what they see, down to the same resolution. - Using automatically tracked events generated within the website/app, from tapping a button to typing text. - Building conversion funnels and finding out where most of their users are leaving the website/app (and seeing what they did before they left). - Creating heatmaps of visitors’ clicks, scrolls, and moves, to highlight popular elements. Smartlook cuts out all the guesswork and gathers brands’ app data together on one central dashboard, which enables sharing and collaborating with colleagues. This means clear, data-driven decision-making for product managers, marketers, UX designers, and developers to constantly improve each website and app by reducing churn rates, boosting conversions, identifying and fixing bugs, and improving UX.

Average Rating: 4.6/5.0

Total Reviews: 837

How Do G2 Users Rate Smartlook?

  • Sessions - Digital Analytics: 8.8/10 (Category avg: 8.8/10)
  • Engagement: 8.7/10 (Category avg: 8.7/10)
  • Trending: 8.5/10 (Category avg: 8.4/10)
  • Has the product been a good partner in doing business?: 9.0/10 (Category avg: 9.0/10)

Who Is the Company Behind Smartlook?

  • Seller: Cisco
  • Year Founded: 1984
  • HQ Location: San Jose, CA
  • LinkedIn® Page: www.linkedin.com
    95,294 employees on LinkedIn®
  • Ownership: NASDAQ:CSCO
  • Phone: 847-678-6600

Who Uses This Product?

  • Who Uses This: CEO, Owner
  • Top Industries: Computer Software, Marketing and Advertising
  • Company Size: 85% Small, 12% Medium

What Do G2 Reviewers Say About Smartlook?

AI-generated summary from verified user reviews

Pros
  • Users appreciate the ease of use of Smartlook, benefiting from its clean interface and effective analytics tools.
  • Users value the clean interface and custom dashboards of Smartlook, enhancing their analytics and decision-making experience.
  • Users value the powerful analytics tools in Smartlook, enhancing their ability to monitor user interactions effectively.
  • Users value the useful free plan of Smartlook, making it ideal for trials and small projects.
  • Users appreciate the clean and attractive interface of Smartlook, facilitating effective navigation and insightful analytics.
Cons
  • Users find the cluttered interface sometimes overwhelming, which can disrupt their overall experience with Smartlook.
  • Users find complex features challenging, with limited tracking records and difficulties in creating heat maps.
  • Users report experiencing dashboard issues due to an overloaded interface and occasional visual glitches.
  • Users are concerned about the limited one-month data retention and difficulties in creating permanent heat maps.
  • Users find delays in accessing tracking records and face challenges with heat map functionality in Smartlook.

What Are Recent G2 Reviews of Smartlook?

What Are G2 Users Discussing About Smartlook?

AI can help you find the answers. G2 helps you trust them.

Connect G2 to Claude or ChatGPT for answers grounded in G2's trusted reviews, comparisons, and pricing from real user insights.

How it works

Hotjar by Contentsquare

Hotjar by Contentsquare is the experience platform for teams who want to build better digital journeys, faster. With trusted data, context-aware AI, and built-in testing, it helps you optimize every part of the customer (or agent) journey. You can now understand, prioritize, and act faster to create experiences people love.

Average Rating: 4.3/5.0

Total Reviews: 332

How Do G2 Users Rate Hotjar by Contentsquare?

  • Sessions - Digital Analytics: 8.7/10 (Category avg: 8.8/10)
  • Engagement: 9.1/10 (Category avg: 8.7/10)
  • Trending: 9.0/10 (Category avg: 8.4/10)
  • Has the product been a good partner in doing business?: 8.7/10 (Category avg: 9.0/10)

Who Is the Company Behind Hotjar by Contentsquare?

Who Uses This Product?

  • Who Uses This: Product Manager, Digital Marketing Specialist
  • Top Industries: Marketing and Advertising, Computer Software
  • Company Size: 52% Small, 37% Medium

What Do G2 Reviewers Say About Hotjar by Contentsquare?

AI-generated summary from verified user reviews

Pros
  • Users appreciate the ease of use of Hotjar, making UX measurement straightforward and efficient for all organizations.
  • Users value the clear user interaction insights from Hotjar's heatmaps, enhancing their understanding of UX issues effectively.
  • Users appreciate the clear overview of user interactions provided by Hotjar's heatmaps, enhancing website optimization efforts.
  • Users appreciate the helpfulness of Hotjar for understanding user interactions and improving UX effectively.
  • Users love the high-quality session recordings from Hotjar, which reveal critical insights into user interactions and UX issues.
Cons
  • Users face accuracy and functionality issues with Hotjar, including heatmap misalignment and restrictive session recording limits.
  • Users note that the pricing is high due to individual feature costs, which can add up quickly.
  • Users report missing features in Hotjar, including inaccurate heatmaps and limited analytics capabilities.
  • Users find recording issues frustrating due to limits, missed interactions, and overwhelming data management with high-traffic sites.
  • Users find the difficult filtering of Hotjar hinders effective data segmentation and may require additional upgrades to manage recordings.

What Are Recent G2 Reviews of Hotjar by Contentsquare?

What Are G2 Users Discussing About Hotjar by Contentsquare?

Crazy Egg

Since 2005, Crazy Egg has helped hundreds of thousands of website owners pay attention to every website visitor, so they can get the most out of every website visit. With access to 5 different types of heatmaps, a visitor recordings/session replay tool, A/B testing, AND surveys, you have the complete package to transform your business by improving your user experience.

Average Rating: 4.2/5.0

Total Reviews: 125

How Do G2 Users Rate Crazy Egg?

  • Sessions - Digital Analytics: 8.9/10 (Category avg: 8.8/10)
  • Engagement: 9.2/10 (Category avg: 8.7/10)
  • Trending: 6.7/10 (Category avg: 8.4/10)
  • Has the product been a good partner in doing business?: 8.6/10 (Category avg: 9.0/10)

Who Is the Company Behind Crazy Egg?

  • Seller: Crazy Egg
  • Year Founded: 2006
  • HQ Location: La Mirada, CA
  • LinkedIn® Page: www.linkedin.com
    43 employees on LinkedIn®

Who Uses This Product?

  • Who Uses This: Digital Marketing Manager
  • Top Industries: Marketing and Advertising, Computer Software
  • Company Size: 43% Medium, 43% Small

What Do G2 Reviewers Say About Crazy Egg?

AI-generated summary from verified user reviews

Pros
  • Users praise the ease of use of Crazy Egg, finding navigation and installation straightforward and hassle-free.
  • Users highly value the intuitive heat maps of Crazy Egg, enhancing their ability to analyze user behavior effectively.
  • Users find the easy setup of Crazy Egg perfect for their needs, enjoying a seamless experience compared to GA4.
  • Users commend the exceptional customer support of Crazy Egg, appreciating timely and practical assistance for their needs.
  • Users value the intuitive heat maps of Crazy Egg, which enhance website optimization and user experience significantly.
Cons
  • Users are frustrated by the requirement to install a tracking script before accessing full Crazy Egg features.
  • Users find the limited features of Crazy Egg restricts their ability to fully explore its capabilities without a live site.
  • Users note the missing advanced features in Crazy Egg, desiring more comprehensive analytics and segmentation options.
  • Users find filtering issues in Crazy Egg limit its effectiveness, especially in dynamic reporting and advanced analytics.
  • Users find the limited analysis features of Crazy Egg restrictive compared to more advanced analytics tools.

What Are Recent G2 Reviews of Crazy Egg?

What Are G2 Users Discussing About Crazy Egg?

Chartbeat

Chartbeat, Inc. includes four product lines — Chartbeat, Tubular, Lineup, and FatTail — and combines analytics that power smarter audience strategies with revenue solutions that simplify ad operations and accelerate monetization. See how Chartbeat, Inc. is shaping the future of media strategy and revenue. https://lp.chartbeat.com/chartbeat-inc Chartbeat, the content intelligence platform for publishers, empowers media companies to build loyal audiences with real-time and historical editorial analytics across desktop, social, and mobile platforms. Chartbeat helps digital publishing organizations understand what, within their content, is keeping people engaged. Partnering with over 60,000 media brands across 70+ countries, Chartbeat’s real-time and historical dashboards, in-depth headline testing and in-page optimization tools, robust reporting, and more help the world’s leading media organizations understand, measure, and build business value from the attention earned by their written and video content.

Average Rating: 4.4/5.0

Total Reviews: 68

How Do G2 Users Rate Chartbeat?

  • Sessions - Digital Analytics: 9.1/10 (Category avg: 8.8/10)
  • Engagement: 9.1/10 (Category avg: 8.7/10)
  • Trending: 9.1/10 (Category avg: 8.4/10)
  • Has the product been a good partner in doing business?: 9.2/10 (Category avg: 9.0/10)

Who Is the Company Behind Chartbeat?

  • Seller: Chartbeat
  • Year Founded: 2009
  • HQ Location: New York, NY
  • LinkedIn® Page: www.linkedin.com
    134 employees on LinkedIn®

Who Uses This Product?

  • Top Industries: Online Media, Broadcast Media
  • Company Size: 49% Medium, 26% Large

What Are Recent G2 Reviews of Chartbeat?

What Are G2 Users Discussing About Chartbeat?

LeadLander

LeadLander is website visitor identification software that shows B2B sales and marketing teams which companies are visiting their website, even when visitors never fill out a form. Most of your website traffic leaves without saying a word. Say a company you'd love to work with spends ten minutes on your pricing page and then leaves. Without LeadLander, you'd never know they were there. With LeadLander, you see the company name, the pages they viewed, how they found you and whether they're a new visitor or coming back. When the individual visitor can be identified, you see that too. How LeadLander helps you turn anonymous traffic into qualified leads: Real-time visitor identification: See which companies are on your site right now. Contact intelligence: Find the right people to reach at each visiting company. Journey tracking: Follow what each account researches over time, so you know what they care about before you reach out. Alerts when target accounts return: Get notified the moment a key prospect comes back, so you can follow up while they're still interested. AI-assisted outreach: Turn what you've learned about a visit into a personalized message. Campaign attribution: See which campaigns bring in the companies that matter. Integrations: Send visitor data to Salesforce, HubSpot, Slack, Mailchimp and Marketo. Setup takes minutes. You add one small piece of code to your site and data starts coming in right away. LeadLander has been helping thousands of businesses find the buyers already looking at them for more than 20 years. Who uses LeadLander: Sales teams that want warmer conversations, marketers who want to prove which campaigns drive pipeline (the deals your team is working) and agencies who report on lead quality for their clients. Try LeadLander free for 14 days with full access and your own website traffic. Keep every lead you find.

Average Rating: 4.2/5.0

Total Reviews: 63

How Do G2 Users Rate LeadLander?

  • Sessions - Digital Analytics: 8.4/10 (Category avg: 8.8/10)
  • Engagement: 8.5/10 (Category avg: 8.7/10)
  • Trending: 8.4/10 (Category avg: 8.4/10)
  • Has the product been a good partner in doing business?: 9.1/10 (Category avg: 9.0/10)

Who Is the Company Behind LeadLander?

Who Uses This Product?

  • Top Industries: Computer Software, Marketing and Advertising
  • Company Size: 52% Medium, 41% Small

What Do G2 Reviewers Say About LeadLander?

AI-generated summary from verified user reviews

Pros
  • Users value the daily reports from LeadLander, which enhance visibility on potential leads and foster team excitement.
  • Users value the great customer service from LeadLander, enhancing their overall experience with instant support and personalized help.
  • Users benefit from daily reports on website visitors, boosting excitement about potential leads and sales opportunities.
  • Users appreciate the integrations for daily reports, keeping teams engaged with potential leads and company insights.
  • Users find LeadLander to be intuitive, offering easy navigation for tracking company searches and profiles efficiently.
Cons
  • Users face challenges with Hubspot integration, making it difficult to utilize LeadLander effectively.
  • Users find the limited search functionality of LeadLander constraining, as it lacks position-based contact searching.
  • Users find the search limitations in LeadLander frustrating, as they hinder effective contact management by position.

What Are Recent G2 Reviews of LeadLander?

What Are G2 Users Discussing About LeadLander?

StatCounter

StatCounter is a free yet reliable invisible web tracker, highly configurable hit counter and real-time detailed web stats.

Average Rating: 4.3/5.0

Total Reviews: 115

How Do G2 Users Rate StatCounter?

  • Sessions - Digital Analytics: 9.0/10 (Category avg: 8.8/10)
  • Engagement: 8.3/10 (Category avg: 8.7/10)
  • Trending: 8.2/10 (Category avg: 8.4/10)
  • Has the product been a good partner in doing business?: 9.1/10 (Category avg: 9.0/10)

Who Is the Company Behind StatCounter?

Who Uses This Product?

  • Top Industries: Marketing and Advertising, Information Technology and Services
  • Company Size: 61% Small, 33% Medium

What Are Recent G2 Reviews of StatCounter?

What Are G2 Users Discussing About StatCounter?

Mouseflow

Behavioral Analytics for UX Friction & CRO (with MCP server and built-in AI insights) Mouseflow is the intuitive and affordable behavioral analytics platform that cuts the fluff to reveal the truth behind user behavior. We empower businesses with data-driven behavioral analytics, helping brands like eCommerce, SaaS, and enterprise brands understand why visitors are struggling, turning complex data into actionable insights that drive revenue and growth. Since essential tools like heatmaps and friction detection come out-of-the-box, you don't need an engineering degree to get quick value. How Mouseflow Helps You Optimize Faster: We’re here to toughen up your website – and your bottom line. • Mouseflow AI offers three ways to turn behavioral data into action: get a prioritized weekly roundup with Mina Insights, investigate questions with Ask Mina AI, and bring your data into your AI tools with Mouseflow MCP. • Automated UX Friction Detection Detect and fix conversion killers automatically with +7 friction events and our Friction Score—focus on changes that truly matter. • Affordable User Journey Mapping Analyze effortlessly how users move from, to, and between any page. Stop struggling to track user paths; we help you give them a shortcut to checkout. • Session Replays that Listen Watch user journeys unfold with session replays to see the truth behind clicks and turn data into powerful solutions. • Heatmaps Built for Scale Get 7 types of heatmaps, generated automatically for every page. This visibility is provided right out-of-the-box. • Conversion Funnels, Forms, & Analytics Pinpoint exact drop-off points using funnels and form analytics to increase conversions. • Real-Time Feedback Campaigns Understand visitor intent by asking the right questions at the right time. • Advanced Filtering, Segmentation, and Customization Advanced filtering and segmentation is available in every plan, supporting your experimentation roadmaps with the precision you need. Mouseflow is trusted by 210,000+ teams to analyze millions of visitor sessions, unlocking the fastest path to growth. We believe in making analytics approachable and fun, packed with “aha” moments. Uncover the truth behind your user experience today with our Essentials, Advanced, or Premium plans.

Average Rating: 4.6/5.0

Total Reviews: 693

How Do G2 Users Rate Mouseflow?

  • Sessions - Digital Analytics: 8.5/10 (Category avg: 8.8/10)
  • Engagement: 8.4/10 (Category avg: 8.7/10)
  • Trending: 7.7/10 (Category avg: 8.4/10)
  • Has the product been a good partner in doing business?: 8.9/10 (Category avg: 9.0/10)

Who Is the Company Behind Mouseflow?

  • Seller: Mouseflow
  • Company Website:
  • Year Founded: 2010
  • HQ Location: Copenhagen, Denmark
  • LinkedIn® Page: www.linkedin.com
    56 employees on LinkedIn®

Who Uses This Product?

  • Who Uses This: CEO, Owner
  • Top Industries: Marketing and Advertising, Computer Software
  • Company Size: 68% Small, 23% Medium

What Do G2 Reviewers Say About Mouseflow?

AI-generated summary from verified user reviews

Pros
  • Users find Mouseflow’s ease of use invaluable, enabling efficient task completion and insightful user behavior analysis.
  • Users value the clear and easy-to-use interface of Mouseflow, enhancing their ability to evaluate customer journeys effectively.
  • Users value the clarity and ease of use of Mouseflow's heatmaps, enhancing their understanding of user behavior.
  • Users value the session replay feature of Mouseflow for gaining real insights into user behavior effortlessly.
  • Users appreciate the easy setup of Mouseflow, allowing quick access and efficient use without complications.
Cons
  • Users notice missing features, such as bugs and outdated plugins, compromising the overall functionality of Mouseflow.
  • Users note integration limitations in Mouseflow, impacting deep analysis and flexibility in sharing insights.
  • Users find Mouseflow's pricing model expensive, especially challenging for small businesses with limited budgets.
  • Users note that data inaccuracy in heatmaps can hinder reliable analysis, suggesting room for improvement in accuracy.
  • Users experience filtering issues that make it challenging to efficiently analyze session recordings amidst large data volumes.

What Are Recent G2 Reviews of Mouseflow?

What Are G2 Users Discussing About Mouseflow?

Appier AIRIS (formerly Woopra)

Woopra is a Customer Journey Analytics solution that is redefining how companies understand, analyze, engage and retain their customers. The platform is designed to fuel optimization and growth throughout the entire customer lifecycle. Leveraging individual-level data to aggregate analytics reports for full lifecycle insights that bridge departmental gaps. Woopra’s proprietary tracking technology tracks usage across your website, product and mobile applications. In addition, the platform offers 51+ one-click integrations with partners such as Salesforce, Marketo, Intercom and Segment to seamlessly unify disparate data points across tools and teams. As data flows into Woopra, People Profiles reveal a full behavioral history for each user, from their first touch to conversion and beyond. Making every engagement an opportunity to create more personalized experiences and support. Advanced analytics features include non-linear Customer Journeys, Trends and Retention reports powered by consolidated data. Translating numbers into people and opening entirely new views of the who, the what and the how in your data. Finally, Woopra's Triggers empower teams to take real-time action on their data. Automatically personalize page content, trigger a chat message, enrolls segments drip campaigns, update a lead status or customize a promotion with zero latency. Combined with powerful behavioral and demographic data, companies are able to deliver personalized experiences through the right channel, at the right time. With more than 200,000 users and 1,000 innovative customers across the world, Woopra provides the first unified analytics solution that is used by SaaS, eCommerce and On-Demand services for understanding, engaging and connecting with customers through data.

Average Rating: 4.4/5.0

Total Reviews: 197

How Do G2 Users Rate Appier AIRIS (formerly Woopra)?

  • Sessions - Digital Analytics: 9.0/10 (Category avg: 8.8/10)
  • Engagement: 8.8/10 (Category avg: 8.7/10)
  • Trending: 8.6/10 (Category avg: 8.4/10)
  • Has the product been a good partner in doing business?: 8.8/10 (Category avg: 9.0/10)

Who Is the Company Behind Appier AIRIS (formerly Woopra)?

  • Seller: Appier
  • Year Founded: 2012
  • HQ Location: Taipei, Taiwan
  • LinkedIn® Page: www.linkedin.com
    862 employees on LinkedIn®
  • Ownership: TYO: 4180

Who Uses This Product?

  • Top Industries: Information Technology and Services, Computer Software
  • Company Size: 53% Small, 34% Medium

What Do G2 Reviewers Say About Appier AIRIS (formerly Woopra)?

AI-generated summary from verified user reviews

Pros
  • Users value the insights generation of Appier AIRIS, enabling effective analysis of user journeys and business strategies.
  • Users value the real-time analytics of Appier AIRIS, enhancing their ability to respond swiftly to customer behavior changes.
  • Users value the flexible reporting capabilities of Appier AIRIS, essential for tailored insights and effective decision-making.
  • Users value the deep customer understanding provided by Appier AIRIS, enhancing insights for better business decisions.
  • Users appreciate the comprehensive data collection and analysis capabilities of Appier AIRIS, enhancing business insights significantly.
Cons
  • Users find the onboarding process and built-in formulas complex, leading to occasional malfunctions and confusion.
  • Users experience difficult customization options, which limit their ability to tailor reports and dashboards effectively.
  • Users find the difficult learning curve of Appier AIRIS challenging due to its many features and analytics complexity.
  • Users express concern about the limited features of Appier AIRIS, particularly the restriction on data and report types.
  • Users face integration issues with certain third-party tools, causing potential data discrepancies during setup.

What Are Recent G2 Reviews of Appier AIRIS (formerly Woopra)?

What Are G2 Users Discussing About Appier AIRIS (formerly Woopra)?

Heap by Contentsquare

Heap by Contentsquare is a Product Analytics platform that automatically captures every user interaction on your website or app — no manual event tagging, no developer dependency, no data gaps. Founded in Silicon Valley in 2013, Heap was acquired by Contentsquare in 2023 and is now fully integrated as Contentsquare's Product Analytics capability. With Heap by Contentsquare, product, data, and marketing teams can instantly answer questions like: - Where are users dropping off in a funnel? - Which features are actually being adopted — and which are being ignored? - What drives retention and long-term loyalty across devices and sessions? - What's the user journey from first visit to conversion? What makes it different: Autocapture — every click, tap, and interaction is recorded automatically from day one, with no pre-planned instrumentation needed Funnels, paths, retention & segmentation — the full product analytics toolkit, out of the box Website icon Session replay — jump from a data point directly to a recording to see the "why" behind the numbers Sense AI — ask questions in plain language, get proactive insights, and auto-quantified impact Connected to the full Contentsquare platform — combine Product Analytics with DXA heatmaps, error monitoring, and Voice of Customer (Hotjar surveys) for a 360° view of the customer experience Data Connect — sync your autocaptured data directly into Snowflake, BigQuery, or Redshift Website icon Whether you're optimizing onboarding, validating a new feature launch, or understanding what keeps users coming back, Heap by Contentsquare gives you a complete and retroactive picture of user behavior — so your team spends less time hunting for data and more time acting on it.

Average Rating: 4.4/5.0

Total Reviews: 1,074

How Do G2 Users Rate Heap by Contentsquare?

  • Sessions - Digital Analytics: 8.6/10 (Category avg: 8.8/10)
  • Engagement: 8.4/10 (Category avg: 8.7/10)
  • Trending: 8.0/10 (Category avg: 8.4/10)
  • Has the product been a good partner in doing business?: 8.8/10 (Category avg: 9.0/10)

Who Is the Company Behind Heap by Contentsquare?

Who Uses This Product?

  • Who Uses This: Product Manager, Software Engineer
  • Top Industries: Computer Software, Information Technology and Services
  • Company Size: 54% Medium, 35% Small

What Do G2 Reviewers Say About Heap by Contentsquare?

AI-generated summary from verified user reviews

Pros
  • Users appreciate the ease of use of Heap, enabling non-technical members to track events effortlessly.
  • Users value Heap's automatic event tracking, which streamlines measurement and enhances understanding of user behavior effortlessly.
  • Users value Heap's automation for tracking user interactions, greatly saving time and simplifying analysis without requiring manual setup.
  • Users value Heap's efficiency as it automates event tracking, saving time and effort for teams.
  • Users love the intuitive interface of Heap, enabling non-technical team members to effortlessly create tracking events.
Cons
  • Users experience data inaccuracy with Heap, leading to confusion and difficulty in finding actionable insights.
  • Users face data management issues with discrepancies from Google Analytics and overwhelming amounts of auto-captured data.
  • Users experience slow performance with Heap, noting lag and inefficiencies during data processing and reporting.
  • Users find the complex features of Heap challenging initially, requiring time to learn and adapt effectively.
  • Users find the overwhelming amount of data from Heap challenging to sift through without better filtering options.

What Are Recent G2 Reviews of Heap by Contentsquare?

What Are G2 Users Discussing About Heap by Contentsquare?

Lucky Orange

Lucky Orange combines website analytics, visitor feedback and AI-powered analysis to help businesses understand visitor behavior and identify opportunities to improve conversions. Its suite of tools includes Dynamic Heatmaps, Session Recordings, Conversion Funnels and Discovery AI, an analytics assistant that answers questions about your website in plain language. Ask Discovery which traffic sources bring visitors who convert, which pages have the most visitor frustration or what non-converting visitors have in common. Discovery analyzes actual visitor interactions and provides written findings, guiding you to relevant heatmaps, session recordings and other tools so you can investigate the behavior behind the insights. Discovery Visualize brings those findings to life with supporting charts, graphs and lists. Written analysis and visualizations work together to help you explore trends, compare visitor groups and decide what to investigate next. Use the Visualize workspace to review conversion performance over time, compare mobile and desktop engagement or prepare findings for a team meeting or client presentation. Rearrange or archive visual cards, download the workspace and ask follow-up questions to explore a specific card in more detail. Built for website owners, digital marketers, ecommerce teams and agencies, Lucky Orange supports workflows ranging from investigating landing page performance to understanding cart abandonment and reporting on client results. Trusted by more than 500,000 websites worldwide, it offers integrations and installation options for platforms including Shopify, Shopify Plus, BigCommerce, WordPress and Square. Understand visitor behavior with Session Recordings and Dynamic Heatmaps Session Recordings let you watch individual visitor journeys to understand how people navigate your website, where they hesitate and what obstacles they encounter. Optimizable Segments help you find sessions with behaviors worth investigating, including signs of frustration or confusion. The AI Referrals segment helps you identify visits referred by supported AI platforms, including ChatGPT, Gemini, Perplexity, Claude and Microsoft Copilot. Dynamic Heatmaps reveal where visitors click, tap, move their mouse and scroll, including interactions with dropdown menus and hover content. Explore engagement patterns across visitors and use Scroll Heatmaps to determine whether people reach important content and calls to action. Investigate conversion barriers with Funnels and Form Analytics Conversion Funnels show where visitors drop off between defined steps, such as viewing a product, starting checkout and placing an order. Form Analytics helps you identify obstacles to form completion. Together with recordings and heatmaps, these tools help teams narrow their investigation and prioritize potential improvements. Collect feedback and engage visitors Surveys let you ask visitors directly what they need or what is preventing them from converting. Choose multiple-choice, rating, like/dislike or open-ended questions, and target surveys to relevant visitors. Live Chat helps your team answer questions and assist visitors while they’re on your website. Announcements let you deliver targeted messages, such as promotions, product updates or requests for reviews. These tools complement behavioral analytics with direct feedback and opportunities to address visitor concerns. Evaluate individual pages with Page Insights Page Insights brings traffic, engagement, frustration events and page speed metrics together for each page. Review activity such as bounces, unique visitors and form submissions, compare performance across timeframes and open relevant recordings or heatmaps to investigate further. Lucky Orange helps teams connect performance metrics with the visitor experiences behind them. Discovery AI and Discovery Visualize make those findings easier to explore, explain and share, helping you move from a website question to a more informed decision about what to improve next.

Average Rating: 4.6/5.0

Total Reviews: 393

G2 Deal: 30% off your first month - even on Enterprise plans!

Lucky Orange can help you understand why your website is getting traffic that doesn’t convert into sales or leads. Our conversion rate optimization tools have been trusted by more than 500,000 websites worldwide. Get 30% off your first month of a paid Lucky Orange plan with this exclusive G2 deal.

Price: ~~$39 per month~~ → $27.30 per month

View this exclusive G2 deal

How Do G2 Users Rate Lucky Orange?

  • Sessions - Digital Analytics: 8.9/10 (Category avg: 8.8/10)
  • Engagement: 8.8/10 (Category avg: 8.7/10)
  • Trending: 8.5/10 (Category avg: 8.4/10)
  • Has the product been a good partner in doing business?: 9.2/10 (Category avg: 9.0/10)

Who Is the Company Behind Lucky Orange?

  • Seller: Lucky Orange
  • Company Website:
  • Year Founded: 2012
  • HQ Location: Overland Park, KS
  • LinkedIn® Page: www.linkedin.com
    23 employees on LinkedIn®

Who Uses This Product?

  • Who Uses This: Owner, Founder
  • Top Industries: Retail, Marketing and Advertising
  • Company Size: 83% Small, 12% Medium

What Do G2 Reviewers Say About Lucky Orange?

AI-generated summary from verified user reviews

Pros
  • Users value the approachable interface of Lucky Orange, enabling easy use across the entire team without extensive training.
  • Users commend the ease of use of Lucky Orange, enabling quick setup and intuitive navigation for all team members.
  • Users find the easy setup of Lucky Orange to be quick and intuitive, enhancing team accessibility and efficiency.
  • Users love the Session Replay feature of Lucky Orange, revealing critical user behavior for better decision-making.
  • Users find heatmaps invaluable for understanding visitor behavior, enabling effective website strategy and optimization.
Cons
  • Users find Lucky Orange expensive, especially with automatic tier upgrades that can lead to unexpected charges.
  • Users face recording issues with navigation, inconsistent data, and difficulty accessing past recordings, complicating their experience.
  • Users express frustration over plan limitations that restrict functionality and complicate billing processes, especially on lower-tier subscriptions.
  • Users express frustration with the limitations on the free plan, desiring more features and better session availability.
  • Users experience slow loading sessions with Lucky Orange, occasionally leading to missed tracking opportunities and glitches.

What Are Recent G2 Reviews of Lucky Orange?

What Are G2 Users Discussing About Lucky Orange?

GoSquared

Turn more visitors into customers. A suite of integrated products to help you grow your online business. – Analytics: traffic sources, campaign tracking, new visits % – Live Chat: targeted messaging, lead capture, shared team inbox – Customer Data Hub: automatic lead enrichment, company info

Average Rating: 4.5/5.0

Total Reviews: 74

How Do G2 Users Rate GoSquared?

  • Sessions - Digital Analytics: 9.1/10 (Category avg: 8.8/10)
  • Engagement: 9.0/10 (Category avg: 8.7/10)
  • Trending: 8.9/10 (Category avg: 8.4/10)
  • Has the product been a good partner in doing business?: 8.9/10 (Category avg: 9.0/10)

Who Is the Company Behind GoSquared?

  • Seller: GoSquared
  • Year Founded: 2006
  • HQ Location: London, United Kingdom
  • LinkedIn® Page: www.linkedin.com
    6 employees on LinkedIn®

Who Uses This Product?

  • Top Industries: Marketing and Advertising
  • Company Size: 45% Small, 37% Medium

What Are Recent G2 Reviews of GoSquared?

What Are G2 Users Discussing About GoSquared?

Adverity

Adverity is the marketing data intelligence company seen as the foundation that makes enterprise marketing AI work. Adverity Connect is an enterprise-grade marketing ETL. It pulls data from 600+ sources, harmonizes it so metrics are comparable across platforms, monitors it continuously for quality, and delivers it into the customer's warehouse. The data foundation for marketing. Adverity Atlas is a marketing knowledge layer. It sits on top of any data warehouse and gives AI the knowledge and context to work accurately on marketing data. Use it through the UI and it works as an autonomous marketing analyst. Connect it to your own AI program and it becomes the knowledge layer your agents run on. Connect builds the data foundation. Adverity Atlas is the knowledge layer that makes marketing AI work. Built from a decade of enterprise brand and agency deployments representing over $80 billion in managed ad spend.

Average Rating: 4.4/5.0

Total Reviews: 321

How Do G2 Users Rate Adverity?

  • Sessions - Digital Analytics: 8.1/10 (Category avg: 8.8/10)
  • Engagement: 7.7/10 (Category avg: 8.7/10)
  • Trending: 7.9/10 (Category avg: 8.4/10)
  • Has the product been a good partner in doing business?: 8.9/10 (Category avg: 9.0/10)

Who Is the Company Behind Adverity?

  • Seller: Adverity GmbH
  • Company Website:
  • Year Founded: 2015
  • HQ Location: Vienna, Austria
  • LinkedIn® Page: www.linkedin.com
    332 employees on LinkedIn®

Who Uses This Product?

  • Who Uses This: Data Analyst, Data Engineer
  • Top Industries: Marketing and Advertising, Information Technology and Services
  • Company Size: 44% Medium, 37% Small

What Do G2 Reviewers Say About Adverity?

AI-generated summary from verified user reviews

Pros
  • Users value the ease of use of Adverity, benefiting from a simple interface and responsive support.
  • Users value the easy integration and intuitive data management in Adverity, enhancing their workflow and efficiency.
  • Users value the easy integration capabilities of Adverity, streamlining data workflows across various platforms effortlessly.
  • Users value the easy integrations of Adverity, which enhance efficiency and streamline data management across platforms.
  • Users commend the responsive customer support of Adverity, ensuring timely assistance and effective solutions during setup and beyond.
Cons
  • Users find Adverity to be time-consuming due to slow pipeline creation and unclear error messages, complicating their workflows.
  • Users encounter challenges with data management, experiencing unclear error messages and complexities in administrative tasks.
  • Users experience a lack of information due to unclear error messages and insufficient ticket follow-up, causing frustration.
  • Users experience time delays in data pipeline processes, impacting efficiency and confidence in scalability and reporting.
  • Users find the difficult learning curve of Adverity hampers effective use, especially for advanced features and setup.

What Are Recent G2 Reviews of Adverity?

What Are G2 Users Discussing About Adverity?

Coefficient

Coefficient is a new way to work with your company data better, faster, and more accurately without ever leaving your spreadsheet, integrating with the tools you already use. Install the Coefficient Excel or Google Sheets extension and use it in a new or existing sheet in seconds. Once installed, Coefficient lives as a sidebar companion so your company data is only a couple of clicks away at any time. Any data source that you work with is available directly in your Coefficient sidebar – such as Salesforce, HubSpot, Snowflake, NetSuite, QuickBooks, MySQL, and Looker – with the ability to consolidate your data from multiple systems into one spreadsheet. Use Coefficient filters to easily customize your imports to only work with the data you need, keeping your spreadsheets performant. Quickly go back anytime to add more data in the same report. Never rebuild the same analysis twice by keeping your data up to date with scheduled updates. And, use Coefficient alerts to trigger Slack or email messages anytime your spreadsheet updates. Now, you can turn your spreadsheet into the most flexible, powerful monitoring system across all of your company data. Say “goodbye” to manual data workflows and “hello” to connected spreadsheets.

Average Rating: 4.7/5.0

Total Reviews: 206

How Do G2 Users Rate Coefficient?

  • Sessions - Digital Analytics: 7.8/10 (Category avg: 8.8/10)
  • Engagement: 8.0/10 (Category avg: 8.7/10)
  • Trending: 8.1/10 (Category avg: 8.4/10)
  • Has the product been a good partner in doing business?: 9.0/10 (Category avg: 9.0/10)

Who Is the Company Behind Coefficient?

  • Seller: Coefficient
  • Company Website:
  • Year Founded: 2020
  • HQ Location: Palo Alto, CA
  • LinkedIn® Page: www.linkedin.com
    70 employees on LinkedIn®

Who Uses This Product?

  • Top Industries: Computer Software, Information Technology and Services
  • Company Size: 46% Medium, 35% Small

What Do G2 Reviewers Say About Coefficient?

AI-generated summary from verified user reviews

Pros
  • Users appreciate the ease of use of Coefficient, enjoying seamless data extraction and hassle-free synchronization across tools.
  • Users value the automation capabilities of Coefficient, making data management effortless and efficient.
  • Users appreciate the seamless integrations of Coefficient, enabling effortless data flow between systems like Salesforce and QuickBooks.
  • Users value the time-saving automation of Coefficient, reclaiming hours in their weekly reporting tasks.
  • Users find easy integrations with Coefficient seamless, enhancing productivity and simplifying their data workflow considerably.
Cons
  • Users find the limited filtering options in Coefficient restrictive and detrimental to their data analysis experience.
  • Users find the feature limitations of Coefficient frustrating, particularly with filtering and integration challenges.
  • Users find the limit of Google Sheets for multiple filters and imports restricts their data management capabilities.
  • Users find the missing features in Coefficient limiting, especially with filters and integrating charts from SFDC.
  • Users face integration issues with Coefficient, leading to frustrating limitations when connecting to other tools and systems.

What Are Recent G2 Reviews of Coefficient?

Alanna Iwuh
A
Researched and written by Alanna Iwuh
Updated