Best E-Commerce Analytics Software - Page 4

How Many E-Commerce Analytics Software Products Does G2 Track?

Total Products under this Category: 344

Category Stats (Sep 2026)

  • Average Rating: 4.6/5 (↑0.01 vs Aug 2026) The average rating of products in this category, based on all submitted ratings
  • Top Trending Product: FiveX (+3.13%) - Among all products in this category, FiveX recorded the largest rating increase compared to last month

Last updated: September 01, 2026

How Does G2 Rank E-Commerce Analytics Software Products?

Why You Can Trust G2's Software Rankings:

  • 30 Analysts and Data Experts
  • 13,600+ Authentic Reviews
  • 344+ Products
  • Unbiased Rankings

G2's software rankings are built on verified user reviews, rigorous moderation, and a consistent research methodology maintained by a team of analysts and data experts. Each product is measured using the same transparent criteria, with no paid placement or vendor influence. While reviews reflect real user experiences, which can be subjective, they offer valuable insight into how software performs in the hands of professionals. Together, these inputs power the G2 Score, a standardized way to compare tools within every category.

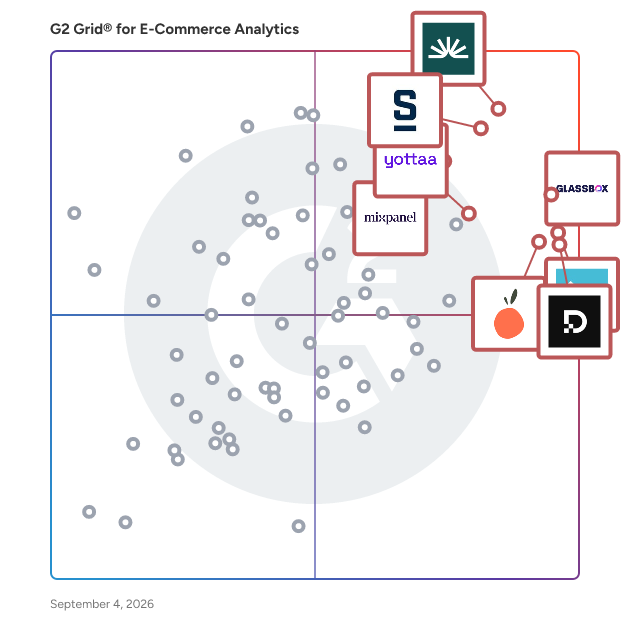
G2 Grid® for E-Commerce Analytics Software

G2 Grid® for E-Commerce Analytics Software plotting products by satisfaction and market presence

Highlighted products: Fullstory, Glassbox, Stackline, Luigi's Box, Decodo (formerly Smartproxy), Lucky Orange, Mixpanel, and Yottaa.

Underlying data: [Grid® JSON](https://www.g2.com/categories/e-commerce-analytics/grids.json?focus%5B%5D=fullstory&focus%5B%5D=glassbox&focus%5B%5D=stackline&focus%5B%5D=luigi-s-box&focus%5B%5D=decodo-formerly-smartproxy&focus%5B%5D=lucky-orange&focus%5B%5D=mixpanel&focus%5B%5D=yottaa&segment=all)

Etail Solutions

Etail Solutions helps brands, distributors, 3PLs, and retailers optimize ecommerce fulfillment across multiple sales channels, fulfillment locations, and existing software systems and platforms. Etail combines real-time inventory visibility, intelligent order routing, and deep integration capabilities to cut ecommerce fulfillment costs and scale profitably. In 2025, Etail introduced its latest innovation, The Distribution Network. Etail’s latest innovation turns regional distributors into D2C fulfillment hubs by connecting their inventory to brands’ ecommerce channels. Orders are automatically routed to the closest distributor, optimizing for speed, cost, and availability. Distributors unlock new revenue. Brands get fast, nationwide delivery with less overhead, using partners they already know and trust. Founded in 2010, Etail is designed to simplify complex ecommerce fulfillment challenges. The platform supports distributed inventory and order management, multi-vendor sourcing, cartonization, rate shopping, and native shipping – all powered by automation and real-time data. With flexible integrations, it adapts to even the most complex fulfillment setups. Etail is the operating system for modern ecommerce fulfillment – engineered for flexibility, built to handle complexity, and ready to scale with you. WHAT SETS US APART? Lower Costs: Automate routing for the most cost-effective delivery and reduce shipping expenses. Scalable Growth: Easily onboard vendors, manage catalogs, and scale profitably with drop shipping support. Flexible Integration: Connect with any system via EDI, APIs, or custom integrations—no replacement needed. Accurate Data: Sync inventory and pricing across channels and build custom reports effortlessly. READY TO SCALE SMARTER? Follow us for insights or visit our website to learn more.

Average Rating: 4.4/5.0

Total Reviews: 41

How Do G2 Users Rate Etail Solutions?

  • Has the product been a good partner in doing business?: 9.1/10 (Category avg: 9.2/10)
  • Reports: 8.3/10 (Category avg: 8.8/10)
  • Campaign Tracking: 6.7/10 (Category avg: 8.3/10)
  • Web Analytics: 6.8/10 (Category avg: 8.7/10)

Who Is the Company Behind Etail Solutions?

  • Seller: Etail Solutions
  • Company Website:
  • Year Founded: 2010
  • HQ Location: Minneapolis, MN
  • Twitter: @TeamEtail
    610 Twitter followers
  • LinkedIn® Page: www.linkedin.com
    19 employees on LinkedIn®

Who Uses This Product?

  • Top Industries: Consumer Goods, Retail
  • Company Size: 46% Small, 44% Medium

What Do G2 Reviewers Say About Etail Solutions?

AI-generated summary from verified user reviews

Pros
  • Users value the attentive support provided by Etail Solutions, making regular calls for helpful assistance.
  • Users value the effective communication from Etail Solutions, fostering regular calls and support from the team.
  • Users value the responsive customer support from Etail Solutions, appreciating regular calls and assistance from the team.
  • Users find the helpful support of Etail Solutions beneficial, especially during regular calls with the team.
  • Users appreciate the responsive support from Etail Solutions, receiving timely assistance through regular team calls.
Cons
  • Users are frustrated with the delay issues in ticket resolution, hindering their ability to progress with initiatives.
  • Users experience delivery delays with Etail Solutions, hindering progress on important initiatives and ticket resolutions.
  • Users find the ticket resolution time too lengthy, hindering progress on important initiatives with Etail Solutions.
  • Users find the time-consuming tasks frustrating, often delaying important initiatives that need Etail's input.
  • Users criticize the time consumption for ticket resolution, hindering progress on vital initiatives from Etail Solutions.

What Are Recent G2 Reviews of Etail Solutions?

What Are G2 Users Discussing About Etail Solutions?

Exatom

Unlock the Hidden Conversion Potential of Your Online Forms and Check-Out. And increase form completion by +20%. An immediate contribution to your Marketing ROI. FORM ANALYTICS | REAL-TIME MONITORING | SMART TOOLTIPS | ABANDONMENT RECOVERY | CONSULTANCY Exatom helps you turn more visitors into leads and sales. By revealing exactly why users abandon your web forms and check-outs—and what to do about it. Most marketers focus all their effort on getting traffic to forms. But they overlook the moment that matters most: the form itself. That’s where most conversions are lost. ❌ GA4 can’t help you here. ✅ Exatom can. Used by top brands like BMW, Kia, Hema, and Brooks Running, Exatom gives you: • Instant clarity on where users drop off • Actionable insights to fix friction fast • No developers needed (no-code implementation, cookieless) 💡 Try it free and get a custom revenue loss assessment—see what your forms are costing you right now. Stop leaking conversions. Start hitting your targets with forms that actually convert. What insights do our FORM ANALYTICS offer you? - quantifying the happy path: form view -> start -> submit -> convert - quantifying the drop-offs: not starting - start but not submitting - submitting but failed - UX experiences like autofill rates, error rates, duration to complete - analysis by browser, by device, by UTM - for each form field: drop-offs, interactions, interaction time, hesitation time, error rate and error messages, corrections, autofill rate, blank rate, rage clicks - instant view of form SESSION REPLAYS, linked to the analytics (no sampling) - INDUSTRY BENCHMARKING to understand your performance compared to the industry and same type of form - CRO PULSE, out Chrome Extension to view your analytics directly on your website What does FORM MONITORING do? - weekly overview by email showing the 6 key metrics and its trends for each form - alert notifications when your form or check-out performance deviates from the past - alert notifications when the situation is back to normal How will SMART TOOLTIPS help you? - digital marketers can create and manage their own tooltip campaigns - personalised and triggered upon user behaviour - functional messages, i.e. to help to create a correct password - motivational messages, i.e. to provide more info and nudge a user to continue - testing and preview before publishing - A/B testing within the platform - form optimisation without the need of developers

Average Rating: 4.7/5.0

Total Reviews: 44

How Do G2 Users Rate Exatom?

  • Has the product been a good partner in doing business?: 9.7/10 (Category avg: 9.2/10)
  • Reports: 8.9/10 (Category avg: 8.8/10)
  • Campaign Tracking: 8.3/10 (Category avg: 8.3/10)
  • Web Analytics: 8.8/10 (Category avg: 8.7/10)

Who Is the Company Behind Exatom?

  • Seller: Exatom
  • Year Founded: 2021
  • HQ Location: Leuven, BE
  • Twitter: @Exatom_io
    4 Twitter followers
  • LinkedIn® Page: www.linkedin.com
    11 employees on LinkedIn®

Who Uses This Product?

  • Top Industries: Automotive, Marketing and Advertising
  • Company Size: 48% Medium, 30% Small

What Do G2 Reviewers Say About Exatom?

AI-generated summary from verified user reviews

Pros
  • Users find Exatom a helpful tool for gaining insights and improving form efficiency with its user-friendly platform.
  • Users value the powerful insights from Exatom, enhancing form efficiency and improving user engagement significantly.
  • Users value the powerful analytics from Exatom, enhancing form efficiency and driving informed decision-making.
  • Users find Exatom’s ease of use enhances efficiency, backed by responsive support and strong training processes.
  • Users rave about Exatom's effective conversion optimization, experiencing improved lead forms and actionable insights for better performance.
Cons
  • Users find the complexity of the dashboard challenging, requiring time and effort to familiarize with its functionality.
  • Users find the learning curve steep for Exatom's dashboard, requiring time to fully understand its features.
  • Users find the steep learning curve of Exatom's dashboard challenging, especially for newcomers and complex forms.
  • Users find the complex usability of Exatom challenging, especially when handling numerous KPIs and intricate forms.
  • Users find the lack of information clarity in Exatom's dashboard can lead to confusion and a steep learning curve.

What Are Recent G2 Reviews of Exatom?

daasity

Daasity enables omnichannel consumer brands to be data-driven. Built by analysts and engineers, the Daasity platform supports the varied data architecture, analytics, and reporting needs of consumer brands selling via eCommerce, Amazon, retail, and wholesale. Using Daasity, teams across the organization get a centralized and normalized view of all their data, regardless of the tools in their tech stack and how their future data needs may change. For more information about Daasity, our 60+ integrations, and how the platform drives more profitable growth for 1600+ brands, visit us at Daasity.com.

Average Rating: 4.7/5.0

Total Reviews: 17

How Do G2 Users Rate daasity?

  • Has the product been a good partner in doing business?: 9.2/10 (Category avg: 9.2/10)
  • Reports: 9.3/10 (Category avg: 8.8/10)
  • Campaign Tracking: 8.3/10 (Category avg: 8.3/10)
  • Web Analytics: 9.0/10 (Category avg: 8.7/10)

Who Is the Company Behind daasity?

  • Seller: daasity
  • Year Founded: 2017
  • HQ Location: San Diego, US
  • Twitter: @Daasity
    186 Twitter followers
  • LinkedIn® Page: www.linkedin.com
    36 employees on LinkedIn®

Who Uses This Product?

  • Top Industries: Consumer Goods
  • Company Size: 47% Medium, 47% Small

What Do G2 Reviewers Say About daasity?

AI-generated summary from verified user reviews

Pros
  • Users find the comprehensive integrations and dashboard templates of Daasity exceptionally helpful for data visualization.
  • Users commend the excellent customer support of Daasity, noting helpful documentation and guidance for their projects.
  • Users appreciate the easy-to-use dashboard templates for creating visualizations, streamlining their data analysis processes.
  • Users find the documentation helpful for easy integration and visualization even for non-experts.
  • Users find Daasity's platform easy to use with templates and integrations that simplify data visualization.
Cons
  • Users find the dashboard issues in Daasity challenging due to its steep learning curve and limited interactivity.
  • Users find the steep learning curve of Daasity challenging, affecting ease of use for quick dashboard access.
  • Users find the steep learning curve of Daasity challenging, especially for prototyping and creating interactive dashboards.
  • Users find the steep learning curve challenging due to extensive coding requirements for data modeling in Daasity.
  • Users find the steep learning curve and extensive coding for data modeling in Daasity challenging for efficient use.

What Are Recent G2 Reviews of daasity?

Conjura

Profit powered by data. Let Conjura optimise your eCommerce performance by taking out the guesswork with our recommendation engine. Take action with Conjura to make your business profitable.

Average Rating: 4.7/5.0

Total Reviews: 22

How Do G2 Users Rate Conjura?

  • Has the product been a good partner in doing business?: 9.4/10 (Category avg: 9.2/10)
  • Reports: 8.9/10 (Category avg: 8.8/10)
  • Campaign Tracking: 8.5/10 (Category avg: 8.3/10)
  • Web Analytics: 8.8/10 (Category avg: 8.7/10)

Who Is the Company Behind Conjura?

  • Seller: Conjura
  • Year Founded: 2018
  • HQ Location: London, England
  • Twitter: @Conjura_
    232 Twitter followers
  • LinkedIn® Page: www.linkedin.com
    20 employees on LinkedIn®

Who Uses This Product?

  • Top Industries: Retail
  • Company Size: 59% Small, 27% Medium

What Are Recent G2 Reviews of Conjura?

What Are G2 Users Discussing About Conjura?

DataFeedWatch

What is DataFeedWatch? DataFeedWatch is a Feed Marketing solution that combines data transformation & optimization with help & advice. It empowers Merchants and Agencies to succeed on ecommerce channels. With DataFeedWatch you can optimize your product feed file and spread products to different channels in 60+ countries! By improving your product feed you'll also increase the performance of advertising campaigns on channels like Google Shopping, Facebook, Instagram, Amazon, eBay & many more! Optimizing your product list will speed your sales and boost your overall campaign ROI. You can use pre-loaded templates and AI features (NEW!) to create optimized feeds - no coding or IT team needed. DataFeedWatch enables you to create complex rules for your shopping feeds with ease. Plus you can enjoy a 15-day free trial and 24/7 support!

Average Rating: 4.7/5.0

Total Reviews: 129

How Do G2 Users Rate DataFeedWatch?

  • Has the product been a good partner in doing business?: 9.3/10 (Category avg: 9.2/10)
  • Reports: 7.7/10 (Category avg: 8.8/10)
  • Campaign Tracking: 6.8/10 (Category avg: 8.3/10)
  • Web Analytics: 7.7/10 (Category avg: 8.7/10)

Who Is the Company Behind DataFeedWatch?

Who Uses This Product?

  • Top Industries: Retail, Marketing and Advertising
  • Company Size: 75% Small, 19% Medium

What Do G2 Reviewers Say About DataFeedWatch?

AI-generated summary from verified user reviews

Pros
  • Users praise the responsive customer support of DataFeedWatch, highlighting quick assistance from real people like Ivan.
  • Users find the customer support responsive and quick, resolving issues efficiently and enhancing overall satisfaction.
  • Users value the quick response time of DataFeedWatch's support team, ensuring rapid resolution of issues.
  • Users value the super quick live chat support from DataFeedWatch, receiving timely help from real people.
  • Users appreciate the quick solutions provided by DataFeedWatch's live chat, ensuring fast and effective assistance.
Cons
  • Users desire a more intuitive UX for easier navigation and better visual guidance in DataFeedWatch.
  • Users find the complexity of DataFeedWatch makes navigation difficult and requires additional support for effective use.
  • Users find the complex usability of DataFeedWatch challenging, feeling caught between too many features and limited automation.
  • Users face data management issues when trying to manage feeds independently, complicating their overall experience.
  • Users find the difficult learning curve frustrating, as the system lacks clarity and comprehensive functionality.

What Are Recent G2 Reviews of DataFeedWatch?

What Are G2 Users Discussing About DataFeedWatch?

Air360

The go-to-platform for an easy to start, conversion rate optimization. Air360 is a AI-powered digital experience analytics software that uncovers user behavior and optimizes conversion rates of your website and mobile app. It uncovers hidden user behaviors across customer journeys.

Average Rating: 4.6/5.0

Total Reviews: 18

How Do G2 Users Rate Air360?

  • Has the product been a good partner in doing business?: 9.6/10 (Category avg: 9.2/10)
  • Reports: 9.7/10 (Category avg: 8.8/10)
  • Campaign Tracking: 9.4/10 (Category avg: 8.3/10)
  • Web Analytics: 9.4/10 (Category avg: 8.7/10)

Who Is the Company Behind Air360?

  • Seller: Air360
  • Year Founded: 2016
  • HQ Location: Tokyo, Japan
  • Twitter: @weareair360
    203 Twitter followers
  • LinkedIn® Page: www.linkedin.com
    13 employees on LinkedIn®

Who Uses This Product?

  • Company Size: 63% Small, 32% Medium

What Do G2 Reviewers Say About Air360?

AI-generated summary from verified user reviews

Pros
  • Users value Air360 for its intuitive interface and no-code implementation, making user behavior analysis straightforward and effective.
  • Users commend Air360 for its sharp focus on actionable insights, significantly enhancing website conversion rates and user understanding.
  • Users love the ease of use of Air360, appreciating its intuitive interface and no-code implementation for actionable insights.
  • Users value the actionable insights provided by Air360, enhancing website conversion through intuitive heatmaps and user behavior tracking.
  • Users value the insightful analytics from Air360, enabling effective conversion optimization and user behavior understanding.
Cons
  • Users find the complexity of Air360 overwhelming initially, requiring time to learn its various features.
  • Users find Air360's features overwhelming at first, experiencing a difficult learning curve to fully utilize the data effectively.
  • Users find the pricing comparatively high, particularly impacting startups despite the valuable features offered.
  • Users find the feature overload in Air360 overwhelming initially, requiring time to learn how to use everything effectively.
  • Users find filtering issues with Air360, as advanced options are limited and lack automation for alerts and segments.

What Are Recent G2 Reviews of Air360?

What Are G2 Users Discussing About Air360?

Consequential

Out Of The Blue is an AI-powered health-monitoring platform for eCommerce brands to drive top-line revenue growth and drive down costs. We do this by reducing revenue loss, leakages and missed revenue capture by monitoring site errors across your tech stack We also improve conversion by highlighting revenue-impacting CX issues and opportunities across the buyer journey. In short, we work 24*7 behind the scenes to drive time-critical interventions by detecting, diagnosing, and explaining why metrics are moving to be able to take proactive rather than reactive actions. In just 3 simple steps, you can gain valuable insights from your data and keep your business on track. -You choose Out Of The Blue with any Data Source- We provide support for all major Shopify brand connectors- across marketing, sales, and analytics. -Next, you onboard your data into our Metrics Hub, where you refine your KPIs and business metrics with our Semantic Layer, set extraction preferences, and let us handle the rest. -You are now live & will start getting insights in your mail, on Slack, or through other channels via webhooks. With Out Of The Blue, ecommerce growth teams can finally: -Gain the insights they need to improve your eCommerce site experience and product category performance. -Get alerted within minutes when customers aren’t having a broken experience related to purchasing, finding items, registering, or logging in, so you can fix it before your revenue is impacted. -Uncover outperforming and soft categories across your products. -Automate analyzing your data at a granular level by county, channel, and product category or more. -Get a weekly digest that includes a list of issues stack-ranked by their revenue impact, so you can refocus on what isn’t important—rather than what’s urgent. Our customers include growth oriented brands like Poshmark, True Classic, Abbott Lyon and more

Average Rating: 4.6/5.0

Total Reviews: 25

How Do G2 Users Rate Consequential?

  • Has the product been a good partner in doing business?: 9.7/10 (Category avg: 9.2/10)
  • Reports: 8.5/10 (Category avg: 8.8/10)
  • Campaign Tracking: 7.9/10 (Category avg: 8.3/10)
  • Web Analytics: 9.0/10 (Category avg: 8.7/10)

Who Is the Company Behind Consequential?

  • Seller: Consequential
  • Year Founded: 2021
  • HQ Location: San Carlos, US
  • Twitter: @OutoftheblueAI
    12 Twitter followers
  • LinkedIn® Page: www.linkedin.com
    51 employees on LinkedIn®

Who Uses This Product?

  • Top Industries: Computer Software
  • Company Size: 88% Small, 8% Large

What Do G2 Reviewers Say About Consequential?

AI-generated summary from verified user reviews

Pros
  • Users value the comprehensive insights of Out Of The Blue, enhancing site health and improving customer experience.
  • Users value time-saving alerts from Out Of The Blue, enhancing efficiency in resolving revenue issues swiftly.
  • Users value the real-time updates from Out Of The Blue, enabling quick resolutions and preventing revenue loss.
  • Users value the easy integrations of Out Of The Blue, allowing seamless data tracking and improved business insights.
  • Users value the instant error alerts in Out Of The Blue, enabling quick resolutions and minimizing financial loss.
Cons
  • Users find the onboarding process complicated, suggesting improvements for a smoother start with Out Of The Blue.
  • Users find the onboarding process complex, wishing for a more simplified experience to enhance usability.
  • Users find the complex setup for third-party integrations frustrating, wishing for a more streamlined onboarding process.
  • Users struggle with the difficult setup of Out Of The Blue, requiring prior knowledge that can be challenging.
  • Users find the pricing and subscription plans problematic, making it difficult to justify the overall costs.

What Are Recent G2 Reviews of Consequential?

Profitero+

Profitero+ is the leading digital commerce company, trusted by more than 9,000 brands worldwide. We help brands break down silos and turn data into decisive action through intelligence-driven, end-to-end solutions that unify media, content, operations and strategy. Powered by advanced AI, robust digital shelf analytics across 1,400+ retailers in 70 countries and unmatched expertise from digital commerce specialists in 15 global hubs, our integrated solutions help brands accelerate profitable growth. Learn more at profitero.com.

Average Rating: 4.3/5.0

Total Reviews: 26

How Do G2 Users Rate Profitero+?

  • Has the product been a good partner in doing business?: 8.8/10 (Category avg: 9.2/10)
  • Reports: 8.2/10 (Category avg: 8.8/10)
  • Campaign Tracking: 6.7/10 (Category avg: 8.3/10)
  • Web Analytics: 7.2/10 (Category avg: 8.7/10)

Who Is the Company Behind Profitero+?

Who Uses This Product?

  • Top Industries: Consumer Goods, Food & Beverages
  • Company Size: 52% Large, 30% Medium

What Do G2 Reviewers Say About Profitero+?

AI-generated summary from verified user reviews

Pros
  • Users value the broad retailer coverage of Profitero+, leading to actionable insights and improved media ROI.
  • Users value the broad retailer coverage of Profitero+, enhancing visibility into availability, pricing, and performance insights.
  • Users value the comprehensive retail coverage of Profitero+, enabling effective management of pricing and availability.
  • Users value the customizability of Profitero+, allowing tailored insights that enhance their retail strategies effectively.
  • Users value the data accuracy of Profitero+, enabling informed decision-making for retail performance and media ROI.
Cons
  • Users find the complex navigation of Profitero+ requires extra effort to obtain straightforward insights and data.
  • Users experience data inaccuracy with Profitero+, affecting timely decision-making and making navigation unnecessarily complex.
  • Users experience data management issues with Profitero+, citing delays and complexity that hinder timely decision-making.
  • Users find difficult learning curves with Profitero+, as navigating the tool complicates extracting essential insights efficiently.
  • Users face integration issues with Profitero+, limiting efficiency and complicating connections between spend and outcomes.

What Are Recent G2 Reviews of Profitero+?

AiHello

AIHello manages inventory across ecommerce sites and uses machine learning algorithms and deep learning to accurately optimize product.

Average Rating: 4.6/5.0

Total Reviews: 11

How Do G2 Users Rate AiHello?

  • Has the product been a good partner in doing business?: 10.0/10 (Category avg: 9.2/10)
  • Reports: 9.7/10 (Category avg: 8.8/10)
  • Campaign Tracking: 9.3/10 (Category avg: 8.3/10)
  • Web Analytics: 9.0/10 (Category avg: 8.7/10)

Who Is the Company Behind AiHello?

  • Seller: Aihello
  • HQ Location: Toronto, Ontario
  • Twitter: @AiHellos
    1,645 Twitter followers
  • LinkedIn® Page: www.linkedin.com
    40 employees on LinkedIn®

Who Uses This Product?

  • Company Size: 93% Small, 7% Medium

What Are Recent G2 Reviews of AiHello?

What Are G2 Users Discussing About AiHello?

Kissmetrics

Get, keep and grow more customers with Customer Engagement Automation by Kissmetrics. Behavioral analytics, segmentation and email campaign automation all in one place. Deeply understand and uniquely engage each customer from prospect to advocate. Built to help marketers and product teams increase conversions, engagement and retention.

Average Rating: 4.1/5.0

Total Reviews: 164

How Do G2 Users Rate Kissmetrics?

  • Has the product been a good partner in doing business?: 8.4/10 (Category avg: 9.2/10)
  • Reports: 9.7/10 (Category avg: 8.8/10)
  • Campaign Tracking: 9.5/10 (Category avg: 8.3/10)
  • Web Analytics: 9.2/10 (Category avg: 8.7/10)

Who Is the Company Behind Kissmetrics?

  • Seller: Kissmetrics
  • Year Founded: 2008
  • HQ Location: San Francisco, CA
  • Twitter: @Kissmetrics
    203,840 Twitter followers
  • LinkedIn® Page: www.linkedin.com
    40 employees on LinkedIn®

Who Uses This Product?

  • Top Industries: Computer Software, Internet
  • Company Size: 54% Small, 34% Medium

What Are Recent G2 Reviews of Kissmetrics?

What Are G2 Users Discussing About Kissmetrics?

Polar Analytics

Polar Analytics is the easiest way for brands to dig into their data and understand how their business is doing. No migration or setup is required. We do all the heavy lifting for you. Connect all your data sources in one click, make informed decisions in minutes, and say goodbye to manual reporting. Polar is equivalent to having Supermetrics + Data Studio + A Data-Scientist into one app. Trusted by over 1500+ Shopify stores including Fanjoy, Hero Cosmetics, Soko Glam, AYBL, and From Future. You can use the platform to: - Optimize Customer Acquisition and manage performance marketing more effectively - Automate your Reporting and never download CSVs again - Increase Retention and LTV with the most robust views on retention and repeat orders for Shopify Stores - Improve merchandising with advanced reports on Product Analytics - Improve Engagement marketing with advanced email marketing reports Here's what you get: 10+ Data Connectors Unlock the full potential of your eCommerce and marketing data with pre-built integrations for Shopify, Google Analytics, Google Ads, Facebook Ads, Bing Ads, Pinterest Ads, Tiktok Ads, Snapchat Ads, Klaviyo, and Google Sheets. All-in-one Actionable Analytics Dashboard Get all the key advanced reports you need to monitor and improve your marketing spend, CAC (Acquisition Costs), LTV (Customer Lifetime Value), Cohorts, ROAS, and more. Multi Brands and Multi Shopify Stores capabilities Aggregate data from all your Shopify stores in the app. Create views to segment this data by Country or by brand if you are an agency or an e-commerce venture studio Smart Alerts and Insights You can set smart alerts on your most important KPIs: drop in conversion rate, increase in Customer Acquisition Cost, etc. Get notified immediately via e-mail or Slack. Email and Slack Snapshots reports Schedule Email or Slack Snapshots. Choose the metrics and frequency you want and share them with your team. Unlimited Users Share the dashboard with team members, contractors, or investors. Give visibility on your most important KPIs and align your team on what's next. Agency Plans Provide analytics and Reporting as part of your agency services. Centralize all your clients in one place to improve Customer retention and save time doing manual reporting.

Average Rating: 4.7/5.0

Total Reviews: 23

How Do G2 Users Rate Polar Analytics?

  • Has the product been a good partner in doing business?: 9.2/10 (Category avg: 9.2/10)
  • Reports: 9.4/10 (Category avg: 8.8/10)
  • Campaign Tracking: 8.8/10 (Category avg: 8.3/10)
  • Web Analytics: 8.5/10 (Category avg: 8.7/10)

Who Is the Company Behind Polar Analytics?

  • Seller: Polar Analytics
  • Year Founded: 2020
  • HQ Location: Paris, FR
  • Twitter: @polar_analytics
    486 Twitter followers
  • LinkedIn® Page: www.linkedin.com
    35 employees on LinkedIn®

Who Uses This Product?

  • Top Industries: Retail
  • Company Size: 83% Small, 17% Medium

What Do G2 Reviewers Say About Polar Analytics?

AI-generated summary from verified user reviews

Pros
  • Users admire the responsive customer support of Polar Analytics, appreciating their helpfulness and dedication to user success.
  • Users love the ease of use with Polar Analytics, enabling quick setup and seamless dashboard creation.
  • Users appreciate the helpful support team of Polar Analytics, always ready to assist and improve user experience.
  • Users value the consolidated reporting capabilities of Polar Analytics, enabling efficient data-driven decision making across their business.
  • Users commend the fast response time of Polar Analytics' support team, enhancing their overall experience and functionality.
Cons
  • Users face integration issues requiring support intervention, which complicates and slows down the setup process for data sources.
  • Users face significant API issues that delay real-time data availability and complicate integration with other platforms.
  • Users experience poor customer support, with slow response times that hinder timely data integration and assistance.
  • Users face connector issues as custom integrations necessitate support, hindering quick access to data sources.
  • Users face data management issues due to slow response times and difficulties in connecting important data sources.

What Are Recent G2 Reviews of Polar Analytics?

What Are G2 Users Discussing About Polar Analytics?

TWIPLA

TWIPLA is a privacy-flexible analytics platform built for a web where traditional tools miss most visitor activity. Cookies, consent banners, ad blockers, and browser-based tracking prevention obscure up to 60–80% of site activity, leaving teams to make decisions based on incomplete or sampled data. TWIPLA restores full traffic visibility by capturing data without invasive tracking or cookie dependence. This approach preserves complete, real-time insights across individual sites or entire domain portfolios, enhanced by AI analytics. Configurable privacy modes align the integration with GDPR, CCPA, and ePrivacy requirements. The platform combines over 20 core analytics tools and behavior intelligence in one suite, including session recordings, heatmaps, funnels, event tracking, and custom dashboards, allowing teams to move seamlessly from high-level trends to individual visitor journeys, connecting behavior and conversion opportunities without blind spots or data siloes. Trusted by over 2.5 million websites, including Wix and the Technical University of Munich, TWIPLA is used by organizations and digital teams across industries and regions worldwide. TWIPLA is available on a free forever plan, alongside a 30-day premium trial that lets you explore the features and traffic limits that best match your organization's needs.

Average Rating: 4.5/5.0

Total Reviews: 43

How Do G2 Users Rate TWIPLA?

  • Has the product been a good partner in doing business?: 9.4/10 (Category avg: 9.2/10)

Who Is the Company Behind TWIPLA?

  • Seller: TWIPLA
  • Year Founded: 2016
  • HQ Location: München, Bayern
  • Twitter: @ViAnalytics
    625 Twitter followers
  • LinkedIn® Page: www.linkedin.com
    21 employees on LinkedIn®
  • Ownership: Bootstrapped

Who Uses This Product?

  • Top Industries: Marketing and Advertising
  • Company Size: 72% Small, 22% Medium

What Do G2 Reviewers Say About TWIPLA?

AI-generated summary from verified user reviews

Pros
  • Users praise TWIPLA for its intuitive analytics and privacy-first design, making website intelligence accessible and effective.
  • Users value the intuitive and action-focused analytics of TWIPLA, making website analysis easier and more effective.
  • Users value the insightful tracking information from TWIPLA, enhancing their understanding of customer behavior and website performance.
  • Users value the insightful visitor tracking of TWIPLA, greatly aiding in website enhancement and business growth.
  • Users praise the deep customer insights offered by TWIPLA, enhancing their understanding of visitor interactions and behaviors.
Cons
  • Users feel that TWIPLA is too expensive, especially for small businesses and non-revenue generating organizations.
  • Users express concerns over inadequate tracking due to fixed attribution models that limit customization for sales cycles.
  • Users find TWIPLA's pricing burdensome, especially for small businesses, making it hard to justify the cost.
  • Users face survey visibility issues and limited customization in Turkish, impacting their overall satisfaction.
  • Users express frustration over the limited tracking issues with TWIPLA, affecting the ability to customize attribution windows.

What Are Recent G2 Reviews of TWIPLA?

What Are G2 Users Discussing About TWIPLA?

Bright Data

Bright Data is the leading web data infrastructure company, trusted by 50,000+ organizations worldwide including 14 of the top 20 global AI labs to access, collect, and deliver public web data at scale. Teams use Bright Data to turn the public web into structured, actionable intelligence: training and grounding AI models, monitoring markets, enriching BI systems, tracking search results, analyzing eCommerce and travel data, supporting financial research, and automating competitive intelligence. The platform is built for production-scale operations, with 400M+ IPs across 195 countries and 99.99% uptime. What Bright Data offers: - Web Access APIs: Reliable, compliant access to any public website at scale - Scraper APIs & Scraper Studio: AI-powered workspace for building, testing, and deploying extraction workflows using natural language prompts - Ready-to-use datasets & real-time data feeds: Structured, AI-ready data with zero infrastructure overhead - MCP Server: Connects AI agents and assistants to live web data for search, browsing, extraction, and LLM grounding, no pipelines required - Browser API & SERP API: Automate browser interactions and search data collection - CLI & developer APIs: Build and manage workflows from existing development environments Who uses Bright Data: AI teams, data engineers, developers, analysts, business intelligence teams, researchers, and enterprise data operations across AI/ML, finance, eCommerce, travel, marketing, and more. Key use cases: AI training and grounding - LLM data pipelines - agentic web access - market intelligence - price monitoring - eCommerce analytics · SERP tracking - brand protection - ad verification - financial data collection - academic research - competitive intelligence Bright Data aligns with GDPR, CCPA, SOC 2 Type II, and ISO 27001, and is a founding member of the Alliance for Responsible Data Collection (ARDC).

Average Rating: 4.7/5.0

Total Reviews: 341

How Do G2 Users Rate Bright Data?

  • Has the product been a good partner in doing business?: 9.1/10 (Category avg: 9.2/10)
  • Reports: 8.7/10 (Category avg: 8.8/10)
  • Campaign Tracking: 7.7/10 (Category avg: 8.3/10)
  • Web Analytics: 8.7/10 (Category avg: 8.7/10)

Who Is the Company Behind Bright Data?

  • Seller: bright data
  • Company Website:
  • Year Founded: 2014
  • HQ Location: Greater Tel Aviv, IL
  • LinkedIn® Page: www.linkedin.com
    366 employees on LinkedIn®

Who Uses This Product?

  • Who Uses This: CEO, Founder
  • Top Industries: Information Technology and Services, Research
  • Company Size: 60% Small, 20% Medium

What Do G2 Reviewers Say About Bright Data?

AI-generated summary from verified user reviews

Pros
  • Users commend Bright Data for its exceptional customer support, providing timely and helpful assistance throughout their experience.
  • Users find Bright Data's ease of use exceptional, enabling seamless data scraping and integration for research purposes.
  • Users appreciate the reliable data collection services of Bright Data, emphasizing their efficiency and outstanding support.
  • Users appreciate the seamless data collection capabilities of Bright Data, enhancing research efficiency and market insights.
  • Users commend the fast response time of Bright Data's support team, ensuring quick problem resolution and excellent service.
Cons
  • Users note a limited dataset and tool range in Bright Data, necessitating custom solutions and additional tools.
  • Users find Bright Data to be expensive, making it less suitable for smaller teams or budget-conscious projects.
  • Users find Bright Data has a steep learning curve, often struggling with documentation and debugging complications.
  • Users highlight pricing issues with Bright Data, making it challenging for smaller teams and budget-limited projects.
  • Users find difficult learning with Bright Data due to insufficient documentation and complex setups, hindering effective usage.

What Are Recent G2 Reviews of Bright Data?

What Are G2 Users Discussing About Bright Data?

inte.ly

intely (inte.ly) is a Business Intelligence, Insights & Analytics platform for retail & wholesale businesses.

Average Rating: 4.0/5.0

Total Reviews: 11

How Do G2 Users Rate inte.ly?

  • Has the product been a good partner in doing business?: 9.2/10 (Category avg: 9.2/10)
  • Reports: 8.3/10 (Category avg: 8.8/10)
  • Campaign Tracking: 7.7/10 (Category avg: 8.3/10)
  • Web Analytics: 9.0/10 (Category avg: 8.7/10)

Who Is the Company Behind inte.ly?

Who Uses This Product?

  • Company Size: 91% Small, 9% Large

What Are Recent G2 Reviews of inte.ly?

Sellerise

Sellerise is a comprehensive amazon seller software solution designed specifically for amazon sellers. Our goal is to help fba and fbm sellers increase their efficiency and effectiveness by providing them with a range of powerful tools, including: * Financial analytics, * Keyword optimization, * Instant notifications about product listing changes, * Review and rating management, * Inventory management, * FBA reimbursement, * And many more advanced tools. Sellerise is an official Amazon software partner and helps sellers to: * Better understand and optimize their business performance, * Improve their ranking on Amazon, * Manage customer feedback and ratings, * Avoid overselling, * Recover fees and expenses, * Manage their listings and orders on the platform. To manage and scale your business on Amazon, feel free to learn more at: https://sellerise.com/.

Average Rating: 4.8/5.0

Total Reviews: 16

How Do G2 Users Rate Sellerise?

  • Has the product been a good partner in doing business?: 10.0/10 (Category avg: 9.2/10)
  • Reports: 8.9/10 (Category avg: 8.8/10)
  • Campaign Tracking: 8.7/10 (Category avg: 8.3/10)
  • Web Analytics: 8.3/10 (Category avg: 8.7/10)

Who Is the Company Behind Sellerise?

Who Uses This Product?

  • Top Industries: Retail
  • Company Size: 100% Small

What Are Recent G2 Reviews of Sellerise?

Subhransu Sahu
SS
Researched and written by Subhransu Sahu
Updated October 3, 2024