Best Product Analytics Software for Small Business - Page 2

How Many Product Analytics Software Products Does G2 Track?

Total Products under this Category: 103

Category Stats (Sep 2026)

  • Average Rating: 4.53/5 (↓0.01 vs Aug 2026) The average rating of products in this category, based on all submitted ratings
  • Top Trending Product: Insightech (+0.13%) - Among all products in this category, Insightech recorded the largest rating increase compared to last month

Last updated: September 01, 2026

How Does G2 Rank Product Analytics Software Products?

Why You Can Trust G2's Software Rankings:

  • 30 Analysts and Data Experts
  • 22,800+ Authentic Reviews
  • 103+ Products
  • Unbiased Rankings

G2's software rankings are built on verified user reviews, rigorous moderation, and a consistent research methodology maintained by a team of analysts and data experts. Each product is measured using the same transparent criteria, with no paid placement or vendor influence. While reviews reflect real user experiences, which can be subjective, they offer valuable insight into how software performs in the hands of professionals. Together, these inputs power the G2 Score, a standardized way to compare tools within every category.

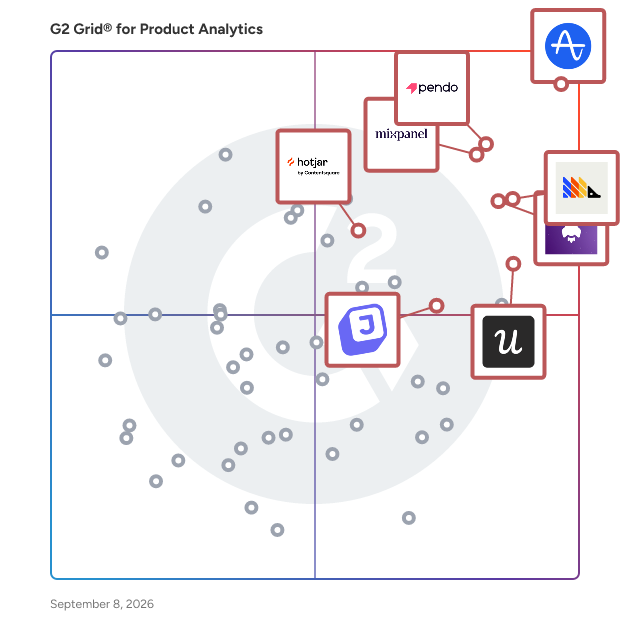
G2 Grid® for Product Analytics Software

G2 Grid® for Product Analytics Software plotting products by satisfaction and market presence

Highlighted products: Amplitude Analytics, PostHog, LogRocket, Mixpanel, Userpilot, Hotjar by Contentsquare, Pendo, and June Analytics.

Underlying data: [Grid® JSON](https://www.g2.com/categories/product-analytics/grids.json?focus%5B%5D=amplitude-analytics&focus%5B%5D=posthog&focus%5B%5D=logrocket&focus%5B%5D=mixpanel&focus%5B%5D=userpilot&focus%5B%5D=hotjar-by-contentsquare&focus%5B%5D=pendo-io-pendo&focus%5B%5D=june-analytics&segment=small-business)

Fullstory

Fullstory is a behavioral data and analytics platform that helps technology leaders and digital experience teams understand their digital story so they can drive better digital experiences. Customer-centric enterprises rely on Fullstory to uncover and eliminate the friction buried between clicks and across workflows, turning frustrated visitors and employees into unwavering advocates. From proactively highlighting areas for optimization to triggering real-time personalization that genuinely resonates, Fullstory’s behavioral data with agentic AI provides deeper and more immediately actionable insights beyond conventional web and product analytics. While other tools require extensive manual tagging that can lead to missed insights, Fullstory automatically collects, structures, and enriches the full spectrum of behavioral data from digital activities. Diagnostics on what users play and pause, what they copy and paste, where they zoom in & out, what apps are in use, then translates those behaviors into actions, insights, and recommendations, all aiding to improve customer and employee journeys. Agentic AI proactively highlights issues and provides recommendations to eliminate gaps in the digital experience, driving improved business outcomes. With a deeper understanding of customer and employee journeys, Fullstory provides the context needed to improve digital experiences, accelerate decision-making, and create human-centered experiences that drive revenue and reduce spend, faster.

Average Rating: 4.5/5.0

Total Reviews: 1,033

How Do G2 Users Rate Fullstory?

  • User Scoring: 7.3/10 (Category avg: 8.1/10)
  • Integrations: 7.5/10 (Category avg: 8.2/10)
  • Multi-Product Analytics: 7.7/10 (Category avg: 8.2/10)
  • Has the product been a good partner in doing business?: 9.0/10 (Category avg: 9.1/10)

Who Is the Company Behind Fullstory?

  • Seller: Fullstory
  • Company Website:
  • Year Founded: 2014
  • HQ Location: Atlanta, GA
  • Twitter: @fullstory
    4,890 Twitter followers
  • LinkedIn® Page: www.linkedin.com
    548 employees on LinkedIn®

Who Uses This Product?

  • Who Uses This: Product Manager, Senior Product Manager
  • Top Industries: Computer Software, Information Technology and Services
  • Company Size: 44% Medium, 37% Small

What Do G2 Reviewers Say About Fullstory?

AI-generated summary from verified user reviews

Pros
  • Users find Fullstory's intuitive user interface easy to navigate, enhancing their overall experience and efficiency.
  • Users value Fullstory for its ability to illuminate customer feedback, enhancing understanding of user behavior and issues.
  • Users appreciate the responsive customer support from Fullstory, enhancing experience and ensuring effective tool usage.
  • Users value the ease of use and insightful support from Fullstory, enhancing their understanding of user behavior.
  • Users appreciate the detailed data analytics from FullStory, enabling insight into customer behavior and experience improvements.
Cons
  • Users report a steep learning curve, but appreciate the helpful support for navigating the complex features.
  • Users face customization limitations and performance issues, making the tool less effective for their needs.
  • Users find missing features in FullStory, such as time filtering and better historical data access, limiting usability.
  • Users find difficulty in data governance and customization, making reporting and sharing complex for new users.
  • Users express frustration with limited features, especially regarding journey creation and data sharing options.

What Are Recent G2 Reviews of Fullstory?

What Are G2 Users Discussing About Fullstory?

GrowthBook

GrowthBook is the most popular open source experimentation and feature flagging platform. Created in 2021 , GrowthBook is a modern and highly customizable platform that works with your unique needs and data structures. Get all the power of a custom in-house platform without having to build it yourself. GrowthBook features high performance SDKs in most popular languages for feature flags, and is architected to not be in the critical rendering path. Our A/B testing platform uses your existing data warehouse, and can be completely customized to your data needs. We support most popular event tracking tools, as well as custom support for most data warehouses- we even support Mixpanel and Google Analytics. No black-box! Get complete transparency into your data, view queries, and even export to Jupyter notebooks.

Average Rating: 4.6/5.0

Total Reviews: 26

How Do G2 Users Rate GrowthBook?

  • Has the product been a good partner in doing business?: 8.6/10 (Category avg: 9.1/10)

Who Is the Company Behind GrowthBook?

  • Seller: GrowthBook
  • Year Founded: 2020
  • HQ Location: Palo Alto, California
  • LinkedIn® Page: www.linkedin.com
    48 employees on LinkedIn®

Who Uses This Product?

  • Top Industries: Computer Software
  • Company Size: 54% Small, 46% Medium

What Do G2 Reviewers Say About GrowthBook?

AI-generated summary from verified user reviews

Pros
  • Users value the ease of data analysis with GrowthBook, appreciating its flexibility and simplicity in implementation.
  • Users find GrowthBook's A/B testing capabilities effective and appreciate the outstanding customer support provided.
  • Users value the comprehensive solutions of GrowthBook, appreciating easy implementation and flexible data connections.
  • Users praise the outstanding customer support of GrowthBook for quickly resolving issues and providing valuable guidance.
  • Users value the ease of use in implementing and managing tests with GrowthBook, enhancing their data analysis processes.
Cons
  • Users report a lack of preview options for server side experiments, resulting in difficulties managing tests effectively.
  • Users find the learning curve steep due to limited use cases and support during the onboarding process.
  • Users find the lack of preview for server-side experiments without activating tests to be a significant limitation.

What Are Recent G2 Reviews of GrowthBook?

Whatfix

Whatfix is the AI-native Digital Adoption Platform built for the modern enterprise. It’s the only platform to unify pre-production simulation training, in-workflow guidance and support, and adoption analytics for continuous optimization, driving business outcomes from enterprise software.

Average Rating: 4.5/5.0

Total Reviews: 540

How Do G2 Users Rate Whatfix?

  • User Scoring: 7.0/10 (Category avg: 8.1/10)
  • Integrations: 7.4/10 (Category avg: 8.2/10)
  • Multi-Product Analytics: 7.2/10 (Category avg: 8.2/10)
  • Has the product been a good partner in doing business?: 9.5/10 (Category avg: 9.1/10)

Who Is the Company Behind Whatfix?

  • Seller: Whatfix
  • Company Website:
  • Year Founded: 2013
  • HQ Location: San Jose, CA
  • Twitter: @whatfix
    3,096 Twitter followers
  • LinkedIn® Page: www.linkedin.com
    1,102 employees on LinkedIn®

Who Uses This Product?

  • Who Uses This: Product Manager, Project Manager
  • Top Industries: Computer Software, Information Technology and Services
  • Company Size: 45% Large, 36% Medium

What Do G2 Reviewers Say About Whatfix?

AI-generated summary from verified user reviews

Pros
  • Users appreciate the ease of use of Whatfix, allowing effortless content creation without coding expertise.
  • Users praise the unmatched customer support from Whatfix, facilitating smooth onboarding and effective tool implementation.
  • Users appreciate the user-friendly navigation of Whatfix, streamlining training and enhancing understanding of SaaS tools.
  • Users appreciate the ease of content creation with Whatfix, enjoying quick support and seamless implementation.
  • Users appreciate the intuitive no-code authoring of Whatfix, enabling seamless in-app guidance tailored to various user needs.
Cons
  • Users find the learning curve steep, requiring significant time and technical support for an effective setup.
  • Users find the complexity of setup and configuration challenging, often requiring technical support for advanced features.
  • Users find the steep learning curve of Whatfix challenging, often requiring additional support and time to master.
  • Users find content library maintenance clunky and analytics limitations hinder usability, affecting the overall experience.
  • Users find the translation process and enablement sessions to be time-consuming, impacting overall productivity and engagement.

What Are Recent G2 Reviews of Whatfix?

What Are G2 Users Discussing About Whatfix?

TelemetryDeck

TelemetryDeck is a privacy-first analytics platform designed for product teams developers who want to understand their users — without ever compromising their privacy. Founded in 2020 in Augsburg, Germany, TelemetryDeck helps thousands of developers and companies worldwide make data-driven decisions in a fully GDPR-compliant way. Key Features - Privacy-First Analytics: Collects no personal data, uses double-hashing and anonymization by design. - Real-Time Dashboards: Instant insights into user engagement, retention, and growth. - Powerful Notebooks: Flexible queries and visualizations to explore data interactively. - Funnels & Activation Metrics: Understand onboarding, conversion, and retention without tracking individuals. - Easy SDK Integration: Native SDKs for Swift, Kotlin, Flutter, React Native, and more. - Enterprise-Ready: SSO (Okta), dedicated namespaces, and custom support options available. Why TelemetryDeck TelemetryDeck helps developers and product teams understand how people use their products — ethically, securely, and affordably. By anonymizing all personally identifiable information, TelemetryDeck ensures full compliance with global privacy laws while still providing meaningful, actionable analytics. Our customers use TelemetryDeck to: - Optimize app performance and user experience - Track feature adoption and engagement - Report KPIs to stakeholders confidently - Replace invasive analytics tools like Google Analytics or Firebase with a privacy-safe alternative TelemetryDeck: analytics you can be proud of.

Average Rating: 4.6/5.0

Total Reviews: 13

How Do G2 Users Rate TelemetryDeck?

  • Has the product been a good partner in doing business?: 10.0/10 (Category avg: 9.1/10)

Who Is the Company Behind TelemetryDeck?

Who Uses This Product?

  • Top Industries: Computer Software
  • Company Size: 85% Small

What Do G2 Reviewers Say About TelemetryDeck?

AI-generated summary from verified user reviews

Pros
  • Users love the ease of use of TelemetryDeck, appreciating its simple setup and intuitive dashboard features.
  • Users appreciate the simple setup of TelemetryDeck, finding it user-friendly for their hobby projects and monitoring needs.
  • Users love the simple setup of TelemetryDeck, finding it user-friendly and effective for their projects.
  • Users love the insightful and customizable dashboards of TelemetryDeck, enhancing their app monitoring experience effortlessly.
  • Users find TelemetryDeck's affordable pricing essential, especially for indie developers seeking privacy-focused solutions.
Cons
  • Users find the complexity of the TQL language challenging, making dashboard queries less intuitive and more time-consuming.
  • Users find TelemetryDeck lacking features that require a technical background, limiting accessibility and alert capabilities.
  • Users note the limited features of TelemetryDeck, though improvements are being made as new updates are introduced.
  • Users find the steep learning curve of TelemetryDeck challenging, requiring significant time to master its features.
  • Users often face debugging difficulties with new events, wishing for clearer signal timing in "Recent Signals".

What Are Recent G2 Reviews of TelemetryDeck?

Mouseflow

Mouseflow: Affordable Behavioral Analytics for UX Friction & CRO Mouseflow is the intuitive and affordable behavioral analytics platform that cuts the fluff to reveal the truth behind user behavior. We empower businesses with data-driven behavioral analytics, helping brands like eCommerce, SaaS, and enterprise brands understand why visitors are struggling, turning complex data into actionable insights that drive revenue and growth. Since essential tools like heatmaps and friction detection come out-of-the-box, you don't need an engineering degree to get quick value. How Mouseflow Helps You Optimize Faster: We’re here to toughen up your website – and your bottom line. • Automated UX Friction Detection Detect and fix conversion killers automatically with +7 friction events and our Friction Score—focus on changes that truly matter. • Affordable User Journey Mapping Analyze effortlessly how users move from, to, and between any page. Stop struggling to track user paths; we help you give them a shortcut to checkout. • Session Replays that Listen Watch user journeys unfold with session replays to see the truth behind clicks and turn data into powerful solutions. • Heatmaps Built for Scale Get 7 types of heatmaps, generated automatically for every page. This visibility is provided right out-of-the-box. • Conversion Funnels, Forms, & Analytics Pinpoint exact drop-off points using funnels and form analytics to increase conversions. • Real-Time Feedback Campaigns Understand visitor intent by asking the right questions at the right time. • Advanced Filtering, Segmentation, and Customization Advanced filtering and segmentation is available in every plan, supporting your experimentation roadmaps with the precision you need. Mouseflow is trusted by 210,000+ teams to analyze millions of visitor sessions, unlocking the fastest path to growth. We believe in making analytics approachable and fun, packed with “aha” moments. Are you ready to reveal the truth behind your user experience?

Average Rating: 4.6/5.0

Total Reviews: 688

How Do G2 Users Rate Mouseflow?

  • User Scoring: 7.7/10 (Category avg: 8.1/10)
  • Integrations: 7.3/10 (Category avg: 8.2/10)
  • Multi-Product Analytics: 7.3/10 (Category avg: 8.2/10)
  • Has the product been a good partner in doing business?: 8.9/10 (Category avg: 9.1/10)

Who Is the Company Behind Mouseflow?

  • Seller: Mouseflow
  • Company Website:
  • Year Founded: 2010
  • HQ Location: Copenhagen, Denmark
  • Twitter: @mouseflow
    1,736 Twitter followers
  • LinkedIn® Page: www.linkedin.com
    57 employees on LinkedIn®

Who Uses This Product?

  • Who Uses This: CEO, Owner
  • Top Industries: Marketing and Advertising, Computer Software
  • Company Size: 68% Small, 23% Medium

What Do G2 Reviewers Say About Mouseflow?

AI-generated summary from verified user reviews

Pros
  • Users find Mouseflow's ease of use invaluable for gaining quick insights and enhancing marketing strategies.
  • Users value the clear insights from heatmaps and session replays, enhancing engagement and improving marketing strategies.
  • Users love the insightful heatmaps that enhance understanding of user behavior, helping improve site engagement and conversions.
  • Users praise Mouseflow for its session replay feature, allowing comprehensive tracking of customer journeys and user behavior.
  • Users find the easy setup of Mouseflow enables efficient tracking and enhances data collection for optimizing their websites.
Cons
  • Users find the missing features in Mouseflow hinder its usability, especially with outdated plugins and limited options.
  • Users note the outdated plugin and improvements needed in heat maps and survey language options.
  • Users find Mouseflow to be expensive, particularly for small businesses with tight budgets and limited usage.
  • Users experience data inaccuracies with Mouseflow, as loading times are slow and interactions often misrepresent actual behavior.
  • Users report filtering issues in Mouseflow, making it challenging to locate relevant session recordings efficiently.

What Are Recent G2 Reviews of Mouseflow?

What Are G2 Users Discussing About Mouseflow?

Planhat

Planhat is an agentic customer platform, built to give humans and AI agents the full context they need to drive exceptional customer outcomes. Commercial teams at B2B enterprises use Planhat to automate workflows across the entire customer lifecycle, from onboarding and expansion to renewals and scaled customer success, turning better outcomes into revenue growth and enduring profitability. The platform spans three solutions; a category-leading Customer Success Platform (CSP), a comprehensive CRM system, and most recently, an AI-native Professional Services Automation (PSA) offering. The PSA brings resource management, project delivery, and services revenue into the same unified data model that has powered Planhat's category leading CSP for over a decade, helping teams drive adoption, reduce churn, and identify expansion opportunities through Customer 360 profiles, health scoring, and customer analytics. Core capabilities include AI workflows, conversational AI, and customer portals, all based on high-fidelity time-series data. Planhat serves organizations across software, IT and telecoms, healthcare & life sciences, financial services, and security.

Average Rating: 4.5/5.0

Total Reviews: 945

How Do G2 Users Rate Planhat?

  • User Scoring: 8.3/10 (Category avg: 8.1/10)
  • Integrations: 8.5/10 (Category avg: 8.2/10)
  • Multi-Product Analytics: 8.3/10 (Category avg: 8.2/10)
  • Has the product been a good partner in doing business?: 9.3/10 (Category avg: 9.1/10)

Who Is the Company Behind Planhat?

  • Seller: Planhat
  • Company Website:
  • Year Founded: 2015
  • HQ Location: Stockholm, Stockholm County
  • Twitter: @planhat
    1,045 Twitter followers
  • LinkedIn® Page: www.linkedin.com
    248 employees on LinkedIn®

Who Uses This Product?

  • Who Uses This: Customer Success Manager, Head of Customer Success
  • Top Industries: Computer Software, Information Technology and Services
  • Company Size: 60% Medium, 31% Small

What Do G2 Reviewers Say About Planhat?

AI-generated summary from verified user reviews

Pros
  • Users find the ease of use of Planhat exceptional, facilitating smooth integration and team adoption.
  • Users commend the exceptional customer support from Planhat, enhancing their experience and ensuring effective collaboration.
  • Users value the extensive customization options in Planhat, enhancing their experience and streamlining workflows effectively.
  • Users love the automation capabilities of Planhat, as it significantly saves time and enhances team productivity.
  • Users value the efficiency of Planhat for automating workflows and enhancing visibility into customer health.
Cons
  • Users find the learning curve steep, struggling to navigate features and setup pages during initial use of Planhat.
  • Users find the complexity of Planhat daunting, with a challenging learning curve that hinders initial usability.
  • Users face integration issues with Planhat, causing challenges in data management and trustworthiness among teams.
  • Users note a steep learning curve with Planhat, though support accelerates the process and enhances understanding.
  • Users find the formula fields restrictive, desiring greater flexibility and automation for easier customization and efficiency.

What Are Recent G2 Reviews of Planhat?

What Are G2 Users Discussing About Planhat?

Zipy

Zipy is a trusted digital experience platform which combines session replay, frontend error monitoring, product analytics and prioritisation into one while ensuring privacy and security. What can you do with Zipy? > Understand user behaviour to avoid churn > Monitor live users and real time errors to get actionable insights > Reduce time to resolve JS and API errors with inbuilt dev tools > Collaborate with your team members on customer experience problems > Get customer journey video replay, network logs, console logs, and stack traces all in one place Who can use Zipy? Zipy is most useful for Product teams, Business Analysts, Customer Success, Customer Support and Developers who have to solve customer problems. What will you achieve with Zipy? > Bring down TTR by 50% and save your support and development team’s debugging time > Reduce customer churn by proactively fixing their problems > Build a better product and GTM strategy based on user behaviour understanding by product and analyst teams

Average Rating: 4.9/5.0

Total Reviews: 52

How Do G2 Users Rate Zipy?

  • User Scoring: 10.0/10 (Category avg: 8.1/10)
  • Integrations: 10.0/10 (Category avg: 8.2/10)
  • Multi-Product Analytics: 9.7/10 (Category avg: 8.2/10)
  • Has the product been a good partner in doing business?: 9.9/10 (Category avg: 9.1/10)

Who Is the Company Behind Zipy?

  • Seller: Zipy
  • Year Founded: 2020
  • HQ Location: San Francisco, US
  • LinkedIn® Page: www.linkedin.com
    12 employees on LinkedIn®

Who Uses This Product?

  • Top Industries: Computer Software, Information Technology and Services
  • Company Size: 65% Small, 23% Medium

What Do G2 Reviewers Say About Zipy?

AI-generated summary from verified user reviews

Pros
  • Users benefit from session replay in Zipy, enabling faster debugging and enhancing overall user experience with detailed insights.
  • Users find Zipy remarkably easy to use, facilitating seamless tracking of product interactions and enhancing overall efficiency.
  • Users value the detailed analytics from Zipy, enhancing UI improvement efforts and overall user experience significantly.
  • Users value the efficient issue detection of Zipy, greatly enhancing their debugging and application performance monitoring capabilities.
  • Users love the amazing customer support and the ease of use, enhancing product adoption and experience.
Cons
  • Users note that slow loading times may cause missed sessions and sluggish performance, but overall functionality remains acceptable.
  • Users find that slow performance can occur, especially with large datasets, though it doesn’t hinder overall functionality.
  • Users report frequent bug issues with Zipy, including incorrect AI responses and missing session replay recordings.
  • Users face challenges with error handling, as Zipy struggles to ignore specific error types, impacting performance.
  • Users highlight the integration difficulty of Zipy with other tools, affecting their overall experience.

What Are Recent G2 Reviews of Zipy?

Flagsmith

Flagsmith is an open-source feature management platform that lets developers release with confidence. We work with security-conscious organisations across the world to help them securely transition to modern feature management and software development. Ship faster and control releases with feature flag management: Change the way your team releases software. Roll out, segment, and optimise—with granular control. Stay secure with on-premise and private cloud hosting.

Average Rating: 4.8/5.0

Total Reviews: 37

How Do G2 Users Rate Flagsmith?

  • Has the product been a good partner in doing business?: 9.4/10 (Category avg: 9.1/10)

Who Is the Company Behind Flagsmith?

  • Seller: Flagsmith
  • Year Founded: 2018
  • HQ Location: London, England
  • Twitter: @GetFlagsmith
    517 Twitter followers
  • LinkedIn® Page: www.linkedin.com
    28 employees on LinkedIn®

Who Uses This Product?

  • Top Industries: Computer Software, Information Technology and Services
  • Company Size: 62% Small, 27% Medium

What Do G2 Reviewers Say About Flagsmith?

AI-generated summary from verified user reviews

Pros
  • Users value the collaboration with Flagsmith, citing excellent support and a seamless integration experience.
  • Users highly value the excellent customer support from Flagsmith, praising responsiveness and genuine partnership throughout the process.
  • Users love the ease of use of Flagsmith, appreciating its simplicity and seamless integration for effective feature management.
  • Users highlight the easy integrations of Flagsmith, facilitating smooth deployments and aligning with modern development practices.
  • Users value the power and simplicity of Flagsmith, enabling seamless feature rollouts and excellent support.
Cons
  • Users desire more built-in analytics capabilities from Flagsmith to enhance their feature flag experience.
  • Users find the integration difficulty with JAM stack providers like Vercel to be a notable limitation.
  • Users note a lack of integration with JAM stack providers, which poses a challenge for seamless functionality.
  • Users desire more built-in analytics in Flagsmith to enhance their ability to experiment beyond just feature flags.
  • Users desire more built-in analytics and experimentation features to enhance the functionality of Flagsmith.

What Are Recent G2 Reviews of Flagsmith?

What Are G2 Users Discussing About Flagsmith?

UXCam

UXCam is a product analytics platform with integrated AI analyst, for mobile apps and websites. The company serves companies in 50+ countries and processes 100B+ data points every month. With UXCam, you can create funnels, retention charts, and dashboards to see what percentage of people are dropping off at each stage. Once you see a drop-off, you can zoom in and look at the recordings and heatmaps to understand why it happened. Book a free & quick demo on the UXCam website to learn more.

Average Rating: 4.6/5.0

Total Reviews: 209

How Do G2 Users Rate UXCam?

  • User Scoring: 7.2/10 (Category avg: 8.1/10)
  • Integrations: 7.7/10 (Category avg: 8.2/10)
  • Multi-Product Analytics: 7.8/10 (Category avg: 8.2/10)
  • Has the product been a good partner in doing business?: 9.2/10 (Category avg: 9.1/10)

Who Is the Company Behind UXCam?

  • Seller: UXCam
  • Year Founded: 2014
  • HQ Location: San Francisco, California
  • Twitter: @uxcam
    2,141 Twitter followers
  • LinkedIn® Page: www.linkedin.com
    78 employees on LinkedIn®

Who Uses This Product?

  • Who Uses This: CEO, Product Manager
  • Top Industries: Financial Services, Computer Software
  • Company Size: 56% Small, 29% Medium

What Do G2 Reviewers Say About UXCam?

AI-generated summary from verified user reviews

Pros
  • Users value the session replay feature of UXCam for insightful analysis and quick issue resolution.
  • Users praise the responsive customer support from UXCam, assisting in dashboard construction and issue resolution effectively.
  • Users find Error Tracking in UXCam invaluable for debugging and resolving issues through detailed session insights.
  • Users appreciate the easy user behavior tracking of UXCam, enabling quick access to valuable insights and optimizations.
  • Users value the insightful heatmaps from UXCam, making it easier to analyze user interactions and improve experiences.
Cons
  • Users find the dashboard overwhelming and not very user-friendly, requiring time to enhance their experience.
  • Users find the search difficulty due to limited dashboards and analytics options, complicating their user experience.
  • Users find the cluttered interface overwhelming, suggesting it could benefit from simplification to reduce information overload.
  • Users find the data overload on the dashboard overwhelming, suggesting a need for simplification upon first use.
  • Users find filtering issues and limited dashboard functionality hinder their ability to conduct thorough analytics.

What Are Recent G2 Reviews of UXCam?

What Are G2 Users Discussing About UXCam?

Glassbox

Glassbox is a customer intelligence and digital experience analytics platform designed to help enterprises understand, optimize, and enhance the customer experience and digital accessibility of their digital channels. One of the standout features of Glassbox is its capability to securely capture 100% of user sessions across both web and mobile applications. This end-to-end visibility allows teams to analyze every step of the customer journey, effectively pinpointing friction points and enabling real-time action. By utilizing advanced artificial intelligence, Glassbox captures and analyzes data from every online interaction, providing businesses with a comprehensive view of customer behavior and preferences. This wealth of data empowers organizations to act swiftly, transforming raw data into actionable insights that improve both the customer experience and the conversion rate. Large global enterprises in sectors such as finance, insurance, and healthcare, Glassbox serves as a vital tool for uncovering the root causes of customer challenges. It assists organizations in remediating customer experience issues and creating digital journeys that are inclusive, seamless, and engaging. The platform’s AI-powered insights not only enhance accessibility monitoring but also incorporate fraud prevention capabilities, giving organizations the agility to respond to issues within minutes and adapt to the evolving needs of their customers. Glassbox has been recognized by G2 as a leader in customer intelligence solutions and product analytics, reflecting its effectiveness in delivering the clarity and confidence that enterprises require. By providing a robust framework for creating compliant, accessible, and impactful digital experiences, Glassbox stands out in its category, offering unique selling points that cater to the diverse needs of its users. With its focus on data-driven decision-making and customer-centric strategies, Glassbox is positioned as a crucial ally for organizations aiming to thrive in the digital landscape.

Average Rating: 4.9/5.0

Total Reviews: 788

How Do G2 Users Rate Glassbox?

  • User Scoring: 9.9/10 (Category avg: 8.1/10)
  • Integrations: 10.0/10 (Category avg: 8.2/10)
  • Multi-Product Analytics: 10.0/10 (Category avg: 8.2/10)
  • Has the product been a good partner in doing business?: 9.9/10 (Category avg: 9.1/10)

Who Is the Company Behind Glassbox?

  • Seller: Glassbox
  • Company Website:
  • Year Founded: 2010
  • HQ Location: London
  • Twitter: @GlassboxDigital
    1,803 Twitter followers
  • LinkedIn® Page: www.linkedin.com
    279 employees on LinkedIn®

Who Uses This Product?

  • Who Uses This: Digital Analyst, Product Owner
  • Top Industries: Financial Services, Insurance
  • Company Size: 77% Large, 18% Medium

What Do G2 Reviewers Say About Glassbox?

AI-generated summary from verified user reviews

Pros
  • Users value the ease of use in Glassbox for efficiently accessing and analyzing recorded sessions.
  • Users value the ease of accessing session replays, enhancing operations and providing insights into user experiences.
  • Users benefit from immediate insights with Glassbox, enabling timely actions and identifying revenue opportunities efficiently.
  • Users value the recorded sessions and heat maps for enhancing user experience and optimizing feature placement effectively.
  • Users value the deep insights into customer journeys that Glassbox provides, enhancing website optimization and user experience.
Cons
  • Users face session issues, including split links, limited history, and slow query response times affecting overall usability.
  • Users find the navigation icons not intuitive, making it difficult to understand their functions within Glassbox.
  • Users find the session management cumbersome, as it can be overwhelming and lacks adequate capture reliability.
  • Users find the learning curve challenging, noting the need for improved training and easier access to documentation.
  • Users feel the lack of missing features, such as advanced reporting options and data query capabilities in Glassbox.

What Are Recent G2 Reviews of Glassbox?

What Are G2 Users Discussing About Glassbox?

Gainsight Product Experience

Gainsight Product Experience (PX) is an all-in-one platform where product, CS, and revenue teams can understand how users engage with their product, guide them to value, and collect feedback in one connected workspace. Today's SaaS businesses win by orchestrating precise, data-driven experiences. Gainsight PX empowers teams to see exactly where users succeed or struggle through deep usage analytics, funnel analysis, and user-level insights so every decision is backed by data, not guesswork. Gainsight PX enhances both the user and admin experience through native integrations with Gainsight Customer Success, Gainsight Customer Communities, Skilljar by Gainsight, and your broader tech stack, connecting in-app behavior directly to health scores, playbooks, and renewal workflows. With AI supporting hyper-personalized in-app engagements, path analysis, segmentation, and feedback loops, Gainsight PX turns every user action into a business advantage, reducing engineering dependency and accelerating time to value. By bridging the gap between product analytics and customer outcomes, Gainsight PX drives stronger adoption, lower cost-to-serve, and the retention and expansion growth that keeps businesses ahead.

Average Rating: 4.4/5.0

Total Reviews: 239

How Do G2 Users Rate Gainsight Product Experience?

  • User Scoring: 7.2/10 (Category avg: 8.1/10)
  • Integrations: 7.2/10 (Category avg: 8.2/10)
  • Multi-Product Analytics: 7.4/10 (Category avg: 8.2/10)
  • Has the product been a good partner in doing business?: 8.9/10 (Category avg: 9.1/10)

Who Is the Company Behind Gainsight Product Experience?

  • Seller: Gainsight Inc.
  • Year Founded: 2009
  • HQ Location: San Francisco, CA
  • Twitter: @GainsightHQ
    13,119 Twitter followers
  • LinkedIn® Page: www.linkedin.com
    1,144 employees on LinkedIn®

Who Uses This Product?

  • Who Uses This: Customer Success Manager, Product Manager
  • Top Industries: Computer Software, Information Technology and Services
  • Company Size: 61% Medium, 21% Small

What Do G2 Reviewers Say About Gainsight Product Experience?

AI-generated summary from verified user reviews

Pros
  • Users find Gainsight Product Experience to provide ease of use, streamlining customer engagement and tracking success effortlessly.
  • Users value the high-quality customer engagement features of Gainsight, enhancing their understanding and support for clients.
  • Users value the automation and organization Gainsight provides, enhancing their ability to personalize customer experiences efficiently.
  • Users value the real-time reporting and dashboards of Gainsight, enhancing client engagement and retention efforts effectively.
  • Users value the real-time analytics in Gainsight, enhancing customer retention and informed decision-making.
Cons
  • Users face a steep learning curve with Gainsight, complicating the utilization of its extensive features and functionalities.
  • Users find the learning difficulty with Gainsight Product Experience to be a challenge due to its complexity and intricacies.
  • Users note a steep learning curve with Gainsight Product Experience, making full utilization challenging and time-consuming.
  • Users find missing features in Gainsight Product Experience hinder effective engagement and reporting functionalities.
  • Users find the missing functionality in Gainsight Product Experience limits engagement effectiveness and complicates custom workflows.

What Are Recent G2 Reviews of Gainsight Product Experience?

What Are G2 Users Discussing About Gainsight Product Experience?

Usermaven

Usermaven is an AI-powered marketing attribution and product analytics platform for B2B SaaS companies and agencies. It connects every marketing touchpoint to revenue using multi-touch attribution, unified website and product analytics, and CRM data, helping teams see which campaigns, channels, and ads actually drive conversions.

Average Rating: 4.8/5.0

Total Reviews: 95

How Do G2 Users Rate Usermaven?

  • User Scoring: 9.6/10 (Category avg: 8.1/10)
  • Integrations: 8.3/10 (Category avg: 8.2/10)
  • Multi-Product Analytics: 9.8/10 (Category avg: 8.2/10)
  • Has the product been a good partner in doing business?: 9.5/10 (Category avg: 9.1/10)

Who Is the Company Behind Usermaven?

  • Seller: Usermaven Inc.
  • Year Founded: 2021
  • HQ Location: Delaware, DE
  • Twitter: @usermaven
    337 Twitter followers
  • LinkedIn® Page: www.linkedin.com
    12 employees on LinkedIn®

Who Uses This Product?

  • Who Uses This: Founder, Owner
  • Top Industries: Marketing and Advertising, Computer Software
  • Company Size: 97% Small, 3% Medium

What Do G2 Reviewers Say About Usermaven?

AI-generated summary from verified user reviews

Pros
  • Users value the ease of use of Usermaven, appreciating its simple setup and intuitive data presentation.
  • Users find the easy setup of Usermaven effortless, enhancing their analytics experience without developer involvement.
  • Users value the actionable insights provided by Usermaven, enabling data-driven decisions that fuel business growth rapidly.
  • Users praise Usermaven's intuitive interface, allowing easy navigation and efficient data tracking without technical expertise.
  • Users commend the effortless setup of Usermaven, enabling easy tracking without the need for technical expertise.
Cons
  • Users find the learning curve steep, wishing for better documentation and tutorials to maximize Usermaven's benefits.
  • Users miss the lack of real-time monitoring for website visitors, feeling it diminishes functionality compared to previous versions.
  • Users face difficult customization with Usermaven, wishing for easier branding options for panels and graphs.
  • Users face email integration issues with Usermaven, which may affect the overall functionality and experience.
  • Users experience ineffective error handling for bot traffic spikes, which occasionally disrupts their analysis experience.

What Are Recent G2 Reviews of Usermaven?

cux.io

UX is a Digital Experience Analytics platform that turns user behavior into digital growth. We don’t just show you what users do – we show you why they do it. CUX combines numbers with behavioral context to reveal frustration points, drop-offs, and hidden opportunities so you can act with confidence. No tagging. No waiting. Smarter decisions from day one. ✅ Auto-captures clicks, scrolls, and behaviors - no tagging needed ✅ Experience Metrics spot frustration signals like rage clicks and chaotic movement ✅ Smart filtering highlights the visits and heatmaps that matter most ✅ Conversion Waterfalls reveal where users drop off - and why ✅ Retroactive analysis lets you look back and fix what was missed Getting insights is just the start. What truly sets CUX apart is the guidance that comes with it. You’re never left to figure it out alone. With expert mentoring, tailored workshops, and ongoing support, the CUX team helps you make changes that stick. Whether you're solving a specific challenge or scaling a long-term strategy, we're here to guide your next move with confidence. Already used in 100+ countries, CUX helps teams turn confusion into direction and decisions into results. Have questions or need guidance? Contact our experts.

Average Rating: 4.8/5.0

Total Reviews: 45

How Do G2 Users Rate cux.io?

  • User Scoring: 9.7/10 (Category avg: 8.1/10)
  • Integrations: 9.0/10 (Category avg: 8.2/10)
  • Multi-Product Analytics: 9.0/10 (Category avg: 8.2/10)
  • Has the product been a good partner in doing business?: 9.4/10 (Category avg: 9.1/10)

Who Is the Company Behind cux.io?

  • Seller: cux.io
  • Year Founded: 2018
  • HQ Location: Wroc≈Çaw, Poland
  • Twitter: @cux_io
    77 Twitter followers
  • LinkedIn® Page: www.linkedin.com
    12 employees on LinkedIn®

Who Uses This Product?

  • Top Industries: Computer Software, Marketing and Advertising
  • Company Size: 71% Small, 29% Medium

What Are Recent G2 Reviews of cux.io?

What Are G2 Users Discussing About cux.io?

Appier AIRIS (formerly Woopra)

Woopra is a Customer Journey Analytics solution that is redefining how companies understand, analyze, engage and retain their customers. The platform is designed to fuel optimization and growth throughout the entire customer lifecycle. Leveraging individual-level data to aggregate analytics reports for full lifecycle insights that bridge departmental gaps. Woopra’s proprietary tracking technology tracks usage across your website, product and mobile applications. In addition, the platform offers 51+ one-click integrations with partners such as Salesforce, Marketo, Intercom and Segment to seamlessly unify disparate data points across tools and teams. As data flows into Woopra, People Profiles reveal a full behavioral history for each user, from their first touch to conversion and beyond. Making every engagement an opportunity to create more personalized experiences and support. Advanced analytics features include non-linear Customer Journeys, Trends and Retention reports powered by consolidated data. Translating numbers into people and opening entirely new views of the who, the what and the how in your data. Finally, Woopra's Triggers empower teams to take real-time action on their data. Automatically personalize page content, trigger a chat message, enrolls segments drip campaigns, update a lead status or customize a promotion with zero latency. Combined with powerful behavioral and demographic data, companies are able to deliver personalized experiences through the right channel, at the right time. With more than 200,000 users and 1,000 innovative customers across the world, Woopra provides the first unified analytics solution that is used by SaaS, eCommerce and On-Demand services for understanding, engaging and connecting with customers through data.

Average Rating: 4.4/5.0

Total Reviews: 197

How Do G2 Users Rate Appier AIRIS (formerly Woopra)?

  • User Scoring: 8.5/10 (Category avg: 8.1/10)
  • Integrations: 8.3/10 (Category avg: 8.2/10)
  • Multi-Product Analytics: 8.2/10 (Category avg: 8.2/10)
  • Has the product been a good partner in doing business?: 8.8/10 (Category avg: 9.1/10)

Who Is the Company Behind Appier AIRIS (formerly Woopra)?

  • Seller: Appier
  • Year Founded: 2012
  • HQ Location: Taipei, Taiwan
  • Twitter: @GoAppier
    1,230 Twitter followers
  • LinkedIn® Page: www.linkedin.com
    862 employees on LinkedIn®
  • Ownership: TYO: 4180

Who Uses This Product?

  • Top Industries: Information Technology and Services, Computer Software
  • Company Size: 53% Small, 34% Medium

What Do G2 Reviewers Say About Appier AIRIS (formerly Woopra)?

AI-generated summary from verified user reviews

Pros
  • Users value the real-time insights generated by Appier AIRIS, enhancing their decision-making with quick access to customer data.
  • Users value the real-time analytics of Appier AIRIS, enhancing their ability to respond swiftly to customer behavior changes.
  • Users value the flexible reporting capabilities of Appier AIRIS, essential for tailored insights and effective decision-making.
  • Users value the deep customer understanding provided by Appier AIRIS, enhancing insights for better business decisions.
  • Users appreciate the comprehensive data collection and analysis capabilities of Appier AIRIS, enhancing business insights significantly.
Cons
  • Users find the complexity of built-in formulas and onboarding in AIRIS can hinder their overall experience.
  • Users experience difficult customization options, which limit their ability to tailor reports and dashboards effectively.
  • Users find the difficult learning curve of Appier AIRIS challenging due to its many features and analytics complexity.
  • Users express concern about the limited features of Appier AIRIS, particularly the restriction on data and report types.
  • Users face integration issues with certain third-party tools, causing potential data discrepancies during setup.

What Are Recent G2 Reviews of Appier AIRIS (formerly Woopra)?

What Are G2 Users Discussing About Appier AIRIS (formerly Woopra)?

Kissmetrics

Get, keep and grow more customers with Customer Engagement Automation by Kissmetrics. Behavioral analytics, segmentation and email campaign automation all in one place. Deeply understand and uniquely engage each customer from prospect to advocate. Built to help marketers and product teams increase conversions, engagement and retention.

Average Rating: 4.1/5.0

Total Reviews: 164

How Do G2 Users Rate Kissmetrics?

  • User Scoring: 8.0/10 (Category avg: 8.1/10)
  • Integrations: 7.6/10 (Category avg: 8.2/10)
  • Multi-Product Analytics: 9.2/10 (Category avg: 8.2/10)
  • Has the product been a good partner in doing business?: 8.4/10 (Category avg: 9.1/10)

Who Is the Company Behind Kissmetrics?

  • Seller: Kissmetrics
  • Year Founded: 2008
  • HQ Location: San Francisco, CA
  • Twitter: @Kissmetrics
    203,840 Twitter followers
  • LinkedIn® Page: www.linkedin.com
    40 employees on LinkedIn®

Who Uses This Product?

  • Top Industries: Computer Software, Internet
  • Company Size: 54% Small, 34% Medium

What Are Recent G2 Reviews of Kissmetrics?

What Are G2 Users Discussing About Kissmetrics?