Top Free Digital Analytics Software - Page 2

How Many Digital Analytics Software Products Does G2 Track?

Total Products under this Category: 319

Category Stats (Sep 2026)

  • Average Rating: 4.44/5 The average rating of products in this category, based on all submitted ratings
  • Top Trending Product: Fathom Analytics (+2.2%) - Among all products in this category, Fathom Analytics recorded the largest rating increase compared to last month

Last updated: September 01, 2026

How Does G2 Rank Digital Analytics Software Products?

Why You Can Trust G2's Software Rankings:

  • 30 Analysts and Data Experts
  • 41,000+ Authentic Reviews
  • 319+ Products
  • Unbiased Rankings

G2's software rankings are built on verified user reviews, rigorous moderation, and a consistent research methodology maintained by a team of analysts and data experts. Each product is measured using the same transparent criteria, with no paid placement or vendor influence. While reviews reflect real user experiences, which can be subjective, they offer valuable insight into how software performs in the hands of professionals. Together, these inputs power the G2 Score, a standardized way to compare tools within every category.

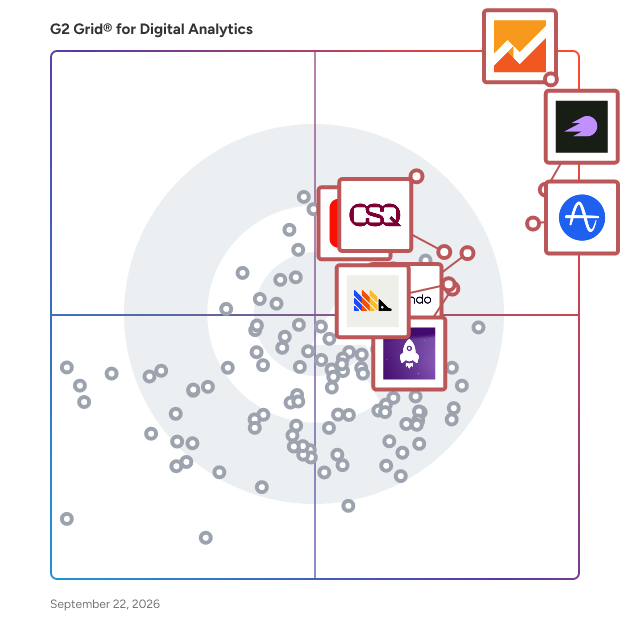
G2 Grid® for Digital Analytics Software

G2 Grid® for Digital Analytics Software plotting products by satisfaction and market presence

Highlighted products: Google Analytics, Semrush, Amplitude Analytics, Adobe Analytics, Pendo, Contentsquare, LogRocket, and PostHog.

Underlying data: [Grid® JSON](https://www.g2.com/categories/digital-analytics/grids.json?focus%5B%5D=google-analytics&focus%5B%5D=semrush&focus%5B%5D=amplitude-analytics&focus%5B%5D=adobe-analytics&focus%5B%5D=pendo-io-pendo&focus%5B%5D=contentsquare&focus%5B%5D=logrocket&focus%5B%5D=posthog)

Silktide

Silktide is an all-in-one platform for analyzing and improving websites. It combines tools for accessibility, content quality, marketing performance, legal compliance, and user behavior—making it easier for organizations to understand and enhance their entire web presence from one place. Silktide automatically scans your website and highlights issues across a wide range of areas: from broken links and slow-loading pages to inaccessible design elements, outdated content, and poor SEO. It also checks for GDPR compliance, cookie notices, and mobile responsiveness—giving teams a complete picture of what needs fixing, and how to fix it. Used by governments, universities, enterprises, and more, Silktide makes complex web standards easier to manage. Everyone from developers to marketers can see what matters to them via intuitive dashboards, role-specific recommendations, and scheduled reporting. Key features include: * Accessibility testing based on WCAG standards, with visual guides and easy-to-follow fixes * Content optimization covering spelling, grammar, readability, and link quality * SEO and marketing audits for metadata, discoverability, and keyword usage * Heatmaps and analytics to track how users interact with your pages—from clicks to scroll depth (requires installing a tracking script) * Performance insights around speed, mobile usability, and UX quality * Legal and compliance checks, including cookie notices and HTML validity Silktide also offers tools for workflow management, task assignment, and trend tracking, so teams can collaborate and demonstrate improvement over time. Most of the platform runs directly in the browser—setup is minimal, with just a small code snippet to be added to your site if you use our analytics and heatmaps functionality. Whether you run one website or manage hundreds, Silktide helps you understand what’s working, what isn’t, and how to make it better.

Average Rating: 4.8/5.0

Total Reviews: 288

How Do G2 Users Rate Silktide?

  • Sessions - Digital Analytics: 8.7/10 (Category avg: 8.8/10)
  • Engagement: 8.6/10 (Category avg: 8.7/10)
  • Trending: 8.4/10 (Category avg: 8.4/10)
  • Has the product been a good partner in doing business?: 9.6/10 (Category avg: 9.0/10)

Who Is the Company Behind Silktide?

  • Seller: Silktide
  • Company Website:
  • Year Founded: 2001
  • HQ Location: United Kingdom
  • LinkedIn® Page: www.linkedin.com
    62 employees on LinkedIn®

Who Uses This Product?

  • Who Uses This: Web Developer
  • Top Industries: Government Administration, Higher Education
  • Company Size: 43% Large, 35% Medium

What Do G2 Reviewers Say About Silktide?

AI-generated summary from verified user reviews

Pros
  • Users find the easy-to-use interface of Silktide enhances their overall experience and streamlines their workflow.
  • Users appreciate the exceptional support from the Silktide team, which greatly enhances their accessibility and website management experience.
  • Users praise the exceptional customer support from Silktide, specifically highlighting the effectiveness and responsiveness of their team.
  • Users value the ease of use and comprehensive accessibility tools provided by Silktide, significantly improving website compliance.
  • Users value the comprehensive accessibility features of Silktide, significantly enhancing website standards and user-friendliness.
Cons
  • Users express that complex usability may hinder quick mastery of Silktide, requiring additional time and effort to navigate.
  • Users find the absence of key features in Silktide frustrating, limiting efficiency and customization options.
  • Users struggle with difficult navigation, finding sections complex and workflows unclear, impacting overall user experience.
  • Users experience lack of clarity in communication and options, making the tool less efficient and user-friendly.
  • Users express frustration over limited features in Silktide, wishing for more flexibility and options tailored to their needs.

What Are Recent G2 Reviews of Silktide?

What Are G2 Users Discussing About Silktide?

Croct

Croct is a conversion optimization platform that includes a user profile explorer, audience segmentation, content personalization, AB testing, feature flag, real-time website analytics, and a component-based CMS for modern frameworks like Next.js and React. It helps product and growth teams scale UI and website optimization, enabling faster growth without over-relying on developers.

Average Rating: 4.7/5.0

Total Reviews: 48

How Do G2 Users Rate Croct?

  • Has the product been a good partner in doing business?: 9.6/10 (Category avg: 9.0/10)

Who Is the Company Behind Croct?

  • Seller: Croct
  • Year Founded: 2020
  • HQ Location: Denver, Colorado, US
  • Twitter: @croct_tech
    133 Twitter followers
  • LinkedIn® Page: www.linkedin.com
    14 employees on LinkedIn®

Who Uses This Product?

  • Top Industries: Financial Services, Marketing and Advertising
  • Company Size: 56% Medium, 29% Large

What Do G2 Reviewers Say About Croct?

AI-generated summary from verified user reviews

Pros
  • Users rave about Croct's incredible customer support, which greatly enhances their experience and optimizes platform usage.
  • Users appreciate the personalization features of Croct, which enhance the user experience and boost conversion rates.
  • Users value the impressive ease of use of Croct, enabling rapid project launches and streamlined audience analysis.
  • Users appreciate the intuitive layout of Croct, making A/B testing easy for various marketing teams.
  • Users praise Croct for its impressive implementation ease, achieving quick project launches and seamless integration.
Cons
  • Users note a steep learning curve for advanced features, though support helps mitigate initial challenges.
  • Users find complexity in working with Slots and components, which can make initial setup and configuration challenging.
  • Some users struggle with the difficult setup process, requiring extra time and technical knowledge to configure properly.
  • Users find the complex features of Croct confusing, particularly with slots and iframe configurations.
  • Users find Croct to have significant limitations in functionality and require developer support for basic tasks.

What Are Recent G2 Reviews of Croct?

Detrics

Detrics is an intuitive and the easiest to use data connector that eliminates the tedious work of reporting by eliminating all manual tasks in the process. By integrating seamlessly with major platforms including Google Ads, Facebook (Meta) Ads, Google Analytics 4, LinkedIn Ads, TikTok Ads, and many others, Detrics automates your data workflow extraction tasks. Detrics imports live data directly into your preferred data visualizations tools like Google Sheets and Looker Studio for users to build comprehensive dashboards. This streamlined approach dramatically reduces time spent on repetitive tasks, eliminates manual errors, and saves significant costs compared to expensive enterprise alternatives - all while offering a robust forever-free plan. Key standout features include automated reports that run on custom schedules, real-time data syncing through scheduled queries, advanced data filtering capabilities, and reusable query templates for consistent reporting. Detrics is perfectly suited for marketers, freelancers, and agencies who demand efficiency without compromising on data quality or insights. If you're ready to start automating, saving time, and taking your data analytics, marketing & ecommerce reports to the next level, Detrics has got you covered!

Average Rating: 4.9/5.0

Total Reviews: 68

How Do G2 Users Rate Detrics?

  • Sessions - Digital Analytics: 9.6/10 (Category avg: 8.8/10)
  • Engagement: 9.6/10 (Category avg: 8.7/10)
  • Trending: 9.6/10 (Category avg: 8.4/10)
  • Has the product been a good partner in doing business?: 9.9/10 (Category avg: 9.0/10)

Who Is the Company Behind Detrics?

  • Seller: Detrics
  • Year Founded: 2022
  • HQ Location: Buenos Aires, AR
  • LinkedIn® Page: www.linkedin.com
    7 employees on LinkedIn®

Who Uses This Product?

  • Who Uses This: CEO
  • Top Industries: Marketing and Advertising, Information Technology and Services
  • Company Size: 67% Small, 25% Medium

What Do G2 Reviewers Say About Detrics?

AI-generated summary from verified user reviews

Pros
  • Users commend the revolutionary ease of use of Detrics, facilitating quick implementation and seamless integration with systems.
  • Users highlight the time-saving automation of Detrics, freeing up over 5 hours weekly with reliable real-time data.
  • Users commend the ease of integration with CRM systems, enhancing workflow and supporting efficient implementations.
  • Users value the easy integrations with existing systems, enhancing productivity and enabling smooth implementation and usage.
  • Users value the time-saving automation of Detrics, reporting over 5 hours saved weekly with reliable real-time data.
Cons
  • Users encounter integration issues with Detrics, requiring manual data imports for key sales channels and tools.
  • Users find the limited integrations frustrating, requiring manual imports for essential data from key platforms.
  • Users are frustrated by the lack of compatibility with CRM systems, requiring manual data imports for sales pipelines.
  • Users face integration difficulties with Detrics, requiring manual imports for essential sales data, complicating workflows.
  • Users desire more advanced customization options for dashboards in Detrics to enhance their analytical capabilities.

What Are Recent G2 Reviews of Detrics?

Dreamdata

Dreamdata is an Agentic B2B Attribution Platform for B2B marketing teams. Answer any question about marketing's impact and know where to invest next. 81% of a B2B customer journey happens before your sales team says hello. The decision on where the next marketing dollar goes still gets made on the 19% that reaches the CRM. Dreamdata gets rid of that black box. We unify all your GTM data into one account-based data model, including the anonymous visits and ad impressions your CRM never sees, organized by account and tied to revenue. Automatically without a village of Ops or professional services. See what's working across your entire customer journey. Ask Dreamdata AI about marketing's impact and get numbers that trace back to the contacts, companies, and deals behind the revenue. Then feed your ad platforms enriched pipeline data to make them more efficient, and target in-market accounts using intent signals from across your stack. Key offerings - Customer Journey & Multi-Touch Attribution: See every touch across your customer journeys and analyze the performance of every channel, campaign, and content piece. - Dreamdata AI: Ask in plain English and get reports from an AI that knows your GTM. In our Analytics Agent, your own LLM via our MCP Server, or run custom agents on your Data Warehouse. - Audience Targeting: Build ad audiences from AI signals across all your GTM data and sync them directly to LinkedIn, Google, Meta, and Microsoft Ads. - Conversion Syncs: Sync enriched pipeline data back to LinkedIn, Google, Meta, and Microsoft Ads to automatically optimize campaigns for revenue, not clicks. Try Dreamdata with your own data before you commit.

Average Rating: 4.7/5.0

Total Reviews: 270

How Do G2 Users Rate Dreamdata?

  • Sessions - Digital Analytics: 9.1/10 (Category avg: 8.8/10)
  • Engagement: 9.0/10 (Category avg: 8.7/10)
  • Trending: 8.5/10 (Category avg: 8.4/10)
  • Has the product been a good partner in doing business?: 9.6/10 (Category avg: 9.0/10)

Who Is the Company Behind Dreamdata?

  • Seller: dreamdata.io
  • Company Website:
  • Year Founded: 2018
  • HQ Location: Copenhagen, Capital Region
  • Twitter: @DreamdataIO
    291 Twitter followers
  • LinkedIn® Page: www.linkedin.com
    109 employees on LinkedIn®

Who Uses This Product?

  • Who Uses This: Head of Marketing, Marketing Manager
  • Top Industries: Computer Software, Information Technology and Services
  • Company Size: 60% Medium, 33% Small

What Do G2 Reviewers Say About Dreamdata?

AI-generated summary from verified user reviews

Pros
  • Users value the in-depth customer journey insights provided by Dreamdata, enhancing their marketing efforts significantly.
  • Users value the attribution accuracy of Dreamdata, effectively linking marketing efforts to revenue outcomes and customer journeys.
  • Users value the in-depth customer journey insights provided by Dreamdata, enhancing their understanding and performance optimization.
  • Users value the insights provided by Dreamdata, enhancing their understanding of customer journeys and improving performance.
  • Users value the ease of use of Dreamdata, praising its intuitive interface and seamless implementation features.
Cons
  • Users experience a steep learning curve with Dreamdata, finding setup and navigation quite challenging initially.
  • Users have noted the missing features in Dreamdata, particularly the lack of comprehensive comparison and funnel reporting options.
  • Users express frustration with inadequate reporting options in Dreamdata, highlighting a lack of customizability and essential features.
  • Users find the interface not intuitive and emphasize the steep learning curve for maximizing Dreamdata's capabilities.
  • Users express frustration with poor reporting capabilities, noting that manual setup hampers efficiency and usability.

What Are Recent G2 Reviews of Dreamdata?

What Are G2 Users Discussing About Dreamdata?

Smartlook

Smartlook is an analytics solution for websites, iOS/Android apps, and various app frameworks, that answers the "whys" behind your users' actions. Learn more about our features ↩️ Brands can easily understand how customers precisely interact with their website and app by: - Watching recordings of every user, and seeing exactly what they see, down to the same resolution. - Using automatically tracked events generated within the website/app, from tapping a button to typing text. - Building conversion funnels and finding out where most of their users are leaving the website/app (and seeing what they did before they left). - Creating heatmaps of visitors’ clicks, scrolls, and moves, to highlight popular elements. Smartlook cuts out all the guesswork and gathers brands’ app data together on one central dashboard, which enables sharing and collaborating with colleagues. This means clear, data-driven decision-making for product managers, marketers, UX designers, and developers to constantly improve each website and app by reducing churn rates, boosting conversions, identifying and fixing bugs, and improving UX.

Average Rating: 4.6/5.0

Total Reviews: 837

How Do G2 Users Rate Smartlook?

  • Sessions - Digital Analytics: 8.8/10 (Category avg: 8.8/10)
  • Engagement: 8.7/10 (Category avg: 8.7/10)
  • Trending: 8.5/10 (Category avg: 8.4/10)
  • Has the product been a good partner in doing business?: 9.0/10 (Category avg: 9.0/10)

Who Is the Company Behind Smartlook?

  • Seller: Cisco
  • Year Founded: 1984
  • HQ Location: San Jose, CA
  • Twitter: @Cisco
    720,366 Twitter followers
  • LinkedIn® Page: www.linkedin.com
    95,294 employees on LinkedIn®
  • Ownership: NASDAQ:CSCO

Who Uses This Product?

  • Who Uses This: CEO, Owner
  • Top Industries: Computer Software, Marketing and Advertising
  • Company Size: 85% Small, 12% Medium

What Do G2 Reviewers Say About Smartlook?

AI-generated summary from verified user reviews

Pros
  • Users find Smartlook to have a clean and intuitive interface, making navigation and usage straightforward and efficient.
  • Users value the clean interface and custom dashboards of Smartlook, enhancing their analytics and user behavior tracking.
  • Users praise the powerful analytics tools of Smartlook, especially for visualizing user behavior and optimizing decisions.
  • Users appreciate the useful free plan of Smartlook, ideal for trials and enhancing small projects.
  • Users appreciate the clean and attractive interface of Smartlook, making navigation and analytics seamless and intuitive.
Cons
  • Users find the interface to be cluttered, which sometimes distracts from the overall convenience and usability.
  • Users find the complex features challenging, especially with limited tracking and heat map creation difficulties.
  • Users report dashboard issues like an overloaded interface and occasional visual glitches affecting usability.
  • Users are disappointed by the limited 1-month data retention and the challenges in creating heat maps compared to alternatives.
  • Users are frustrated by the delays in heat map creation and the limited tracking period for free accounts.

What Are Recent G2 Reviews of Smartlook?

What Are G2 Users Discussing About Smartlook?

Adriel

Adriel is a comprehensive AdOps platform designed to assist marketers in managing their advertising operations through no-code reporting and creative intelligence solutions. This platform caters to the needs of brands and agencies seeking to enhance their advertising strategies by providing tools that facilitate real-time data visualization and customizable dashboards. By integrating various data sources, Adriel enables users to optimize their campaigns, maximize their budgets, and ultimately drive growth. Targeted primarily at marketing professionals and agencies, Adriel serves as a vital resource for those looking to streamline their advertising efforts. The platform is particularly beneficial for teams that require a user-friendly interface to generate insights without needing extensive technical expertise. With its no-code approach, users can easily create reports and dashboards tailored to their specific needs, making it an ideal solution for both small businesses and large enterprises. One of the standout features of Adriel is its AI-driven insights, which provide users with actionable data to inform their decision-making processes. This capability allows marketers to identify trends and opportunities within their campaigns, ensuring that they can respond swiftly to changing market conditions. Additionally, the platform offers customizable widgets that enable users to visualize their data in ways that are most relevant to their objectives, enhancing the overall analytical experience. Adriel also excels in its ability to seamlessly map and blend data from various sources, allowing for a comprehensive view of campaign performance. This feature is crucial for marketers who need to consolidate information from different platforms and channels to gain a holistic understanding of their advertising efforts. Furthermore, the proactive alerts system keeps users informed of significant changes or anomalies in their data, enabling them to take immediate action when necessary. In essence, Adriel stands out in the business intelligence and reporting landscape by offering a powerful yet accessible solution for marketers. With its focus on automation, scalability, and hands-on support, it provides a robust framework for businesses looking to enhance their reporting capabilities and drive successful advertising campaigns. By leveraging Adriel's advanced features, brands can ensure they remain competitive in an ever-evolving digital marketplace.

Average Rating: 4.5/5.0

Total Reviews: 42

How Do G2 Users Rate Adriel?

  • Sessions - Digital Analytics: 8.0/10 (Category avg: 8.8/10)
  • Engagement: 8.3/10 (Category avg: 8.7/10)
  • Trending: 8.1/10 (Category avg: 8.4/10)
  • Has the product been a good partner in doing business?: 9.5/10 (Category avg: 9.0/10)

Who Is the Company Behind Adriel?

  • Seller: Adriel
  • Company Website:
  • Year Founded: 2017
  • HQ Location: Austin, Texas
  • Twitter: @AdrielMarketing
    343 Twitter followers
  • LinkedIn® Page: www.linkedin.com
    57 employees on LinkedIn®

Who Uses This Product?

  • Top Industries: Marketing and Advertising
  • Company Size: 74% Small, 10% Medium

What Do G2 Reviewers Say About Adriel?

AI-generated summary from verified user reviews

Pros
  • Users highlight the ease of use with Adriel, appreciating its intuitive interface and seamless data integration.
  • Users value the easy reporting capabilities of Adriel, streamlining analytics and saving valuable time.
  • Users value the seamless data integration in Adriel, enhancing efficiency and simplifying analytics for better reporting.
  • Users appreciate the streamlined reporting and centralized data Adriel offers, enhancing efficiency and clarity in marketing insights.
  • Users commend the outstanding customer support of Adriel, highlighting its responsiveness and helpfulness in resolving issues.
Cons
  • Users report missing features in Adriel, noting a lack of certain metrics and cumbersome connection processes.
  • Users experience query issues with data accuracy and glitches in dashboard formatting, requiring manual checks at times.
  • Users find the complex setup of Adriel to be time-consuming and often frustrating due to connection issues.
  • Users find the difficult setup of Adriel frustrating, as connections and processes are not very straightforward.
  • Users experience frequent error reporting issues, leading to cumbersome manual checks and occasional data discrepancies.

What Are Recent G2 Reviews of Adriel?

What Are G2 Users Discussing About Adriel?

LeadLander

Convert website visits into actionable sales leads. Used across dozens of industries and four continents, LeadLander empowers sales and business development teams with the information they need to send targeted messages to pre-qualified leads. LeadLander provides a wealth of information about every visitor to your website. A traditional web analytics system only offers a generalized overview of the traffic visiting your site. LeadLander goes beyond traditional methods, providing specific details about each site visitor — the information most valuable to a sales person and marketing team. LeadLander is the perfect tool for sales people and marketers who want: New leads (even those who do not complete a registration form) Alerts when prospects return to their website Pipeline accuracy Validation of their cold calls and meetings Tie inbound lead flow to marketing campaigns Deliver dynamic website content based on visitor history

Average Rating: 4.2/5.0

Total Reviews: 63

How Do G2 Users Rate LeadLander?

  • Sessions - Digital Analytics: 8.4/10 (Category avg: 8.8/10)
  • Engagement: 8.5/10 (Category avg: 8.7/10)
  • Trending: 8.4/10 (Category avg: 8.4/10)
  • Has the product been a good partner in doing business?: 9.1/10 (Category avg: 9.0/10)

Who Is the Company Behind LeadLander?

  • Seller: LeadLander
  • Year Founded: 2006
  • HQ Location: Corta Madera, CA
  • Twitter: @LeadLander
    236 Twitter followers
  • LinkedIn® Page: www.linkedin.com
    4 employees on LinkedIn®

Who Uses This Product?

  • Top Industries: Computer Software, Marketing and Advertising
  • Company Size: 52% Medium, 41% Small

What Do G2 Reviewers Say About LeadLander?

AI-generated summary from verified user reviews

Pros
  • Users appreciate the daily reports and contact search feature in LeadLander, enhancing lead generation excitement and opportunities.
  • Users value the great customer service from LeadLander, enhancing their overall experience with instant support.
  • Users appreciate the daily reports and contact search feature, generating excitement about potential leads and collaborations.
  • Users appreciate the integrations of LeadLander, enhancing team collaboration through daily visitor reports and contact insights.
  • Users find LeadLander's intuitive interface invaluable for quickly accessing key prospecting information and lead details.
Cons
  • Users face challenges with HubSpot integration, making the setup process more complicated than expected.
  • Users find the limited search functionality of LeadLander frustrating, as it restricts contact searches by position.
  • Users find usability issues in LeadLander, especially concerning the limited contact search options by position.

What Are Recent G2 Reviews of LeadLander?

What Are G2 Users Discussing About LeadLander?

Supermetrics

Supermetrics helps marketers go AI-first - from insight to action. Founded in 2013 and headquartered in Helsinki, Finland, Supermetrics unifies the marketing workflow, connecting the full breadth of marketing and advertising data sources through to AI-powered analysis and activation, so businesses spend less time wrangling data and more time on strategic growth. Built for marketers, analysts, and BI professionals, Supermetrics serves organizations from small startups to large enterprises that rely on multiple data sources such as Google Analytics, Facebook Ads, HubSpot and Shopify - consolidating everything into the destination of their choice - spreadsheets, data warehouses, or AI assistants via native MCP support. Teams can connect and automate their marketing and advertising reporting without deep technical expertise, cutting the manual work and errors that come with pulling data by hand, and freeing up time for analysis and strategy instead of data collection. Supermetrics pairs a user-friendly interface with a library of templates and pre-built reports, making it fast to visualize data and get to an answer. The platform is trusted by 200,000+ organizations globally, including L’Oréal, BBC, and Heineken, across 120 countries. Supermetrics serves organizations of every size, from small and mid-sized businesses that need enterprise-grade reporting without enterprise overhead, to global brands such as Nestlé, Warner Bros, and Dyson, to agencies managing dozens of client accounts. The platform is SOC 2 Type II and ISO 27001 certified, GDPR and CCPA compliant, and backed by 24/5 global support. Its recognition as one of G2’s Top 50 Best EMEA Software Companies reflects an ongoing investment in innovation for data-driven marketing teams looking to move from manual reporting to AI-powered decisions.

Average Rating: 4.4/5.0

Total Reviews: 817

How Do G2 Users Rate Supermetrics?

  • Sessions - Digital Analytics: 8.6/10 (Category avg: 8.8/10)
  • Engagement: 8.3/10 (Category avg: 8.7/10)
  • Trending: 7.9/10 (Category avg: 8.4/10)
  • Has the product been a good partner in doing business?: 8.2/10 (Category avg: 9.0/10)

Who Is the Company Behind Supermetrics?

  • Seller: Supermetrics
  • Company Website:
  • Year Founded: 2013
  • HQ Location: Helsinki, Uusimaa
  • Twitter: @Supermetrics
    7,832 Twitter followers
  • LinkedIn® Page: www.linkedin.com
    427 employees on LinkedIn®

Who Uses This Product?

  • Who Uses This: Digital Marketing Manager, CEO
  • Top Industries: Marketing and Advertising, Retail
  • Company Size: 55% Small, 35% Medium

What Do G2 Reviewers Say About Supermetrics?

AI-generated summary from verified user reviews

Pros
  • Users find Supermetrics to be extremely easy to use, streamlining complex data into clear, accessible reports effortlessly.
  • Users value the extensive data source integrations in Supermetrics, streamlining their reporting and data management processes effectively.
  • Users praise the excellent customer support of Supermetrics, noting its quick, personal, and effective assistance.
  • Users value the easy integrations of Supermetrics, facilitating seamless connections and efficient reporting across platforms.
  • Users love the time-saving automation of Supermetrics, drastically increasing efficiency in reporting and data management.
Cons
  • Users find Supermetrics expensive and wish for more flexible subscription options to suit their needs better.
  • Users face missing features in Supermetrics, struggling with product feeds and filter functionalities in their workflow.
  • Users point out pricing issues, feeling the subscription doesn't reflect usage and lacks flexible options for connectors.
  • Users are frustrated by the data limitations of Supermetrics, particularly missing GA4 funnel events and incomplete KPI access.
  • Users find data limitations frustrating, including restricted KPIs and difficulties in connecting sources, affecting usability and costs.

What Are Recent G2 Reviews of Supermetrics?

What Are G2 Users Discussing About Supermetrics?

Chartbeat

Chartbeat, Inc. includes four product lines — Chartbeat, Tubular, Lineup, and FatTail — and combines analytics that power smarter audience strategies with revenue solutions that simplify ad operations and accelerate monetization. See how Chartbeat, Inc. is shaping the future of media strategy and revenue. https://lp.chartbeat.com/chartbeat-inc Chartbeat, the content intelligence platform for publishers, empowers media companies to build loyal audiences with real-time and historical editorial analytics across desktop, social, and mobile platforms. Chartbeat helps digital publishing organizations understand what, within their content, is keeping people engaged. Partnering with over 60,000 media brands across 70+ countries, Chartbeat’s real-time and historical dashboards, in-depth headline testing and in-page optimization tools, robust reporting, and more help the world’s leading media organizations understand, measure, and build business value from the attention earned by their written and video content.

Average Rating: 4.4/5.0

Total Reviews: 68

How Do G2 Users Rate Chartbeat?

  • Sessions - Digital Analytics: 9.1/10 (Category avg: 8.8/10)
  • Engagement: 9.1/10 (Category avg: 8.7/10)
  • Trending: 9.1/10 (Category avg: 8.4/10)
  • Has the product been a good partner in doing business?: 9.2/10 (Category avg: 9.0/10)

Who Is the Company Behind Chartbeat?

  • Seller: Chartbeat
  • Year Founded: 2009
  • HQ Location: New York, NY
  • Twitter: @Chartbeat
    24,171 Twitter followers
  • LinkedIn® Page: www.linkedin.com
    134 employees on LinkedIn®

Who Uses This Product?

  • Top Industries: Online Media, Broadcast Media
  • Company Size: 49% Medium, 26% Large

What Are Recent G2 Reviews of Chartbeat?

What Are G2 Users Discussing About Chartbeat?

Mode

Mode is the first BI platform to embrace the way modern data teams work, which enables data leaders to drive more efficient, higher impact analysis and increased data maturity through true self-service. As the unified intelligence layer, Mode maximizes modern data stack ROI and turns data into a competitive advantage for leading businesses across all sectors and stages.

Average Rating: 4.5/5.0

Total Reviews: 319

How Do G2 Users Rate Mode?

  • Sessions - Digital Analytics: 9.1/10 (Category avg: 8.8/10)
  • Engagement: 9.1/10 (Category avg: 8.7/10)
  • Trending: 8.7/10 (Category avg: 8.4/10)
  • Has the product been a good partner in doing business?: 9.1/10 (Category avg: 9.0/10)

Who Is the Company Behind Mode?

  • Seller: Mode Analytics, Inc.
  • Year Founded: 2013
  • HQ Location: San Francisco, California
  • Twitter: @ModeAnalytics
    6,658 Twitter followers
  • LinkedIn® Page: www.linkedin.com
    694 employees on LinkedIn®

Who Uses This Product?

  • Who Uses This: Data Scientist, Data Analyst
  • Top Industries: Information Technology and Services, Computer Software
  • Company Size: 47% Medium, 29% Large

What Do G2 Reviewers Say About Mode?

AI-generated summary from verified user reviews

Pros
  • Users appreciate the user-friendly interface and robust feature tracking, enhancing self-service exploration and data analysis.
  • Users highlight the customization options in Mode, enabling tailored experiences for both analysts and business users.
  • Users find the ease of implementation with Mode's SSO functionality enhances accessibility and efficiency across the organization.
  • Users appreciate the ease of use in Mode, benefiting from a clean UI and role-based features for all.
  • Users value the efficiency of Mode, benefiting from clear visibility and streamlined data analysis for all roles.
Cons
  • Users find the complex setup challenging for non-technical users, requiring significant admin support for authentication.
  • Users find complex usage a barrier, especially for less technical users needing significant admin support for onboarding.
  • Users find that on-boarding less technical users is challenging, as it requires substantial admin support for data integration.
  • Users find difficult learning curves for onboarding less technical users, requiring admin support for effective integration.
  • Users find initial difficulty in onboarding less technical users, requiring substantial support for effective integration.

What Are Recent G2 Reviews of Mode?

Fathom Analytics

Fathom Analytics is a fast, lightweight, privacy-first alternative to Google Analytics. We help you understand your website traffic without invading your visitors' privacy or drowning you in complexity. Our lightweight script won't slow down your site, and our simple dashboard gives you the important stuff in one place: visitors, pageviews, conversions, referrers, campaigns, and more. No training required, no data sampling, and no digging through endless reports to find what you need. Fathom is trusted on more than 1,000,000 websites, from independent creators and small businesses to large organisations. We're GDPR, CCPA, PECR, and ePrivacy compliant by design. Fathom doesn't use cookies or collect personal information about your visitors, which means you can get the analytics you need without invasive tracking or annoying cookie banners. If you want to understand what's happening on your website without the complexity of Google Analytics or compromising your visitors' privacy, Fathom keeps things simple.

Average Rating: 4.7/5.0

Total Reviews: 21

How Do G2 Users Rate Fathom Analytics?

  • Sessions - Digital Analytics: 9.8/10 (Category avg: 8.8/10)
  • Engagement: 10.0/10 (Category avg: 8.7/10)
  • Trending: 9.2/10 (Category avg: 8.4/10)
  • Has the product been a good partner in doing business?: 9.2/10 (Category avg: 9.0/10)

Who Is the Company Behind Fathom Analytics?

  • Seller: Fathom Analytics
  • Year Founded: 2019
  • HQ Location: Victoria, BC
  • Twitter: @usefathom
    14,394 Twitter followers
  • LinkedIn® Page: www.linkedin.com
    3 employees on LinkedIn®

Who Uses This Product?

  • Company Size: 71% Small, 14% Medium

What Do G2 Reviewers Say About Fathom Analytics?

AI-generated summary from verified user reviews

Pros
  • Users appreciate the ease of use of Fathom Analytics, enjoying a seamless setup and user-friendly dashboard for insights.
  • Users value the fast, user-friendly insights from Fathom Analytics, enhancing website performance while respecting privacy.
  • Users value the privacy-focused analytics that Fathom Analytics provides, making data tracking easy and respectful.
  • Users praise the amazing and superfast customer support of Fathom Analytics, ensuring timely solutions and assistance.
  • Users love the easy integrations of Fathom Analytics, simplifying data tracking and enhancing their website experience.
Cons
  • Users feel that inadequate analytics in Fathom Analytics limits insights and customization for better reporting and usability.
  • Users find that Fathom Analytics suffers from limited customization, lacking advanced filtering tools and a customizable dashboard.
  • Users mention pricing issues, yet appreciate paying for a clear and transparent service rather than being the product.

What Are Recent G2 Reviews of Fathom Analytics?

What Are G2 Users Discussing About Fathom Analytics?

Mouseflow

Mouseflow: Affordable Behavioral Analytics for UX Friction & CRO Mouseflow is the intuitive and affordable behavioral analytics platform that cuts the fluff to reveal the truth behind user behavior. We empower businesses with data-driven behavioral analytics, helping brands like eCommerce, SaaS, and enterprise brands understand why visitors are struggling, turning complex data into actionable insights that drive revenue and growth. Since essential tools like heatmaps and friction detection come out-of-the-box, you don't need an engineering degree to get quick value. How Mouseflow Helps You Optimize Faster: We’re here to toughen up your website – and your bottom line. • Automated UX Friction Detection Detect and fix conversion killers automatically with +7 friction events and our Friction Score—focus on changes that truly matter. • Affordable User Journey Mapping Analyze effortlessly how users move from, to, and between any page. Stop struggling to track user paths; we help you give them a shortcut to checkout. • Session Replays that Listen Watch user journeys unfold with session replays to see the truth behind clicks and turn data into powerful solutions. • Heatmaps Built for Scale Get 7 types of heatmaps, generated automatically for every page. This visibility is provided right out-of-the-box. • Conversion Funnels, Forms, & Analytics Pinpoint exact drop-off points using funnels and form analytics to increase conversions. • Real-Time Feedback Campaigns Understand visitor intent by asking the right questions at the right time. • Advanced Filtering, Segmentation, and Customization Advanced filtering and segmentation is available in every plan, supporting your experimentation roadmaps with the precision you need. Mouseflow is trusted by 210,000+ teams to analyze millions of visitor sessions, unlocking the fastest path to growth. We believe in making analytics approachable and fun, packed with “aha” moments. Are you ready to reveal the truth behind your user experience?

Average Rating: 4.6/5.0

Total Reviews: 689

How Do G2 Users Rate Mouseflow?

  • Sessions - Digital Analytics: 8.5/10 (Category avg: 8.8/10)
  • Engagement: 8.4/10 (Category avg: 8.7/10)
  • Trending: 7.7/10 (Category avg: 8.4/10)
  • Has the product been a good partner in doing business?: 8.9/10 (Category avg: 9.0/10)

Who Is the Company Behind Mouseflow?

  • Seller: Mouseflow
  • Company Website:
  • Year Founded: 2010
  • HQ Location: Copenhagen, Denmark
  • Twitter: @mouseflow
    1,736 Twitter followers
  • LinkedIn® Page: www.linkedin.com
    57 employees on LinkedIn®

Who Uses This Product?

  • Who Uses This: CEO, Owner
  • Top Industries: Marketing and Advertising, Computer Software
  • Company Size: 68% Small, 23% Medium

What Do G2 Reviewers Say About Mouseflow?

AI-generated summary from verified user reviews

Pros
  • Users find Mouseflow's ease of use invaluable for gaining quick insights and enhancing marketing strategies.
  • Users value the clear insights from heatmaps and session replays, enhancing engagement and improving marketing strategies.
  • Users love the insightful heatmaps that enhance understanding of user behavior, helping improve site engagement and conversions.
  • Users find the easy setup of Mouseflow enables efficient tracking and enhances data collection for optimizing their websites.
  • Users praise Mouseflow for its session replay feature, allowing comprehensive tracking of customer journeys and user behavior.
Cons
  • Users find the missing features in Mouseflow hinder its usability, especially with outdated plugins and limited options.
  • Users experience data inaccuracies with Mouseflow, as loading times are slow and interactions often misrepresent actual behavior.
  • Users report filtering issues in Mouseflow, making it challenging to locate relevant session recordings efficiently.
  • Users find a lack of information on behavior patterns, which complicates their understanding of customer journeys.
  • Users find Mouseflow to be expensive, particularly for small businesses with tight budgets and limited usage.

What Are Recent G2 Reviews of Mouseflow?

What Are G2 Users Discussing About Mouseflow?

Exatom

Unlock the Hidden Conversion Potential of Your Online Forms and Check-Out. And increase form completion by +20%. An immediate contribution to your Marketing ROI. FORM ANALYTICS | REAL-TIME MONITORING | SMART TOOLTIPS | ABANDONMENT RECOVERY | CONSULTANCY Exatom helps you turn more visitors into leads and sales. By revealing exactly why users abandon your web forms and check-outs—and what to do about it. Most marketers focus all their effort on getting traffic to forms. But they overlook the moment that matters most: the form itself. That’s where most conversions are lost. ❌ GA4 can’t help you here. ✅ Exatom can. Used by top brands like BMW, Kia, Hema, and Brooks Running, Exatom gives you: • Instant clarity on where users drop off • Actionable insights to fix friction fast • No developers needed (no-code implementation, cookieless) 💡 Try it free and get a custom revenue loss assessment—see what your forms are costing you right now. Stop leaking conversions. Start hitting your targets with forms that actually convert. What insights do our FORM ANALYTICS offer you? - quantifying the happy path: form view -> start -> submit -> convert - quantifying the drop-offs: not starting - start but not submitting - submitting but failed - UX experiences like autofill rates, error rates, duration to complete - analysis by browser, by device, by UTM - for each form field: drop-offs, interactions, interaction time, hesitation time, error rate and error messages, corrections, autofill rate, blank rate, rage clicks - instant view of form SESSION REPLAYS, linked to the analytics (no sampling) - INDUSTRY BENCHMARKING to understand your performance compared to the industry and same type of form - CRO PULSE, out Chrome Extension to view your analytics directly on your website What does FORM MONITORING do? - weekly overview by email showing the 6 key metrics and its trends for each form - alert notifications when your form or check-out performance deviates from the past - alert notifications when the situation is back to normal How will SMART TOOLTIPS help you? - digital marketers can create and manage their own tooltip campaigns - personalised and triggered upon user behaviour - functional messages, i.e. to help to create a correct password - motivational messages, i.e. to provide more info and nudge a user to continue - testing and preview before publishing - A/B testing within the platform - form optimisation without the need of developers

Average Rating: 4.7/5.0

Total Reviews: 44

How Do G2 Users Rate Exatom?

  • Sessions - Digital Analytics: 9.4/10 (Category avg: 8.8/10)
  • Engagement: 9.3/10 (Category avg: 8.7/10)
  • Trending: 9.5/10 (Category avg: 8.4/10)
  • Has the product been a good partner in doing business?: 9.7/10 (Category avg: 9.0/10)

Who Is the Company Behind Exatom?

  • Seller: Exatom
  • Year Founded: 2021
  • HQ Location: Leuven, BE
  • Twitter: @Exatom_io
    4 Twitter followers
  • LinkedIn® Page: www.linkedin.com
    11 employees on LinkedIn®

Who Uses This Product?

  • Top Industries: Automotive, Marketing and Advertising
  • Company Size: 48% Medium, 30% Small

What Do G2 Reviewers Say About Exatom?

AI-generated summary from verified user reviews

Pros
  • Users find Exatom a helpful tool for gaining insights and improving form efficiency with its user-friendly platform.
  • Users value the powerful insights from Exatom, enhancing form efficiency and improving user engagement significantly.
  • Users find Exatom’s ease of use enhances efficiency, backed by responsive support and strong training processes.
  • Users value the powerful analytics from Exatom, enhancing form efficiency and driving informed decision-making.
  • Users rave about Exatom's effective conversion optimization, experiencing improved lead forms and actionable insights for better performance.
Cons
  • Users find the complexity of the dashboard challenging, requiring time and effort to familiarize with its functionality.
  • Users find the learning curve steep for Exatom's dashboard, requiring time to fully understand its features.
  • Users find the steep learning curve of Exatom's dashboard challenging, especially for newcomers and complex forms.
  • Users find the complex usability of Exatom challenging, especially when handling numerous KPIs and intricate forms.
  • Users find the lack of information clarity in Exatom's dashboard can lead to confusion and a steep learning curve.

What Are Recent G2 Reviews of Exatom?

Plerdy

Plerdy CRO, SEO & A/B Testing Tools — a powerful toolkit designed to enhance conversions, refine user experience, and optimize your online store’s performance. 🚀 A/B Testing Tool With Plerdy's A/B Testing Tool, you can test variations of your website’s elements effortlessly. It’s ideal for e-commerce and online businesses that want to improve user interactions and increase conversions. Set up A/B tests quickly, check real-time data, and use insights to make informed, data-backed decisions. 🔥 Heatmaps Plerdy's dynamic heatmaps give you a detailed view of how users interact with your website. Track scroll depth, cursor movement, clicks, and even text selection. This breakdown by traffic source or device helps you fine-tune usability and increase engagement. 💬 Pop-Up Forms & NPS Plerdy’s customizable pop-up forms help you engage with your audience. Capture feedback, gather leads, or share targeted messages with over 25 customization options. Create engaging experiences by tailoring forms to different segments, helping boost your connection with users. 🔍 SEO Checker Boost your SEO without impacting your website’s loading speed. Plerdy’s SEO Checker offers daily automated audits, comprehensive reports, and insights aligned with Google’s mobile-first indexing. This tool lets you stay updated on SEO status, visibility, and site performance improvements. 🎥 Session Replay Understand user journeys better with Plerdy’s session replay. View actual user interactions, segment recordings by traffic channels or devices, and reveal insights that can help refine the user experience across your website. 📊 Conversion Rate and Events Track key events automatically with Plerdy’s conversion tools. Build conversion funnels, identify drop-off points, and take steps to optimize the user journey, leading to higher conversions and an improved overall experience. 💼 Sales Performance (E-commerce Tracking) For e-commerce businesses, Plerdy’s sales performance tracking reveals how users interact with your products. Spot non-performing items and adjust your strategy to maximize sales and profitability. 🛠 Customization and Integration Plerdy is designed to fit into your existing systems seamlessly. Customize the tools according to your needs and integrate them with your workflows, ensuring an efficient optimization process. With Plerdy, you get all the essentials to elevate your site’s performance, boost conversions, and improve SEO. Try these tools to better understand user behavior and make data-driven improvements. 🌟

Average Rating: 4.7/5.0

Total Reviews: 317

How Do G2 Users Rate Plerdy?

  • Sessions - Digital Analytics: 9.3/10 (Category avg: 8.8/10)
  • Engagement: 9.2/10 (Category avg: 8.7/10)
  • Trending: 9.4/10 (Category avg: 8.4/10)
  • Has the product been a good partner in doing business?: 9.5/10 (Category avg: 9.0/10)

Who Is the Company Behind Plerdy?

  • Seller: Plerdy
  • Year Founded: 2017
  • HQ Location: Lviv, Lvivska
  • Twitter: @plerdy_com
    111 Twitter followers
  • LinkedIn® Page: www.linkedin.com
    13 employees on LinkedIn®

Who Uses This Product?

  • Who Uses This: Owner, CEO
  • Top Industries: Marketing and Advertising, Information Technology and Services
  • Company Size: 90% Small, 6% Medium

What Do G2 Reviewers Say About Plerdy?

AI-generated summary from verified user reviews

Pros
  • Users value the affordable heatmaps of Plerdy, enjoying the combined insights and additional tools it provides.
  • Users find Plerdy to be incredibly intuitive, greatly enhancing their website optimization process and user experience.
  • Users value the deep insights into user behavior provided by Plerdy, enhancing website optimization and design strategies.
  • Users appreciate the user-friendly interface of Plerdy, making it easy to optimize their online marketing efforts.
  • Users value the easy setup of Plerdy, allowing for seamless integration and quick start without hassle.
Cons
  • Users find the learning curve steep due to numerous features and an overwhelming dashboard experience.
  • Users find the steep learning curve of Plerdy challenging, making initial setup and navigation somewhat difficult.
  • Users find the complex features of Plerdy challenging at first, requiring time to adapt and understand fully.
  • Users find that the complexity of Plerdy's numerous features can be overwhelming and affects usability.
  • Users find the interface usability lacking, expressing a desire for smoother navigation and simpler design choices.

What Are Recent G2 Reviews of Plerdy?

What Are G2 Users Discussing About Plerdy?

Crazy Egg

Since 2005, Crazy Egg has helped hundreds of thousands of website owners pay attention to every website visitor, so they can get the most out of every website visit. With access to 5 different types of heatmaps, a visitor recordings/session replay tool, A/B testing, AND surveys, you have the complete package to transform your business by improving your user experience.

Average Rating: 4.2/5.0

Total Reviews: 125

How Do G2 Users Rate Crazy Egg?

  • Sessions - Digital Analytics: 8.9/10 (Category avg: 8.8/10)
  • Engagement: 9.2/10 (Category avg: 8.7/10)
  • Trending: 6.7/10 (Category avg: 8.4/10)
  • Has the product been a good partner in doing business?: 8.6/10 (Category avg: 9.0/10)

Who Is the Company Behind Crazy Egg?

  • Seller: Crazy Egg
  • Year Founded: 2006
  • HQ Location: La Mirada, CA
  • Twitter: @CrazyEgg
    43,482 Twitter followers
  • LinkedIn® Page: www.linkedin.com
    43 employees on LinkedIn®

Who Uses This Product?

  • Who Uses This: Digital Marketing Manager
  • Top Industries: Marketing and Advertising, Computer Software
  • Company Size: 43% Medium, 43% Small

What Do G2 Reviewers Say About Crazy Egg?

AI-generated summary from verified user reviews

Pros
  • Users praise the ease of use of Crazy Egg, finding navigation and installation straightforward and hassle-free.
  • Users highly value the intuitive heat maps of Crazy Egg, enhancing their ability to analyze user behavior effectively.
  • Users find the easy setup of Crazy Egg perfect for their needs, enjoying a seamless experience compared to GA4.
  • Users commend the exceptional customer support of Crazy Egg, appreciating timely and practical assistance for their needs.
  • Users value the intuitive heat maps of Crazy Egg, which enhance website optimization and user experience significantly.
Cons
  • Users are frustrated by the requirement to install a tracking script before accessing full Crazy Egg features.
  • Users find the limited features of Crazy Egg restricts their ability to fully explore its capabilities without a live site.
  • Users note the missing advanced features in Crazy Egg, desiring more comprehensive analytics and segmentation options.
  • Users find filtering issues in Crazy Egg limit its effectiveness, especially in dynamic reporting and advanced analytics.
  • Users find the limited analysis features of Crazy Egg restrictive compared to more advanced analytics tools.

What Are Recent G2 Reviews of Crazy Egg?

What Are G2 Users Discussing About Crazy Egg?

Alanna Iwuh
A
Researched and written by Alanna Iwuh
Updated October 3, 2024