Products
(2912)
Maya is a real world data platform designed to connect psychedelic providers, participants, and researchers. Together, our global community is charting a knowledge base that can inform safe and accessible psychedelic practices.
eazyBI provides easy-to-use drag-and-drop creation of reports, charts and dashboards. Analyze imported data measures by any dimension, identify trends and top/bottom performers, start from summary overview and drill into details.
COOLSIS student information systems accommodate everything from small elementary schools to large, multi-campus educational facilities, working with and for both charter schools and private schools in Texas and throughout the United States and even internationally.
Let people who share the same goals collaborate together. Streamline your processes across the company, or ditch the organisational chart. Not everything can be planned so allow yourself to adapt to the situation on the fly and still collaborate together.
Quantros Quality Management Solutions Suite to optimize quality data collection, processing, analysis, and submission for both chart-abstracted and electronic clinical quality measures, helping to focus on what most important improving patient care and maximizing reimbursement.
The analytics platform for agencies, SaaS teams, and e-commerce brands that have outgrown spreadsheets and Looker Studio but don't need an enterprise BI deployment. Semantic layer, 27 chart types, AI-built dashboards, white-label client portals.
JarviX allows anyone even without programming knowledge to identify the root cause of a problem through data analytics by simply asking questions! So no more frustrations in graphs and charts, enable your data to tell its own story!
Unified Communications Analytics. Simplified. Variphy is the preferred analytics platform for Unified Communications. Zoom Phone Reporting and Analytics Variphy’s Call Analytics for Zoom Phone will allow you to search, analyze, and report on your team’s Zoom Phone call activity. Generate reports on-demand or schedule for multiple output formats, including PDF, XLSX, CSV, & HTML. Advanced Zoom Phone Analytics - Web-based - Robust historical call log reporting - Fully customizable dashboard
DXcharts is a cross-platform customisable financial charting application for technical analysis and market data visualization of multiple asset classes both in real-time and retroactively. It can be integrated in any web or mobile application and is used by brokers, banks, software vendors and other capital markets firms.
New Anglia University is a prestigious institution nestled in the heart of George Hill, Anguilla, North America. Chartered by the Government of Anguilla, the university stands as a beacon of academic excellence, offering a contemporary and high-quality Medical program that prepares students for success in the ever-evolving field of healthcare.
BevTrack is an easy to use app for your beverage sales team to use to track location visits, meetings, beverage orders, set distribution targets, plan routes for your sales team, add location data from contacts to number of taps, set reminders and more. Load your distribution locations via our data import tool or have your team enter new locations as they visit them. Share all collected data across your team or silo data among admins, managers, or sales team leaders. Team Sales Features: Accoun
Zentrix OS is a cloud-based business operating system built for leadership teams running EOS. Manage Rocks, Scorecards, L10 meetings, V/TO, and Accountability Charts — all in one platform. Replace scattered spreadsheets with a single source of truth for your entire EOS rhythm.
DashQuill adds modern patient engagement and workflow tools directly into your existing EHR. Practices can manage patient forms, texting, faxing, telehealth, and AI scribing from their normal workflow, with information flowing directly to and from the patient chart. Unlike standalone tools, DashQuill can update chart fields from patient forms, sync patient contacts, match and file incoming faxes, pull information directly from the EHR, and write completed documents and clinical notes back to th
AnyChart Stock and Financial Charts is a JavaScript based financial charting solution that turns real time data into highly sophisticated charts with interactive capability, bringing visualization of data to the Web to display date and time based information suites for client reporting and performance reporting applications.
Building Manager Online is an energy management software hosted data collection, warehousing and internet reporting service provided for users of the OBVIOUS AcquiSuite and AcquiLite hardware. It provides access to energy information and allows to plot charts and view data without any custom software installed on PC.
Klinikly is a dental practice management software built for dental clinics in the Philippines. It combines patient records, online booking and scheduling, 2D and 3D dental charting, treatment plans, billing and HMO claims, automated recalls, telemedicine, and clinic analytics in one cloud platform that runs on any browser or phone.
Sapience HRMS is an integrated HR and Payroll Software designed to meet the requirements of Middle East countries. Sapience HRMS is loaded with all the features required to manage Recruitment, Core HR and employee management, payroll, time attendance, travel and expense claim, performance management, training, organization chart, employee and managerial self-service portal.
NEO EHR is a cloud-based electronic health records and practice management platform built for chiropractic and wellness clinics. It combines clinical documentation, scheduling, and billing functions in a single system, with modules covering patient charting, appointment scheduling, insurance claims processing, payment processing, and a patient portal (MyNEOHealth) for account management and communication.
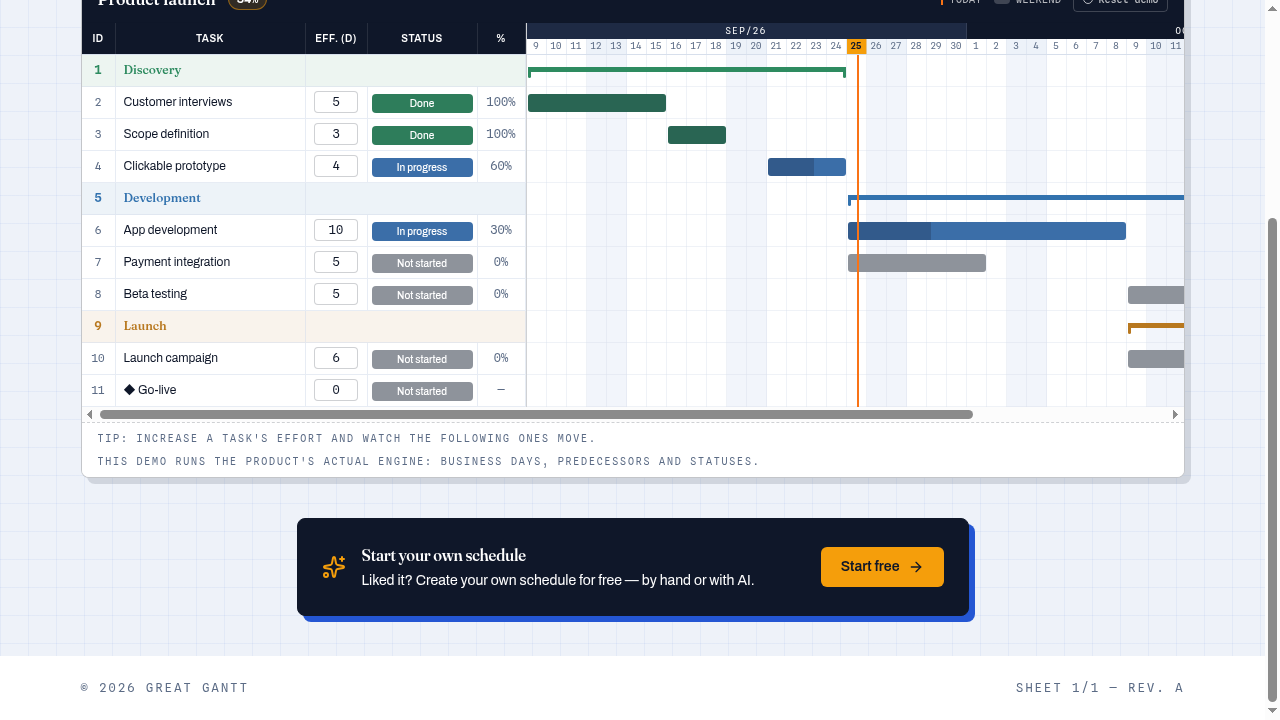
Great Gantt is a Gantt chart app with AI for students and construction professionals. Describe your project in plain language and get a schedule with phases, milestones and timelines. Writing a thesis chapter? The methodology schedule appears next to your text. Simple enough for a class project, powerful enough for a construction site. Free plan available.
Custom reports and premade for sales, inventory, taxes, etc. Merge reporting data with popular apps. With Report Pundit, you’ll have a flexible reporting system to access all Shopify data and create custom reports for your unique needs. Utilize pre-made reports, with live chat here to assist! We also help build cohort tables, visual charts, and dashboards. Our report categories include Sales Reports, Products, Inventory, Taxes, Orders, Payouts, Transactions, Fulfillment, Cart Attributes, POS, C