Best Network Monitoring Software for Medium-Sized Businesses - Page 2

How Many Network Monitoring Software Products Does G2 Track?

Total Products under this Category: 228

Category Stats (Oct 2026)

  • Average Rating: 4.49/5 (↓0.01 vs Sep 2026) The average rating of products in this category, based on all submitted ratings
  • Top Trending Product: Netcrunch (+1.38%) - Among all products in this category, Netcrunch recorded the largest rating increase compared to last month

Last updated: October 01, 2026

How Does G2 Rank Network Monitoring Software Products?

Why You Can Trust G2's Software Rankings:

  • 30 Analysts and Data Experts
  • 19,900+ Authentic Reviews
  • 228+ Products
  • Unbiased Rankings

G2's software rankings are built on verified user reviews, rigorous moderation, and a consistent research methodology maintained by a team of analysts and data experts. Each product is measured using the same transparent criteria, with no paid placement or vendor influence. While reviews reflect real user experiences, which can be subjective, they offer valuable insight into how software performs in the hands of professionals. Together, these inputs power the G2 Score, a standardized way to compare tools within every category.

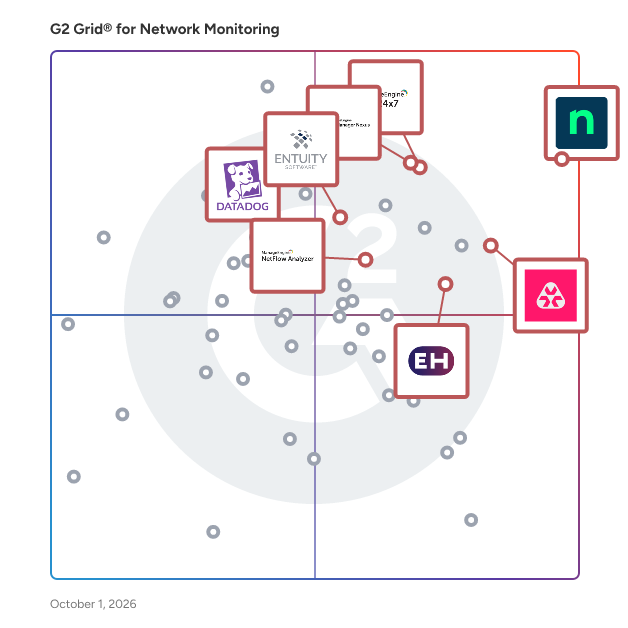
G2 Grid® for Network Monitoring Software

G2 Grid® for Network Monitoring Software plotting products by satisfaction and market presence

Highlighted products: NinjaOne, OpManager Nexus, Site24x7, Entuity, Remote Monitoring and Management, ManageEngine NetFlow Analyzer, Datadog, and ExtraHop.

Underlying data: [Grid® JSON](https://www.g2.com/categories/network-monitoring/grids.json?focus%5B%5D=ninjaone&focus%5B%5D=opmanager-nexus&focus%5B%5D=site24x7&focus%5B%5D=entuity&focus%5B%5D=remote-monitoring-and-management&focus%5B%5D=manageengine-netflow-analyzer&focus%5B%5D=datadog&focus%5B%5D=extrahop&segment=mid-market)

Progress WhatsUp Gold

WhatsUp Gold is an IT infrastructure monitoring software designed to help users identify and resolve network issues swiftly, often before they impact end users. This solution provides comprehensive visibility into network performance and availability, enabling IT professionals to maintain optimal operations across their infrastructure. With its interactive mapping interface, WhatsUp Gold allows users to visualize the status of all devices connected to their network, making it easier to monitor both on-premise and cloud-based resources. Targeted primarily at IT administrators and network engineers, WhatsUp Gold is particularly beneficial for organizations that rely heavily on network performance for their daily operations. Its user-friendly design caters to both seasoned professionals and those new to network management, offering a range of features that streamline the monitoring process. The software is designed to support various use cases, from small businesses needing basic monitoring capabilities to large enterprises requiring advanced network management solutions. One of the standout features of WhatsUp Gold is its customizable drag-and-drop dashboards, which provide users with the flexibility to tailor their monitoring experience according to specific needs. These dashboards present real-time data on device status and performance, allowing users to quickly assess the health of their network. Additionally, the software’s automatic discovery and mapping capabilities enable users to visualize their entire network topology, ensuring that no device goes unnoticed during monitoring. WhatsUp Gold also emphasizes optimization, helping users manage network traffic and bandwidth utilization effectively. By providing actionable insights and unified views of network performance, the software empowers IT teams to troubleshoot issues efficiently. The ability to identify and resolve network and server problems proactively not only enhances operational efficiency but also improves overall user satisfaction by minimizing downtime. In summary, WhatsUp Gold offers a robust and interactive solution for IT infrastructure monitoring, combining ease of use with powerful features. Its focus on real-time visibility, customization, and proactive troubleshooting makes it a valuable tool for organizations looking to enhance their network management capabilities.

Average Rating: 4.4/5.0

Total Reviews: 380

How Do G2 Users Rate Progress WhatsUp Gold?

  • Has the product been a good partner in doing business?: 8.8/10 (Category avg: 8.8/10)
  • Performance Monitoring: 9.1/10 (Category avg: 8.9/10)
  • Multi-Network Capability: 8.7/10 (Category avg: 8.7/10)
  • Path Analysis: 8.3/10 (Category avg: 8.4/10)

Who Is the Company Behind Progress WhatsUp Gold?

  • Seller: Progress Software
  • Company Website:
  • Year Founded: 1981
  • HQ Location: Burlington, MA.
  • Twitter: @ProgressSW
    48,773 Twitter followers
  • LinkedIn® Page: www.linkedin.com
    4,242 employees on LinkedIn®

Who Uses This Product?

  • Who Uses This: Network Engineer, Network Administrator
  • Top Industries: Information Technology and Services, Education Management
  • Company Size: 58% Medium, 27% Large

What Do G2 Reviewers Say About Progress WhatsUp Gold?

AI-generated summary from verified user reviews

Pros
  • Users value the ease of use of Progress WhatsUp Gold, appreciating its intuitive interface and simple setup process.
  • Users love the real-time visibility provided by WhatsUp Gold’s interactive network maps and intuitive dashboards.
  • Users value the real-time visibility and ease of use provided by Progress WhatsUp Gold for network performance monitoring.
  • Users value the timely and proactive alert notifications of Progress WhatsUp Gold, enhancing issue detection and network reliability.
  • Users appreciate the intuitive user interface of Progress WhatsUp Gold, enhancing real-time network monitoring and management.
Cons
  • Users find the cost of Progress WhatsUp Gold to be high, especially for smaller organizations and add-ons.
  • Users find the poor interface design of Progress WhatsUp Gold can be clunky and outdated in complex setups.
  • Users find the complex setup process of Progress WhatsUp Gold to be cumbersome and challenging, especially for advanced configurations.
  • Users note a steep learning curve with Progress WhatsUp Gold, particularly for advanced configuration and initial setup.
  • Users find the interface outdated, especially when managing complex environments, impacting overall user experience.

What Are Recent G2 Reviews of Progress WhatsUp Gold?

What Are G2 Users Discussing About Progress WhatsUp Gold?

Pandora FMS

Pandora FMS is a unified monitoring and observability platform designed to consolidate visibility, alerting, reporting, and automation across heterogeneous IT environments. Instead of combining multiple point tools for networks, servers, applications, and cloud services, Pandora FMS centralizes data collection and operational workflows in a single console, reducing integration effort and operational complexity in on-premise, hybrid, and multi-cloud architectures. The platform collects telemetry using multiple methods, including agents, remote checks, standard protocols (e.g., SNMP/WMI), APIs, and log/event ingestion. This enables teams to monitor infrastructure and services end-to-end, correlate signals, and maintain consistent alerting policies and dashboards across distributed estates. Pandora FMS also supports capacity and trend analysis to anticipate resource constraints and identify recurring patterns, and includes AI-assisted capabilities for anomaly detection and automated thresholds to surface hard-to-spot operational signals. Pandora FMS is extensible through a large plugin ecosystem (500+ plugins and integrations), covering a wide range of enterprise and infrastructure technologies such as SAP, Oracle, Citrix, JBoss, VMware, AWS, SQL Server, Red Hat, and WebSphere. This extensibility helps organizations standardize monitoring across legacy and modern stacks without redesigning their monitoring approach per technology. Core capabilities: -Unified monitoring for networks, servers, applications, cloud services, endpoints, and logs -Centralized alerting, event correlation, dashboards, and scheduled reporting -Flexible data collection via agents, remote checks, APIs, and plugins -Scalability for distributed environments and large numbers of monitored elements -Analytics for trend/capacity planning plus AI-assisted anomaly detection and dynamic thresholds -A key differentiator is direct vendor support, which simplifies escalation and ensures continuity of expertise for deployment, tuning, and ongoing operations.

Average Rating: 4.6/5.0

Total Reviews: 212

How Do G2 Users Rate Pandora FMS?

  • Has the product been a good partner in doing business?: 9.0/10 (Category avg: 8.8/10)
  • Performance Monitoring: 9.5/10 (Category avg: 8.9/10)
  • Multi-Network Capability: 9.4/10 (Category avg: 8.7/10)
  • Path Analysis: 9.1/10 (Category avg: 8.4/10)

Who Is the Company Behind Pandora FMS?

  • Seller: Pandora FMS
  • Company Website:
  • Year Founded: 2004
  • HQ Location: Madrid, Spain
  • Twitter: @pandorafms
    5,458 Twitter followers
  • LinkedIn® Page: www.linkedin.com
    56 employees on LinkedIn®

Who Uses This Product?

  • Who Uses This: Data Analyst
  • Top Industries: Information Technology and Services, Telecommunications
  • Company Size: 50% Medium, 37% Small

What Do G2 Reviewers Say About Pandora FMS?

AI-generated summary from verified user reviews

Pros
  • Users value the reliable remote monitoring capabilities of Pandora FMS, ensuring seamless oversight of their systems.
  • Users enjoy the ease of use of Pandora FMS, appreciating its intuitive interface and reliable support.
  • Users value the real-time monitoring capabilities of Pandora FMS, enhancing visibility of all network devices effortlessly.
  • Users value the flexibility and adaptability of Pandora FMS, making it suitable for diverse IT monitoring needs.
  • Users value the versatility of network monitoring in Pandora FMS, effectively managing diverse devices and environments.
Cons
  • Users find the learning curve steep, particularly with initial setup and complex functionalities of Pandora FMS.
  • Users find the complex setup of Pandora FMS challenging, particularly due to compatibility issues and steep learning curves.
  • Users note the learning difficulty with Pandora FMS, especially for those lacking technical expertise for setup and configuration.
  • Users find the complex configuration of Pandora FMS challenging, especially without extensive technical expertise.
  • Users face a difficult learning curve with Pandora FMS, which can hinder effective usage for beginners.

What Are Recent G2 Reviews of Pandora FMS?

What Are G2 Users Discussing About Pandora FMS?

HPE Aruba Networking Management

HPE Aruba Networking Management Software, also known as AirWave, is a comprehensive network operations system designed to manage both wired and wireless infrastructures from HPE Aruba Networking and various third-party manufacturers. It offers granular visibility into devices, users, and applications, enabling IT organizations to proactively optimize network performance, enhance security, and improve the end-user experience. Key Features and Functionality: - Unified Network Management: AirWave provides centralized control over wired and wireless networks, allowing for efficient management of global enterprise infrastructures. - Granular Visibility: The software delivers detailed insights into network devices, user activities, and application performance, facilitating proactive monitoring and troubleshooting. - Real-Time Monitoring and Alerts: AirWave offers real-time diagnostics, proactive alerts, and historical reporting to quickly identify and resolve network issues. - Support for Multi-Vendor Environments: It manages a wide range of devices from HPE Aruba Networking and third-party manufacturers, ensuring flexibility in diverse network environments. - Enhanced Security: The platform strengthens wireless security by providing detailed visibility and control over network access and usage. Primary Value and Solutions Provided: AirWave addresses the challenges of managing complex, multi-vendor network environments by offering a unified platform that simplifies operations and enhances visibility. By providing real-time monitoring, proactive alerts, and detailed reporting, it enables IT teams to optimize network performance, swiftly troubleshoot issues, and ensure a secure and reliable network experience for end-users. This comprehensive approach reduces operational complexity and supports the efficient management of enterprise networks.

Average Rating: 4.6/5.0

Total Reviews: 26

How Do G2 Users Rate HPE Aruba Networking Management?

  • Has the product been a good partner in doing business?: 9.0/10 (Category avg: 8.8/10)
  • Performance Monitoring: 9.2/10 (Category avg: 8.9/10)
  • Multi-Network Capability: 8.8/10 (Category avg: 8.7/10)
  • Path Analysis: 8.3/10 (Category avg: 8.4/10)

Who Is the Company Behind HPE Aruba Networking Management?

Who Uses This Product?

  • Company Size: 46% Medium, 38% Large

What Do G2 Reviewers Say About HPE Aruba Networking Management?

AI-generated summary from verified user reviews

Pros
  • Users appreciate the configuration ease of HPE Aruba Networking Management, simplifying access point setup from one location.
  • Users value the strong security integration of HPE Aruba Networking Management, enhancing their cybersecurity measures seamlessly.
  • Users find HPE Aruba Networking Management to be easy to use, simplifying access point configuration from one location.
  • Users value the strong security integration in HPE Aruba Networking Management, enhancing their network safety and control.
  • Users value the user-friendly interface of HPE Aruba Networking Management, enhancing their experience with easy navigation.
Cons
  • Users find the complexity of HPE Aruba Networking Management confusing at times due to its nested structure.
  • Users find the additional licensing costs for advanced features of HPE Aruba Networking Management to be quite high.
  • Users find the learning curve steep with HPE Aruba Networking Management, leading to occasional confusion in navigation.

What Are Recent G2 Reviews of HPE Aruba Networking Management?

What Are G2 Users Discussing About HPE Aruba Networking Management?

AI can help you find the answers. G2 helps you trust them.

Connect G2 to Claude or ChatGPT for answers grounded in G2's trusted reviews, comparisons, and pricing from real user insights.

How it works

Motadata ObserveOps

Motadata ObserveOps (formerly known as AIOps) is a full-stack observability platform that gives IT and operations teams complete visibility across their infrastructure, networks, and applications. It unifies metrics, logs, and traces in one place, replacing scattered point tools with a single source of truth for the health of the environment. Built on DFIT (Deep Learning Framework for IT Operations), ObserveOps applies AI and machine learning to correlate signals, detect anomalies, and identify the root cause of incidents faster. Core capabilities include real-time monitoring, customizable dashboards and reports, intelligent alerting, network and flow analysis, log analytics, and automated network configuration backups. ObserveOps covers on-premises, cloud, and hybrid environments, and supports on-premises deployment for organizations with data control requirements. Teams use it to reduce downtime, resolve issues proactively, and base operational decisions on reliable, correlated data.

Average Rating: 4.6/5.0

Total Reviews: 31

How Do G2 Users Rate Motadata ObserveOps?

  • Has the product been a good partner in doing business?: 9.6/10 (Category avg: 8.8/10)
  • Performance Monitoring: 9.6/10 (Category avg: 8.9/10)
  • Multi-Network Capability: 9.2/10 (Category avg: 8.7/10)
  • Path Analysis: 9.0/10 (Category avg: 8.4/10)

Who Is the Company Behind Motadata ObserveOps?

  • Seller: Mindarray Systems
  • Year Founded: 2010
  • HQ Location: Ahmedabad, India
  • Twitter: @MotadataSystems
    152 Twitter followers
  • LinkedIn® Page: www.linkedin.com
    25 employees on LinkedIn®
  • Phone: 1800 889 1915

Who Uses This Product?

  • Top Industries: Computer & Network Security
  • Company Size: 53% Medium, 31% Small

What Do G2 Reviewers Say About Motadata ObserveOps?

AI-generated summary from verified user reviews

Pros
  • Users love the powerful dashboard with customizable widgets, enhancing their ability to monitor and analyze data effectively.
  • Users value the powerful dashboards of Motadata ObserveOps for their detailed features and ease of use.
  • Users appreciate the ease of use of Motadata ObserveOps, valuing its clear interface and straightforward configuration.
  • Users appreciate the detailed implementation of features in Motadata ObserveOps, enhancing technical functionality and graphical representation.
  • Users value the comprehensive monitoring capabilities of Motadata ObserveOps, appreciating its detailed technical and graphical representations.
Cons
  • Users face challenges with complex configuration, including licensing for technicians and dual LAN issues.
  • Users face configuration difficulties with licensing for technicians and issues with dual LAN settings in Motadata ObserveOps.
  • Users express concern over licensing issues related to technicians, which complicates their operational experience with ObserveOps.
  • Users face technical issues with licensing for technicians and dual LAN configuration problems affecting usability.

What Are Recent G2 Reviews of Motadata ObserveOps?

What Are G2 Users Discussing About Motadata ObserveOps?

Checkmk

Checkmk is a full-stack monitoring and observability platform designed to provide unified visibility into hybrid IT infrastructures. With more than 2,000 built-in integrations, it offers broad coverage across networks, servers, cloud workloads, Kubernetes and applications. The platform is highly automated, featuring auto-discovery of hosts and services and rule-based configuration to reduce manual setup. It is highly scalable, capable of efficiently monitoring thousands of hosts and millions of services. A central web-based interface allows users to manage configuration, visualize data with customizable dashboards, and track system performance over time. Checkmk is available as packages for all common Linux distributions, as a virtual or physical appliance, through AWS and Azure Marketplace images, or as SaaS. Checkmk is available in four editions: Checkmk Community offers free and open source monitoring for small infrastructures. Checkmk Pro allows for monitoring at speed and scale for data center infrastructures. Checkmk Ultimate offers full-stack observability for hybrid and cloud-native infrastructures which is also available with multi-tenancy and data segregation to support security and compliance. And Checkmk Cloud for full-stack observability for hybrid and cloud-native infrastructures in a SaaS platform. Available extensions include synthetic monitoring and OpenTelemetry for application monitoring. The Checkmk Relay enables secure data collection for segmented networks using outbound-only communication, supporting fully air-gapped and zero-inbound monitoring deployments. Checkmk supports integration with ITSM tools and third-party platforms, enabling automatic ticket creation and consistent alerting. Features such as forecasting, capacity planning, and asset inventory as well as lifecycle management and auto-registration help teams manage dynamic IT environments. Monitoring capabilities: - Monitoring of hybrid infrastructures: cloud, on-premises, virtual, and container environments. - 2000+ built-in integrations networks, servers, cloud workloads, Kubernetes and applications out-of-the-box dashboards provide key metrics for AWS and Azure environments, Linux and Windows servers, and Kubernetes clusters. - Automated discovery and configuration. - Alerting with native ITSM integrations. Operational benefits: - Provides insights into system health, capacity trends, and future resource needs through built-in assessments and forecasting tools. - Reduces manual effort with auto-discovery, rule-based configuration, and centralized agent management as well as auto-registration and host lifecycle management. - Accelerates incident response time by using custom self-healing workflows via the ‘Alert Handler’. - Allows creation of tailored dashboards and views to focus on the most relevant metrics for each team. - Maintains an up-to-date inventory of hardware and software assets, enriched with live monitoring data. - Supports distributed monitoring and can handle massive amounts of data. Why choose Checkmk? - Cost Efficiency: Transparent pricing model with a strong price-performance ratio - Security: Meets stringent security requirements, including fully air-gapped deployments and zero-inbound monitoring. - Visibility: Delivers broad and deep visibility with flexible deployment options. - Scalability: Scales efficiently to support large, distributed environments with high host and service counts. - Extensibility: Supports custom plug-ins, integrations, synthetic monitoring to monitor you applications from the user’s perspective and OpenTelemetry for application monitoring. Customers include: Adobe, Cloudera, Fujitsu, Siemens, Orange, VW, HP, Zalando, Fitbit, NEC, Continental, NHL, Capgemini, Sixt, Intesa SanPaolo

Average Rating: 4.7/5.0

Total Reviews: 295

How Do G2 Users Rate Checkmk?

  • Has the product been a good partner in doing business?: 9.0/10 (Category avg: 8.8/10)
  • Performance Monitoring: 8.5/10 (Category avg: 8.9/10)
  • Multi-Network Capability: 8.5/10 (Category avg: 8.7/10)
  • Path Analysis: 7.2/10 (Category avg: 8.4/10)

Who Is the Company Behind Checkmk?

  • Seller: Checkmk
  • Company Website:
  • Year Founded: 2007
  • HQ Location: Munich, DE
  • Twitter: @checkmk
    1,755 Twitter followers
  • LinkedIn® Page: www.linkedin.com
    232 employees on LinkedIn®

Who Uses This Product?

  • Who Uses This: IT Engineer, Systemadministrator
  • Top Industries: Information Technology and Services, Computer & Network Security
  • Company Size: 42% Medium, 40% Large

What Do G2 Reviewers Say About Checkmk?

AI-generated summary from verified user reviews

Pros
  • Users appreciate the ease of use of Checkmk, finding it quick to deploy and well-documented.
  • Users commend Checkmk for its flexibility and powerful monitoring capabilities, effectively managing diverse IT infrastructures.
  • Users appreciate the comprehensive monitoring capabilities of Checkmk, enabling effective oversight of diverse IT environments.
  • Users value the flexibility and customization of Checkmk, making it a powerful solution tailored to their needs.
  • Users value Checkmk for its real-time monitoring capabilities, allowing efficient oversight of diverse systems and applications.
Cons
  • Users find the steep learning curve challenging, making onboarding difficult for non-regular users and complicating their experience.
  • Users find difficult learning due to complex customization and limited data insights in Checkmk, affecting usability.
  • Users find the configuration process overly complex, especially during onboarding for new and non-regular users.
  • Users find the learning difficulty steep due to complex configurations and lacking intuitive documentation for advanced features.
  • Users find the complex setup of Checkmk challenging, especially for newcomers unfamiliar with the system.

What Are Recent G2 Reviews of Checkmk?

What Are G2 Users Discussing About Checkmk?

Coralogix

Coralogix is a modern, full-stack observability platform transforming how businesses process and understand their data. Our unique architecture powers in-stream analytics without reliance on indexing or hot storage. We specialize in comprehensive monitoring of logs, metrics, trace and security events, enhancing operational efficiency and reducing total cost of ownership by up to 70%. Coralogix stands out for its simple pricing model, based solely on data volume ingested and retained, and offers free, fast customer support with less than 30 second response time and 1 hour resolution time. Our platform covers the entire range of observability with features such as APM, RUM, SIEM, Kubernetes monitoring and more, all streamlined for quick integration and immediate value. Components within the stream store the system state to provide stateful insights and real-time alerting without ever needing to index the data — so there are never any trade-offs to achieve observability. Once ingested, parsed, and enriched, data is written remotely to an archive bucket controlled by the client. The archive can be queried directly at any time, from the platform UI or via CLI, giving users infinite retention with full control over, and access to, their data. View and query your data from any dashboard using any syntax. Coralogix has successfully completed relevant security and privacy compliances by BDO including GDPR, SOC 2, PCI, HIPAA, and ISO 27001/27701.

Average Rating: 4.5/5.0

Total Reviews: 363

How Do G2 Users Rate Coralogix?

  • Has the product been a good partner in doing business?: 9.4/10 (Category avg: 8.8/10)
  • Performance Monitoring: 8.6/10 (Category avg: 8.9/10)
  • Multi-Network Capability: 7.9/10 (Category avg: 8.7/10)
  • Path Analysis: 8.1/10 (Category avg: 8.4/10)

Who Is the Company Behind Coralogix?

  • Seller: Coralogix
  • Company Website:
  • Year Founded: 2014
  • HQ Location: San Francisco, CA
  • Twitter: @Coralogix
    4,102 Twitter followers
  • LinkedIn® Page: www.linkedin.com
    591 employees on LinkedIn®

Who Uses This Product?

  • Who Uses This: Software Engineer, DevOps Engineer
  • Top Industries: Computer Software, Information Technology and Services
  • Company Size: 55% Medium, 33% Large

What Do G2 Reviewers Say About Coralogix?

AI-generated summary from verified user reviews

Pros
  • Users appreciate the ease of use of Coralogix, highlighting its simple setup and efficient integrations.
  • Users value the ease of log monitoring and seamless integration, enhancing overall observability and support responsiveness.
  • Users value the integration of logs, metrics, and alerts, enhancing efficiency in root-cause analysis and monitoring.
  • Users commend the exceptional customer support of Coralogix, ensuring quick resolutions and a smooth experience.
  • Users value the real-time monitoring of Coralogix, enhancing their understanding of user behavior and improving incident response.
Cons
  • Users find that the learning curve is steep for beginners, making navigation and understanding features challenging.
  • Users experience slow performance with Coralogix, leading to frustration due to delayed log fetching and UI loading.
  • Users find the difficult learning curve of Coralogix challenging, especially for beginners navigating complex options.
  • Users find the missing feature for downloading log results a significant limitation in Coralogix's functionality.
  • Users find the learning difficulty of Coralogix challenging, especially when navigating advanced features and the overwhelming UI.

What Are Recent G2 Reviews of Coralogix?

LogicMonitor

LogicMonitor is an AI-first observability platform that helps enterprises protect revenue, brand reputation, and customer experience in a digital-first world. As every customer interaction depends on application and infrastructure performance, downtime is more than an IT issue—it is a business risk. LogicMonitor eliminates blind spots across cloud, infrastructure, applications, and the Internet, giving IT teams unified visibility from user experience to code-level performance. With AI-powered insights, intelligent alerting, and automation, LogicMonitor helps organizations detect, prioritize, and prevent issues before they impact customers. By enabling teams to move from reactive incident response to autonomous IT operations, LogicMonitor helps modern enterprises reduce disruption, operate efficiently at scale, and keep digital services performing reliably. For more information, visit  www.logicmonitor.com and our blog, or follow us on LinkedIn, X, Facebook, and YouTube.

Average Rating: 4.5/5.0

Total Reviews: 586

How Do G2 Users Rate LogicMonitor?

  • Has the product been a good partner in doing business?: 9.0/10 (Category avg: 8.8/10)
  • Performance Monitoring: 8.9/10 (Category avg: 8.9/10)
  • Multi-Network Capability: 8.8/10 (Category avg: 8.7/10)
  • Path Analysis: 7.2/10 (Category avg: 8.4/10)

Who Is the Company Behind LogicMonitor?

  • Seller: LogicMonitor
  • Company Website:
  • Year Founded: 2007
  • HQ Location: Santa Barbara, CA
  • Twitter: @logicmonitor
    12,430 Twitter followers
  • LinkedIn® Page: www.linkedin.com
    1,258 employees on LinkedIn®

Who Uses This Product?

  • Who Uses This: Infrastructure Manager, IT Manager
  • Top Industries: Information Technology and Services, Computer Software
  • Company Size: 52% Medium, 30% Large

What Do G2 Reviewers Say About LogicMonitor?

AI-generated summary from verified user reviews

Pros
  • Users value the ease of use in LogicMonitor, benefiting from its intuitive navigation and simple management features.
  • Users praise the implementation ease of LogicMonitor, appreciating its fast setup and intuitive platform navigation.
  • Users value the broad range of monitoring features in LogicMonitor, enhancing both infrastructure and application oversight.
  • Users value the comprehensive monitoring of LogicMonitor, providing deep insights into applications and infrastructure effortlessly.
  • Users commend the excellent customer support of LogicMonitor, facilitating enhanced monitoring and problem management effortlessly.
Cons
  • Users find the steep learning curve challenging due to the need for advanced skills and internet reliance.
  • Users note limited features, facing challenges like integrations, training needs, and an expensive licensing model.
  • Users find LogicMonitor to be expensive, especially for small teams without a free tier or affordable licenses.
  • Users find the inadequate monitoring capabilities of LogicMonitor frustrating, especially with traditional server workloads and configuration demands.
  • Users find the complexity of integrations and setup challenging, often requiring external tools and training for effective use.

What Are Recent G2 Reviews of LogicMonitor?

What Are G2 Users Discussing About LogicMonitor?

SuperOps

SuperOps is an AI-native, unified platform built for modern Managed Service Providers (MSPs) and internal IT teams. It addresses one of the biggest operational challenges in IT- tool sprawl. Many organizations rely on multiple disconnected solutions for Professional Services Automation (PSA), Remote Monitoring and Management (RMM), Mobile Device Management (MDM), asset management, help desk, and network monitoring. Managing these separate tools often leads to complex integrations, fragmented data, and increased operational overhead. SuperOps eliminates this complexity by bringing everything together in a single platform built on a unified architecture. Unlike traditional solutions that connect multiple products through integrations, SuperOps is built on a shared data layer, allowing every feature to work seamlessly together. This unified approach enables IT teams to manage their entire environment from one platform while providing AI with the complete operational context needed to automate tasks and improve decision-making. Key Features 1) Professional Services Automation (PSA) for managing MSP business operations, contracts, billing, SLAs, and service delivery. 2) Remote Monitoring & Management (RMM) with unified endpoint management capabilities. 3) Help Desk & Ticketing with ITSM workflows for incidents, service requests, problems, and change management. 4) Mobile Device Management (MDM) for iOS, iPadOS, and Android devices. 5)Asset Management to maintain complete visibility across IT infrastructure. 6) Network Monitoring using SNMP and ICMP across more than **250+ network vendors. 7) Patch Management** for operating systems as well as third-party applications. 8) IT Documentation** and a modern **self-service portal** for end users. 9) Cross-platform endpoint management** supporting Windows, macOS, Linux, iOS, iPadOS, and Android. Monica AI: AI-Native IT Operations At the heart of SuperOps is **Monica AI**, an agentic AI layer designed alongside the platform from day one. Unlike AI assistants that operate as standalone chatbots, Monica has access to the platform's unified data layer, enabling it to understand the complete IT environment. Monica AI helps teams by: 1) Automatically triaging and prioritizing tickets. 2) Summarizing customer conversations and technician communications. 3) Drafting worklogs and technician notes. 4) Recommending relevant knowledge base articles. 5) Proactively identifying patch vulnerabilities and CVE risks. 6) Automating repetitive tasks such as password resets, software access requests, and recurring remediation workflows. Because Monica operates with complete visibility into tickets, devices, assets, patches, and policies, it can take context-aware actions rather than simply making recommendations. Integrations SuperOps integrates with a broad ecosystem of business, security, and productivity applications, including: - Slack - Microsoft Teams - Microsoft Outlook - Azure Active Directory - Okta - QuickBooks - Xero - Bitdefender - SentinelOne - ESET - Acronis - TeamViewer - ConnectWise Control - Chocolatey - Winget The platform also includes Splashtop and ISL Online remote access at no additional cost, helping organizations reduce software licensing expenses. Benefits for MSPs SuperOps enables MSPs to scale efficiently with features designed for operational growth and profitability. 1) Multi-tenant client management. 2) Real-time profitability tracking using live operational data. 3) Contract and SLA management. 4) Automated billing and invoicing. 5) AI-powered workflow automation to reduce manual effort. 6) Operational scalability without increasing headcount proportionally. Benefits for Internal IT Teams For enterprise IT departments, SuperOps provides centralized visibility and control across modern hybrid environments. - Unified endpoint management across multiple operating systems. - Infrastructure monitoring and asset visibility. - Compliance-ready audit trails. - Structured ITSM workflows. - AI-driven automation for routine IT operations. - Improved efficiency for hybrid and distributed workforces. Why Choose SuperOps? SuperOps combines modern architecture with enterprise-grade capabilities in a single platform designed for today's IT operations. - AI-native platform built from the ground up. - Single unified solution replacing multiple standalone tools. - Shared data architecture that eliminates data silos. - Fast implementation, typically measured in days rather than months. - Transparent pricing with no hidden complexity. - 24/5 human customer support. - Dedicated onboarding and migration assistance. - Continuous innovation from a founder-led product company. SuperOps helps MSPs and internal IT teams consolidate their IT operations stack into one unified platform, replacing reactive, tool-driven workflows with proactive, AI-powered service delivery. By reducing operational complexity and automating repetitive work, organizations can improve efficiency, enhance service quality, and scale without adding unnecessary overhead.

Average Rating: 4.4/5.0

Total Reviews: 204

How Do G2 Users Rate SuperOps?

  • Has the product been a good partner in doing business?: 9.3/10 (Category avg: 8.8/10)
  • Performance Monitoring: 8.2/10 (Category avg: 8.9/10)
  • Multi-Network Capability: 7.7/10 (Category avg: 8.7/10)
  • Path Analysis: 7.5/10 (Category avg: 8.4/10)

Who Is the Company Behind SuperOps?

  • Seller: SuperOps Inc
  • Company Website:
  • Year Founded: 2020
  • HQ Location: Claymont, US
  • LinkedIn® Page: www.linkedin.com
    172 employees on LinkedIn®

Who Uses This Product?

  • Who Uses This: Owner, Director
  • Top Industries: Information Technology and Services, Computer & Network Security
  • Company Size: 84% Small, 14% Medium

What Do G2 Reviewers Say About SuperOps?

AI-generated summary from verified user reviews

Pros
  • Users highlight the ease of use of SuperOps, allowing quick onboarding and effortless integration for all team members.
  • Users commend SuperOps for its exceptional customer support, highlighting quick responses and practical solutions from the team.
  • Users appreciate the user-friendly interface and feature-rich capabilities of SuperOps, making it an essential MSP tool.
  • Users praise SuperOps for its intuitive and attractive user interface, enhancing the efficiency of IT support operations.
  • Users love the intuitive interface of SuperOps, making multitasking and operations management effortless and efficient.
Cons
  • Users note a lack of features in SuperOps compared to competitors, affecting functionality and user experience.
  • Users note several feature issues with SuperOps, including limited integrations and cumbersome workflows affecting usability.
  • Users note integration issues with SuperOps, suggesting the need for more enhancements to existing integrations.
  • Users find access limitations frustrating, needing to download files and facing constraints with RMM and file size uploads.
  • Users find a lack of integrations in SuperOps, which limits functionality and potential enhancements.

What Are Recent G2 Reviews of SuperOps?

Zabbix

Zabbix is an all-in-one, open source monitoring and observability solution that makes any hardware, software, service, or web application more efficient and reliable. Available on-premise and in the cloud, Zabbix can deploy anywhere and monitor any device, system, or app in any environment – while providing comprehensive data protection, easy integration, and limitless data visualization options. Zabbix uses a wide range of data collection methods to collect metrics, defining smart problem thresholds and harnessing the power of machine learning to suppress unwanted alert storms and notify users regarding the root cause of issues. Metrics are displayed on intuitive, easy-to-understand dashboards that allow users to access issues, reports, and maps with a single click. Users can monitor anything from physical and virtual servers or containers to network infrastructure and applications. Zabbix allows users to: • Control their infrastructure by collecting any metric from any source • Detect problems instantly • Get alerted on critical issues • Gain additional insights and extend observability via powerful data visualization • Leverage a single pane of glass for an entire infrastructure • Keep track of KPI's with business service monitoring • Seamlessly deploy Zabbix within any infrastructure • Deploy with just a few clicks, either on-premise or in the cloud • Scale quickly and without limits • Do business with the peace of mind that enterprise-grade security provides Zabbix also offers a full range of professional services, including: • Technical support subscriptions • Zabbix professional training • Migration • Upgrades • Template building • Development • Integration • Consulting • Turnkey solution

Average Rating: 4.3/5.0

Total Reviews: 206

How Do G2 Users Rate Zabbix?

  • Has the product been a good partner in doing business?: 8.1/10 (Category avg: 8.8/10)
  • Performance Monitoring: 9.3/10 (Category avg: 8.9/10)
  • Multi-Network Capability: 9.0/10 (Category avg: 8.7/10)
  • Path Analysis: 7.8/10 (Category avg: 8.4/10)

Who Is the Company Behind Zabbix?

  • Seller: Zabbix
  • Company Website:
  • Year Founded: 2005
  • HQ Location: Riga, Latvia
  • Twitter: @zabbix
    9,943 Twitter followers
  • LinkedIn® Page: www.linkedin.com
    170 employees on LinkedIn®

Who Uses This Product?

  • Top Industries: Information Technology and Services, Telecommunications
  • Company Size: 61% Medium, 27% Large

What Do G2 Reviewers Say About Zabbix?

AI-generated summary from verified user reviews

Pros
  • Users appreciate the custom alert capabilities and fast alerts of Zabbix for effective monitoring of infrastructure.
  • Users find Zabbix to have a user-friendly integration process, making monitoring and alerting effortless.
  • Users value Zabbix's monitoring capabilities, effectively managing networks, servers, applications, and more across diverse infrastructures.
  • Users appreciate the monitoring ease of Zabbix, enjoying prompt alerts and intuitive dashboards for effective system management.
  • Users value the real-time monitoring capabilities of Zabbix, providing fast alerts and comprehensive infrastructure oversight.
Cons
  • Users find a steep learning curve when starting with Zabbix, complicating the setup of dashboards and integrations.
  • Users face dashboard limitations that hinder customization and fail to meet expectations, suggesting a need for enhancements.
  • Users highlight data limitations in Zabbix, finding it fails to meet expectations for customizable dashboards and features.
  • Users find the difficult configuration of Zabbix challenging, especially for new joiners and initial setups.
  • Users find the difficult learning curve challenging at first, especially with dashboards and calculations.

What Are Recent G2 Reviews of Zabbix?

What Are G2 Users Discussing About Zabbix?

SolarWinds Observability

SolarWinds® Observability is a comprehensive full-stack observability solution designed to meet the diverse needs of modern organizations, regardless of their size. This solution provides deep visibility into hybrid ecosystems, enabling users to monitor and manage both on-premises and cloud environments effectively. By optimizing performance and ensuring availability across distributed hybrid IT infrastructures, SolarWinds Observability supports organizations in navigating the complexities of their IT environments. Targeted at IT professionals and organizations that require robust monitoring capabilities, SolarWinds Observability caters to a wide range of use cases. It is particularly beneficial for businesses operating in hybrid environments, where the integration of on-premises and cloud resources is essential. The solution allows users to gain a holistic view of their networks, applications, databases, and user experiences, thereby facilitating better decision-making and operational efficiency. This is especially crucial in today’s fast-paced digital landscape, where downtime can significantly impact service reliability and customer satisfaction. One of the standout features of SolarWinds Observability is its built-in intelligence powered by AIOps capabilities. This functionality accelerates issue remediation by enabling users to detect, troubleshoot, and resolve problems more efficiently. The advanced predictive analysis and anomaly-based alerts help organizations proactively address potential issues before they escalate, ultimately reducing downtime and enhancing service reliability. Additionally, the solution's log pattern analysis further streamlines the troubleshooting process, allowing IT teams to focus on strategic initiatives rather than being bogged down by operational challenges. SolarWinds Observability offers flexibility in deployment, providing users with the option to choose between self-hosted and SaaS models. The self-hosted option integrates seamlessly with other SolarWinds services, such as security and storage monitoring, while the SaaS option is tailored for deeper monitoring of custom and cloud-based applications. This adaptability ensures that organizations can select the deployment method that best aligns with their operational needs and infrastructure. Moreover, SolarWinds Observability stands out by consolidating multiple monitoring tools into a single, integrated solution. This not only simplifies the monitoring process but also helps organizations reduce costs associated with managing disparate systems. By offering comprehensive visibility across hybrid IT environments, SolarWinds Observability empowers organizations to optimize their operations and enhance overall performance.

Average Rating: 4.3/5.0

Total Reviews: 831

How Do G2 Users Rate SolarWinds Observability?

  • Has the product been a good partner in doing business?: 8.3/10 (Category avg: 8.8/10)
  • Performance Monitoring: 9.2/10 (Category avg: 8.9/10)
  • Multi-Network Capability: 8.7/10 (Category avg: 8.7/10)
  • Path Analysis: 8.2/10 (Category avg: 8.4/10)

Who Is the Company Behind SolarWinds Observability?

  • Seller: SolarWinds Worldwide LLC
  • Company Website:
  • Year Founded: 1999
  • HQ Location: Austin, TX
  • Twitter: @solarwinds
    19,570 Twitter followers
  • LinkedIn® Page: www.linkedin.com
    2,864 employees on LinkedIn®

Who Uses This Product?

  • Who Uses This: Network Engineer, Network Administrator
  • Top Industries: Information Technology and Services, Hospital & Health Care
  • Company Size: 44% Large, 35% Medium

What Do G2 Reviewers Say About SolarWinds Observability?

AI-generated summary from verified user reviews

Pros
  • Users love the intuitive interface of SolarWinds Observability, making system management and monitoring effortless and efficient.
  • Users appreciate the comprehensive visibility of SolarWinds Observability, simplifying performance monitoring across diverse environments.
  • Users value the unified visibility across infrastructure that simplifies monitoring and accelerates troubleshooting effectively.
  • Users appreciate the monitoring capabilities of SolarWinds Observability, effectively managing and analyzing network environments.
  • Users appreciate the intuitive user interface of SolarWinds, enhancing the management and visibility of network performance.
Cons
  • Users find the pricing escalates quickly, making SolarWinds Observability less affordable for larger setups and features.
  • Users face a significant learning curve with SolarWinds Observability, complicating the use of advanced features and integrations.
  • Users face integration issues due to complex setups and limited support for ITSM platform connections, affecting usability.
  • Users find the complex setup of SolarWinds Observability challenging, requiring significant technical expertise and time investment.
  • Users find the configuration difficulty of SolarWinds Observability to be a significant hurdle in effective deployment.

What Are Recent G2 Reviews of SolarWinds Observability?

What Are G2 Users Discussing About SolarWinds Observability?

Catchpoint

The Internet relies on Catchpoint Global 5000 companies, top online retailers, financial services, cloud infrastructure and services companies, and xSPs trust Catchpoint’s Internet Performance Monitoring (IPM) to detect and resolve internal or external issues across the Internet stack before they impact customers, employees, or digital experiences. Offering Internet Synthetics, RUM, BGP, Heartbeat Monitoring, Distributed Tracing, and performance optimization with high-fidelity data and flexible visualizations, Catchpoint is powered by the world’s largest active agent network to provide real-world user experience visibility and internet stack insights that complement Application Performance Monitoring (APM) to give IT Ops team instant awareness of incidents, root cause insights, and quick resolution.

Average Rating: 4.5/5.0

Total Reviews: 109

How Do G2 Users Rate Catchpoint?

  • Has the product been a good partner in doing business?: 9.3/10 (Category avg: 8.8/10)
  • Performance Monitoring: 8.9/10 (Category avg: 8.9/10)
  • Multi-Network Capability: 8.9/10 (Category avg: 8.7/10)
  • Path Analysis: 8.5/10 (Category avg: 8.4/10)

Who Is the Company Behind Catchpoint?

  • Seller: LogicMonitor
  • Company Website:
  • Year Founded: 2007
  • HQ Location: Santa Barbara, CA
  • Twitter: @logicmonitor
    12,430 Twitter followers
  • LinkedIn® Page: www.linkedin.com
    1,258 employees on LinkedIn®

Who Uses This Product?

  • Who Uses This: Software Engineer
  • Top Industries: Information Technology and Services, Financial Services
  • Company Size: 65% Large, 22% Medium

What Do G2 Reviewers Say About Catchpoint?

AI-generated summary from verified user reviews

Pros
  • Users value Catchpoint for its real-time issue detection, enhancing performance monitoring and speeding up resolution times.
  • Users value Catchpoint for its effective monitoring capabilities, providing real-time insights and proactive issue detection.
  • Users appreciate the real-time alerting features of Catchpoint, enabling quick issue detection and seamless user experience.
  • Users value the real-time alerts from Catchpoint that enhance issue detection and improve system performance monitoring.
  • Users value the real-time alert notifications from Catchpoint, enabling swift issue resolution and enhanced performance monitoring.
Cons
  • Users feel that the pricing is too high and lacks transparency, making it less accessible for smaller teams.
  • Users find the complex configuration challenging initially, as it requires time to learn and master the features.
  • Users find the complex setup of Catchpoint challenging initially, requiring time to learn and configure its features.
  • Users report data inaccuracy with Catchpoint, noting false alerts that misrepresent test case failures during manual checks.
  • Users find the difficult learning curve of Catchpoint challenging initially, though it becomes easier with time.

What Are Recent G2 Reviews of Catchpoint?

What Are G2 Users Discussing About Catchpoint?

Intermapper

A Key Part of Fortra (the new face of HelpSystems) Intermapper is proud to be part of Fortra’s comprehensive cybersecurity portfolio. Fortra simplifies today’s complex cybersecurity landscape by bringing complementary products together to solve problems in innovative ways. These integrated, scalable solutions address the fast-changing challenges you face in safeguarding your organization. With the help of the powerful protection from Intermapper and others, Fortra is your relentless ally, here for you every step of the way throughout your cybersecurity journey.

Average Rating: 4.3/5.0

Total Reviews: 82

How Do G2 Users Rate Intermapper?

  • Has the product been a good partner in doing business?: 8.4/10 (Category avg: 8.8/10)
  • Performance Monitoring: 9.1/10 (Category avg: 8.9/10)
  • Multi-Network Capability: 9.2/10 (Category avg: 8.7/10)
  • Path Analysis: 8.1/10 (Category avg: 8.4/10)

Who Is the Company Behind Intermapper?

  • Seller: Fortra
  • Year Founded: 1982
  • HQ Location: Eden Prairie, Minnesota
  • Twitter: @fortraofficial
    2,773 Twitter followers
  • LinkedIn® Page: www.linkedin.com
    1,784 employees on LinkedIn®

Who Uses This Product?

  • Top Industries: Primary/Secondary Education, Education Management
  • Company Size: 49% Medium, 36% Large

What Do G2 Reviewers Say About Intermapper?

AI-generated summary from verified user reviews

Pros
  • Users appreciate the comprehensive monitoring capabilities of Intermapper, enabling proactive network management with effective visual alerts.
  • Users value the easy-to-implement monitoring of Intermapper, enabling proactive management of network status effortlessly.
  • Users value the efficient monitoring services of Intermapper, enabling proactive network management with clear visual alerts.
  • Users praise the effective alerting system of Intermapper, enabling quick identification of network issues and outages.
  • Users value the data accuracy of Intermapper, enabling proactive network status monitoring with effective alerts.
Cons
  • Users found the previous licensing issues for Intermapper cumbersome, though recent changes have improved the experience.

What Are Recent G2 Reviews of Intermapper?

What Are G2 Users Discussing About Intermapper?

Pulseway

Pulseway is RMM software, built to help MSPs and IT teams reduce downtime, take control and become more efficient. Pulseway provides all-in-one IT monitoring and management software, filled with features and modules to boost your productivity straight out of the box and never miss critical alerts. - Pulseway’s comprehensive remote monitoring and management (RMM) software provides a complete view across your network. View operational data for workstations, servers, VMs, network devices and more, while resolving issues straight from the same interface. - Be instantly alerted to issues, resolve them before they become a problem and minimize downtime – across the network. - Let you and your team be fully productive from anywhere to deliver first-class customer service wherever you are. - Automate repetitive IT tasks and automatically fix issues before they become a problem. - Pulseway built-in Mobile Remote Control enables simple, reliable, and fluid remote access to any monitored systems. Access files, applications and control remote systems as if you were sitting right in front of them. Try Pulseway RMM today with a free 14-day no-commitment trial to see for yourself.

Average Rating: 4.5/5.0

Total Reviews: 122

How Do G2 Users Rate Pulseway?

  • Has the product been a good partner in doing business?: 9.3/10 (Category avg: 8.8/10)
  • Performance Monitoring: 9.7/10 (Category avg: 8.9/10)
  • Multi-Network Capability: 9.9/10 (Category avg: 8.7/10)
  • Path Analysis: 8.8/10 (Category avg: 8.4/10)

Who Is the Company Behind Pulseway?

  • Seller: MMSoft Design
  • Year Founded: 2011
  • HQ Location: Dublin, Ireland
  • Twitter: @pulsewayapp
    6,073 Twitter followers
  • LinkedIn® Page: www.linkedin.com
    47 employees on LinkedIn®

Who Uses This Product?

  • Who Uses This: IT Manager, Owner
  • Top Industries: Information Technology and Services, Computer & Network Security
  • Company Size: 52% Small, 42% Medium

What Do G2 Reviewers Say About Pulseway?

AI-generated summary from verified user reviews

Pros
  • Users praise the intuitive interface of Pulseway, making it easy to implement and enhancing business operations seamlessly.
  • Users commend the easy setup of Pulseway, enabling seamless integration and management for their computer repair services.
  • Users appreciate the implementation ease of Pulseway, enjoying its quick setup and seamless integrations with existing tools.
  • Users appreciate the easy integrations of Pulseway, enhancing efficiency in monitoring and managing infrastructure seamlessly.
  • Users value the s seamless integrations of Pulseway with other software, enhancing efficiency and support capabilities.
Cons
  • Users note the limited features of Pulseway, particularly in network monitoring and mobile app updates.
  • Users find limited compatibility with Pulseway, particularly regarding Microsoft Office and Linux integration issues.
  • Users find the slow performance of Pulseway frustrating, particularly during peak hours, affecting overall usability.
  • Users find the pricing very high compared to other comparable remote monitoring management solutions.
  • Users are frustrated with constant upselling and unfinished features, alongside issues with logging out and reporting quality.

What Are Recent G2 Reviews of Pulseway?

What Are G2 Users Discussing About Pulseway?

NETSCOUT Network & Application Observability

NETSCOUT’s Network & Application Observability solution is engineered for IT practitioners who need deep, real-time visibility into complex hybrid environments. Whether you're managing a sprawling data center, a multi-cloud deployment, 5G deployment, or a remote workforce, this solution delivers the actionable intelligence required to maintain performance, availability, and user experience across every layer of your infrastructure. At its core, NETSCOUT leverages Deep Packet Inspection (DPI) to convert raw network traffic into smart data. This allows IT teams to monitor application behavior, network performance, and service dependencies with precision, even in containerized environments. The result is a unified, end-to-end view that helps you quickly isolate root causes, reduce mean time to knowledge (MTTK), and proactively resolve issues before they impact users or business operations. What sets NETSCOUT apart is its ability to scale observability across both legacy and modern architectures without requiring intrusive agents or instrumentation. It integrates seamlessly with existing workflows and tools, providing consistent visibility whether you're troubleshooting a VoIP degradation, tracking down a cloud latency spike, or validating the performance of a new application rollout. For IT professionals tasked with ensuring uptime and optimizing digital experiences, NETSCOUT’s observability platform is not just a monitoring tool—it’s a strategic asset that transforms packet-level data into operational intelligence. Products included in this solution: - nGeniusONE - InfiniStreamNG - vSTREAM - Packet Flow Switches (PFS) and TAPs

Average Rating: 4.5/5.0

Total Reviews: 96

How Do G2 Users Rate NETSCOUT Network & Application Observability?

  • Has the product been a good partner in doing business?: 7.2/10 (Category avg: 8.8/10)
  • Performance Monitoring: 8.5/10 (Category avg: 8.9/10)
  • Multi-Network Capability: 7.7/10 (Category avg: 8.7/10)
  • Path Analysis: 7.1/10 (Category avg: 8.4/10)

Who Is the Company Behind NETSCOUT Network & Application Observability?

  • Seller: NETSCOUT
  • Company Website:
  • Year Founded: 1984
  • HQ Location: Westford, Mass.
  • Twitter: @NETSCOUT
    13,759 Twitter followers
  • LinkedIn® Page: www.linkedin.com
    2,710 employees on LinkedIn®

Who Uses This Product?

  • Top Industries: Telecommunications, Financial Services
  • Company Size: 38% Large, 30% Medium

What Do G2 Reviewers Say About NETSCOUT Network & Application Observability?

AI-generated summary from verified user reviews

Pros
  • Users value the comprehensive visibility NETSCOUT provides, enabling swift issue resolution and enhanced performance monitoring.
  • Users value the issue detection capabilities of NETSCOUT, enabling swift resolution of performance bottlenecks and disruptions.
  • Users value the comprehensive visibility NETSCOUT provides, enabling swift identification and resolution of performance issues.
  • Users value the reliability of NETSCOUT Network & Application Observability for proactive troubleshooting and insightful network management.
  • Users find NETSCOUT Network & Application Observability to be user-friendly, facilitating easy setup and efficient diagnosis of network issues.
Cons
  • Users face a steep learning curve with NETSCOUT, leading to implementation challenges and requiring specialized knowledge.
  • Users experience complexity in implementing NETSCOUT, facing a steep learning curve and integration challenges.
  • Users face a difficult learning curve with NETSCOUT, finding the complexity challenging to manage and comprehend.
  • Users find the complex setup challenging, requiring specialized knowledge and time for new team members to adapt.
  • Users highlight the complex configuration process and the steep learning curve for new team members, complicating implementation.

What Are Recent G2 Reviews of NETSCOUT Network & Application Observability?

Nagios XI

Nagios XI is an enterprise-grade IT infrastructure monitoring and alerting solution designed to provide comprehensive oversight of servers, networks, applications, and services. Built upon the robust Nagios Core monitoring engine, Nagios XI offers a user-friendly web interface, advanced visualization tools, and customizable dashboards, enabling IT teams to proactively identify and resolve issues before they impact business operations. Its scalable architecture supports monitoring from small environments to large-scale infrastructures with thousands of devices. Key Features and Functionality: - Comprehensive Monitoring: Nagios XI delivers full-stack monitoring capabilities, covering networks, servers, databases, and applications. It supports native cloud and virtualization platforms, including AWS, Azure, VMware, and Hyper-V. - Advanced Alerting and Reporting: The platform provides event-driven automation with multi-channel alerting options such as email, SMS, Slack, and Microsoft Teams. It includes customizable dashboards with performance graphs and capacity planning tools to aid in proactive infrastructure management. - User Management and Security: Nagios XI features role-based access control with multi-tenant capabilities, ensuring secure and efficient user management across the organization. - Flexible Deployment and Licensing: Offering hybrid deployment options, Nagios XI supports both on-premises and cloud environments. Its perpetual licensing model eliminates subscription fees, providing cost-effective monitoring solutions. Primary Value and Problem Solving: Nagios XI addresses the critical need for real-time visibility into IT infrastructures, enabling organizations to detect and resolve issues promptly, thereby minimizing downtime and maintaining optimal performance. By consolidating monitoring tools into a single platform, it reduces complexity and operational costs. The solution's proactive alerting and reporting capabilities empower IT teams to anticipate potential problems and implement corrective measures before they escalate, ensuring business continuity and enhancing overall efficiency.

Average Rating: 4.5/5.0

Total Reviews: 51

How Do G2 Users Rate Nagios XI?

  • Has the product been a good partner in doing business?: 8.2/10 (Category avg: 8.8/10)
  • Performance Monitoring: 9.5/10 (Category avg: 8.9/10)
  • Multi-Network Capability: 9.1/10 (Category avg: 8.7/10)
  • Path Analysis: 9.1/10 (Category avg: 8.4/10)

Who Is the Company Behind Nagios XI?

  • Seller: Nagios
  • Year Founded: 2007
  • HQ Location: Saint Paul, MN
  • Twitter: @nagiosinc
    5,495 Twitter followers
  • LinkedIn® Page: www.linkedin.com
    80 employees on LinkedIn®

Who Uses This Product?

  • Who Uses This: Network Engineer
  • Top Industries: Information Technology and Services, Internet
  • Company Size: 66% Medium, 24% Large

What Do G2 Reviewers Say About Nagios XI?

AI-generated summary from verified user reviews

Pros
  • Users value Nagios XI for its comprehensive monitoring, effectively handling diverse endpoints and infrastructure components.
  • Users find Nagios XI to be a cost-effective all-in-one solution that simplifies monitoring across diverse infrastructure.
  • Users value the extensive compatibility of Nagios XI, allowing seamless integration with various endpoints and protocols.
  • Users value the responsive customer support of Nagios XI, which enhances their overall monitoring experience and effectiveness.
  • Users value the intuitive dashboard features of Nagios XI for effective monitoring of various infrastructure components.
Cons
  • Users find the initial configuration complex, especially if lacking technical expertise, making setup challenging.
  • Users find the complex setup challenging, particularly for teams with limited technical expertise.
  • Users find the initial configuration challenging, particularly for teams with limited technical expertise, creating a steep learning curve.
  • Users note the expertise required for setup, which can be challenging for teams lacking technical skills.
  • Users find Nagios XI has inadequate monitoring for detailed SQL database performance insights, limiting troubleshooting capabilities.

What Are Recent G2 Reviews of Nagios XI?

What Are G2 Users Discussing About Nagios XI?

Tian Lin
TL
Researched and written by Tian Lin
Updated