Best Container Monitoring Tools - Page 2

How Many Container Monitoring Tools Products Does G2 Track?

Total Products under this Category: 68

Category Stats (Sep 2026)

  • Average Rating: 4.51/5 The average rating of products in this category, based on all submitted ratings
  • Top Trending Product: Falcon Next-Gen SIEM (+7.14%) - Among all products in this category, Falcon Next-Gen SIEM recorded the largest rating increase compared to last month

Last updated: September 29, 2026

How Does G2 Rank Container Monitoring Tools Products?

Why You Can Trust G2's Software Rankings:

  • 30 Analysts and Data Experts
  • 9,800+ Authentic Reviews
  • 68+ Products
  • Unbiased Rankings

G2's software rankings are built on verified user reviews, rigorous moderation, and a consistent research methodology maintained by a team of analysts and data experts. Each product is measured using the same transparent criteria, with no paid placement or vendor influence. While reviews reflect real user experiences, which can be subjective, they offer valuable insight into how software performs in the hands of professionals. Together, these inputs power the G2 Score, a standardized way to compare tools within every category.

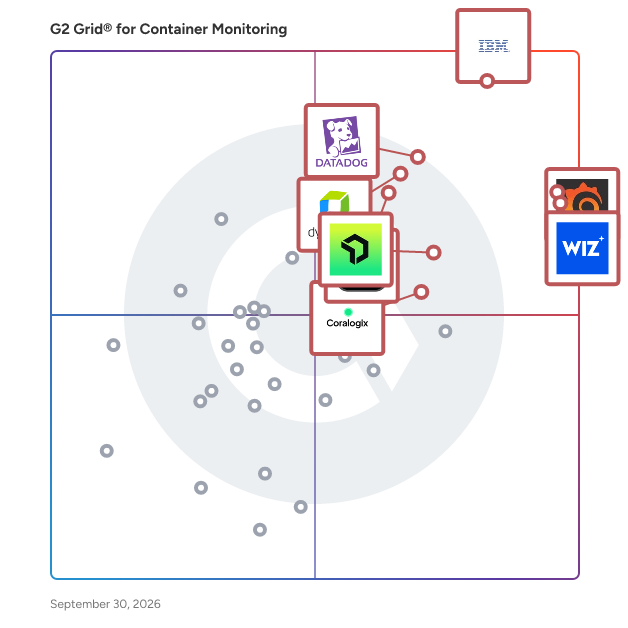
G2 Grid® for Container Monitoring Tools

G2 Grid® for Container Monitoring Tools plotting products by satisfaction and market presence

Highlighted products: IBM Instana, Grafana Labs, Wiz, Datadog, Dynatrace, Red Hat OpenShift, New Relic, and Coralogix.

Underlying data: [Grid® JSON](https://www.g2.com/categories/container-monitoring-tools/grids.json?focus%5B%5D=ibm-instana&focus%5B%5D=grafana-labs&focus%5B%5D=wiz-wiz&focus%5B%5D=datadog&focus%5B%5D=dynatrace&focus%5B%5D=red-hat-red-hat-openshift&focus%5B%5D=new-relic&focus%5B%5D=coralogix)

SolarWinds Observability

SolarWinds® Observability is a comprehensive full-stack observability solution designed to meet the diverse needs of modern organizations, regardless of their size. This solution provides deep visibility into hybrid ecosystems, enabling users to monitor and manage both on-premises and cloud environments effectively. By optimizing performance and ensuring availability across distributed hybrid IT infrastructures, SolarWinds Observability supports organizations in navigating the complexities of their IT environments. Targeted at IT professionals and organizations that require robust monitoring capabilities, SolarWinds Observability caters to a wide range of use cases. It is particularly beneficial for businesses operating in hybrid environments, where the integration of on-premises and cloud resources is essential. The solution allows users to gain a holistic view of their networks, applications, databases, and user experiences, thereby facilitating better decision-making and operational efficiency. This is especially crucial in today’s fast-paced digital landscape, where downtime can significantly impact service reliability and customer satisfaction. One of the standout features of SolarWinds Observability is its built-in intelligence powered by AIOps capabilities. This functionality accelerates issue remediation by enabling users to detect, troubleshoot, and resolve problems more efficiently. The advanced predictive analysis and anomaly-based alerts help organizations proactively address potential issues before they escalate, ultimately reducing downtime and enhancing service reliability. Additionally, the solution's log pattern analysis further streamlines the troubleshooting process, allowing IT teams to focus on strategic initiatives rather than being bogged down by operational challenges. SolarWinds Observability offers flexibility in deployment, providing users with the option to choose between self-hosted and SaaS models. The self-hosted option integrates seamlessly with other SolarWinds services, such as security and storage monitoring, while the SaaS option is tailored for deeper monitoring of custom and cloud-based applications. This adaptability ensures that organizations can select the deployment method that best aligns with their operational needs and infrastructure. Moreover, SolarWinds Observability stands out by consolidating multiple monitoring tools into a single, integrated solution. This not only simplifies the monitoring process but also helps organizations reduce costs associated with managing disparate systems. By offering comprehensive visibility across hybrid IT environments, SolarWinds Observability empowers organizations to optimize their operations and enhance overall performance.

Average Rating: 4.3/5.0

Total Reviews: 828

How Do G2 Users Rate SolarWinds Observability?

  • Has the product been a good partner in doing business?: 8.3/10 (Category avg: 9.2/10)

Who Is the Company Behind SolarWinds Observability?

  • Seller: SolarWinds Worldwide LLC
  • Company Website:
  • Year Founded: 1999
  • HQ Location: Austin, TX
  • Twitter: @solarwinds
    19,570 Twitter followers
  • LinkedIn® Page: www.linkedin.com
    2,864 employees on LinkedIn®

Who Uses This Product?

  • Who Uses This: Network Engineer, Network Administrator
  • Top Industries: Information Technology and Services, Hospital & Health Care
  • Company Size: 44% Large, 35% Medium

What Do G2 Reviewers Say About SolarWinds Observability?

AI-generated summary from verified user reviews

Pros
  • Users love the intuitive interface of SolarWinds Observability, making system management and monitoring effortless and efficient.
  • Users appreciate the comprehensive visibility of SolarWinds Observability, simplifying performance monitoring across diverse environments.
  • Users value the unified visibility across infrastructure that simplifies monitoring and accelerates troubleshooting effectively.
  • Users appreciate the monitoring capabilities of SolarWinds Observability, effectively managing and analyzing network environments.
  • Users appreciate the intuitive user interface of SolarWinds, enhancing the management and visibility of network performance.
Cons
  • Users find the pricing escalates quickly, making SolarWinds Observability less affordable for larger setups and features.
  • Users face a significant learning curve with SolarWinds Observability, complicating the use of advanced features and integrations.
  • Users face integration issues due to complex setups and limited support for ITSM platform connections, affecting usability.
  • Users find the complex setup of SolarWinds Observability challenging, requiring significant technical expertise and time investment.
  • Users find the configuration difficulty of SolarWinds Observability to be a significant hurdle in effective deployment.

What Are Recent G2 Reviews of SolarWinds Observability?

What Are G2 Users Discussing About SolarWinds Observability?

IBM Turbonomic

IBM Turbonomic, now part of the Concert platform, is a real-time application resource management platform designed to help users optimize and manage resources across hybrid and multi-cloud environments. This innovative solution continuously analyzes application performance and resource utilization, automating critical resourcing decisions to ensure optimal application performance while minimizing costs associated with cloud and infrastructure resources. IBM Turbonomic addresses the challenges of managing complex, dynamic environments. As organizations increasingly adopt hybrid and multi-cloud strategies, the need for effective resource management becomes paramount. Turbonomic provides a comprehensive approach to performance management by analyzing the entire technology stack, identifying inefficiencies, and uncovering dependencies that can impact application performance. This proactive management capability allows organizations to maintain high service levels while controlling costs. One of the key features of IBM Turbonomic is its ability to continuously adjust application resources in real time. By monitoring resource utilization and application performance, Turbonomic prevents performance degradation and overprovisioning. This dynamic adjustment ensures that applications receive the necessary resources when needed, which is crucial for maintaining optimal performance levels. Additionally, the platform automates resource decisions such as scaling and placement, allowing organizations to focus on strategic initiatives rather than manual resource management tasks. Turbonomic customers report an average 33% reduction in cloud and infrastructure waste without impacting application performance, and return-on-investment of 471% over three years. IBM Turbonomic is also available on AWS Marketplace. By leveraging Turbonomic, businesses can ensure that their applications run smoothly, resources are utilized effectively, and costs are kept in check, all while maintaining a focus on innovation and growth. For further information, please visit www.ibm.com/products/turbonomic

Average Rating: 4.4/5.0

Total Reviews: 287

How Do G2 Users Rate IBM Turbonomic?

  • Multi-mode alerts: 7.7/10 (Category avg: 8.4/10)
  • Proactive identification: 7.1/10 (Category avg: 8.6/10)
  • Automation: 7.3/10 (Category avg: 8.4/10)
  • Has the product been a good partner in doing business?: 8.9/10 (Category avg: 9.2/10)

Who Is the Company Behind IBM Turbonomic?

  • Seller: IBM
  • Year Founded: 1911
  • HQ Location: Armonk, New York, United States
  • Twitter: @IBMSecurity
    74,660 Twitter followers
  • LinkedIn® Page: www.linkedin.com
    344,328 employees on LinkedIn®
  • Ownership: SWX:IBM

Who Uses This Product?

  • Who Uses This: Software Engineer, System Engineer
  • Top Industries: Information Technology and Services, Computer Software
  • Company Size: 42% Large, 32% Medium

What Do G2 Reviewers Say About IBM Turbonomic?

AI-generated summary from verified user reviews

Pros
  • Users appreciate the intelligent cost optimization of IBM Turbonomic, effectively reducing cloud expenses while maintaining performance.
  • Users appreciate the intelligent automation of IBM Turbonomic, optimizing resources and reducing costs efficiently.
  • Users value the ease of use of IBM Turbonomic, which streamlines resource management and enhances efficiency.
  • Users appreciate the intelligent automation of IBM Turbonomic, ensuring optimal performance while reducing cloud costs and over-provisioning.
  • Users value the real-time monitoring of IBM Turbonomic, which optimizes resources effectively, enhancing performance and reducing costs.
Cons
  • Users find the complexity of setup and reporting in IBM Turbonomic challenging, impacting efficient utilization and time-to-value.
  • Users find the learning curve challenging, requiring time and better documentation for effective onboarding and setup.
  • Users face complex configuration challenges with IBM Turbonomic, leading to longer setup times and delayed value realization.
  • Users face a difficult learning curve with IBM Turbonomic, requiring time and effort to become comfortable with the tool.
  • Users find the difficult setup of IBM Turbonomic challenging, requiring significant time and effort to get accustomed.

What Are Recent G2 Reviews of IBM Turbonomic?

What Are G2 Users Discussing About IBM Turbonomic?

Rakuten SixthSense Observability

In today's digital landscape, businesses need a powerful and comprehensive Application Performance Monitoring (APM) solution to stay ahead of the curve. Introducing Rakuten SixthSense Observability - a next-generation APM tool that transforms the way you monitor, analyze, and optimize your applications and infrastructure. With its robust suite of features and advanced analytics, Rakuten SixthSense Observability empowers you to proactively identify and resolve issues, streamline operations, and enhance customer experiences. Key Capabilities: • Comprehensive Monitoring and Alerting: Rakuten SixthSense Observability offers end-to-end monitoring of your applications, infrastructure, and network performance. With real-time alerting and customizable dashboards, you can quickly detect issues and gain actionable insights into the health and performance of your systems. • Distributed Tracing and Correlation: Gain full visibility into your application's performance with distributed tracing, which tracks transactions and requests across multiple services and components. This feature helps you identify bottlenecks, latency issues, and errors, making it easier to optimize your application and enhance customer experiences. • Anomaly Detection and Machine Learning: Leverage Rakuten SixthSense's advanced machine learning capabilities to automatically identify unusual patterns and deviations in application performance and resource utilization. This proactive approach enables you to detect and resolve issues before they impact your business and customers. • Advanced Analytics and Visualization: Rakuten SixthSense's rich data visualization and analytics tools allow you to dive deep into your application performance data. Generate custom reports, analyze trends, and uncover hidden patterns that can drive continuous improvement and optimization. • Log Management and Integration: Effortlessly collect, analyze, and store logs from various sources with Rakuten SixthSense's integrated log management feature. This seamless integration enables you to correlate log data with performance metrics and traces, providing a comprehensive understanding of your application's behaviour. • Scalability and Flexibility: Rakuten SixthSense Observability is built to scale with your growing business needs, supporting a wide range of applications, services, and infrastructure. Its flexible architecture allows you to customize the tool to your specific requirements and integrate it with other monitoring and observability solutions. Current Feature set: • Application Performance Monitoring: Full stack visibility across Java, PHP, Node.js, Python, Go and a lot more! Key Features include, Distributed Tracing, Profiling, Database Monitoring • Infrastructure Monitoring: Get a birds-eye view of your infrastructure health and gain granular insights with easy deployment Key Features include Kubernetes, VMs, Web Servers, Cloud Integrations • Digital Experience Monitoring: Improve the end-user experience of your applications mapped with contextual information of application performance metrics • Browser Monitoring: Metrics to optimize end users’ experience and help in improving application performance. • Mobile Monitoring: Monitor crashes, performance & usage metrics for your mobile applications • Synthetic Monitoring: Stimulate end-user transactions using low code, no code test scripts • VM Monitoring: VM monitoring capability lets you view your infrastructure performance and health of servers, virtual machines, containers, databases etc. at a glance. • SixthSense Cognitive Engine: Modern observability and the proactive approach using artificial intelligence. The application uses different AI/ML algorithms that can predict performance metrics with an accuracy of up to 98% and a confidence level of 90%.

Average Rating: 4.6/5.0

Total Reviews: 52

How Do G2 Users Rate Rakuten SixthSense Observability?

  • Has the product been a good partner in doing business?: 9.2/10 (Category avg: 9.2/10)

Who Is the Company Behind Rakuten SixthSense Observability?

Who Uses This Product?

  • Who Uses This: Senior Software Engineer
  • Top Industries: Information Technology and Services, Computer Games
  • Company Size: 47% Large, 38% Medium

What Do G2 Reviewers Say About Rakuten SixthSense Observability?

AI-generated summary from verified user reviews

Pros
  • Users appreciate the deep visibility offered by Rakuten SixthSense, enhancing application performance and proactively managing issues.
  • Users value the effective alerting system for seamless monitoring and quick resolution of issues in one dashboard.
  • Users value the excellent customer support of Rakuten SixthSense, enhancing their overall experience and productivity.
  • Users appreciate the ease of use of Rakuten SixthSense Observability, enabling quick identification of issues without hassle.
  • Users find the implementation ease of Rakuten SixthSense Observability impressive, allowing quick access to essential monitoring tools.
Cons
  • Users find the complex setup of Rakuten SixthSense Observability requires significant onboarding effort for optimal use.
  • Users find the documentation lacking, making onboarding and setup more challenging than necessary.
  • Users often face false positive alerts and desire better functionality for error monitoring and dashboard notifications.
  • Users report experiencing inefficient alerts, citing false positives and a lack of preferred error record displays.
  • Users note that the documentation needs improvement, which impacts their ability to utilize the tool effectively.

What Are Recent G2 Reviews of Rakuten SixthSense Observability?

Netdata

Netdata is an AI-driven real-time observability platform that monitors systems, containers, applications, and infrastructure across servers, cloud environments, Kubernetes clusters, and IoT devices. With zero-configuration deployment, Netdata installs instantly, automatically discovers metrics, builds dashboards, and begins monitoring without setup. Netdata AI serves as an intelligent on-call assistant, automatically investigating alerts, correlating anomalies across thousands of metrics, identifying root causes, and explaining incidents with clear, actionable recommendations. By transforming raw telemetry into AI-guided insights, Netdata helps engineering teams move from alert to resolution in minutes instead of hours. The platform collects per-second metrics through 800+ integrations across operating systems, containers, databases, applications, OpenMetrics exporters, StatsD, and logs. Its distributed architecture processes data at the edge, enabling high-resolution monitoring and visibility into short-lived performance issues that traditional monitoring tools often miss. Netdata is available as a scalable SaaS platform with Netdata Cloud or as a private deployment within your own infrastructure, supporting on-prem, private cloud, and air-gapped environments while delivering automated dashboards, ML-based anomaly detection, and real-time troubleshooting.

Average Rating: 4.6/5.0

Total Reviews: 51

How Do G2 Users Rate Netdata?

  • Multi-mode alerts: 10.0/10 (Category avg: 8.4/10)
  • Proactive identification: 9.4/10 (Category avg: 8.6/10)
  • Automation: 10.0/10 (Category avg: 8.4/10)
  • Has the product been a good partner in doing business?: 9.4/10 (Category avg: 9.2/10)

Who Is the Company Behind Netdata?

  • Seller: Netdata
  • Year Founded: 2018
  • HQ Location: San Francisco, US
  • Twitter: @netdatahq
    4,040 Twitter followers
  • LinkedIn® Page: www.linkedin.com
    79 employees on LinkedIn®

Who Uses This Product?

  • Top Industries: Information Technology and Services, Computer Software
  • Company Size: 44% Small, 43% Medium

What Do G2 Reviewers Say About Netdata?

AI-generated summary from verified user reviews

Pros
  • Users highlight the ease of use of Netdata, praising its quick setup and intuitive dashboard for monitoring.
  • Users praise the easy setup of Netdata, experiencing quick implementation and immediate access to detailed metrics.
  • Users praise the ease of setup and detailed real-time monitoring provided by Netdata, enabling efficient system management.
  • Users value the real-time monitoring of Netdata, appreciating its detail and immediacy for swift decision-making.
  • Users find the easy installation and user-friendly dashboard of Netdata to be highly beneficial for monitoring systems.
Cons
  • Users note missing APM features and limited documentation, which affect usability and long-term data retention.
  • Users find the insufficient documentation on best practices limits their ability to fully optimize Netdata's capabilities.
  • Users note the limited compatibility with Windows and lack of integrations, impacting their monitoring experience.
  • Users find the limited functionality of Netdata frustrating, especially with scalability and third-party dependencies affecting performance.
  • Users highlight resource limitations in Netdata, struggling with data volume and scalability challenges on their systems.

What Are Recent G2 Reviews of Netdata?

Sumo Logic

Sumo Logic, Inc. unifies and analyzes enterprise data, translating it into actionable insights through one AI-powered cloud-native log analytics platform. This single source of truth enables Dev, Sec and Ops teams to simplify complexity, collaborate efficiently and accelerate data-driven decisions that drive business value. Customers around the world rely on the Sumo Logic SaaS Log Analytics Platform for trusted insights to ensure application reliability, secure and protect against modern security threats, and gain insights into their cloud infrastructures. For more information, visit: SUMOLOGIC.COM

Average Rating: 4.3/5.0

Total Reviews: 405

How Do G2 Users Rate Sumo Logic?

  • Multi-mode alerts: 7.0/10 (Category avg: 8.4/10)
  • Proactive identification: 6.8/10 (Category avg: 8.6/10)
  • Automation: 7.4/10 (Category avg: 8.4/10)
  • Has the product been a good partner in doing business?: 8.8/10 (Category avg: 9.2/10)

Who Is the Company Behind Sumo Logic?

  • Seller: Sumo Logic
  • Company Website:
  • Year Founded: 2010
  • HQ Location: Redwood City, CA
  • Twitter: @SumoLogic
    6,542 Twitter followers
  • LinkedIn® Page: www.linkedin.com
    824 employees on LinkedIn®

Who Uses This Product?

  • Who Uses This: Software Engineer, Senior Software Engineer
  • Top Industries: Information Technology and Services, Computer Software
  • Company Size: 48% Medium, 38% Large

What Do G2 Reviewers Say About Sumo Logic?

AI-generated summary from verified user reviews

Pros
  • Users highlight the ease of use in Sumo Logic, citing its simple query language and intuitive configurations.
  • Users value the ease of searching and configuring logs with Sumo Logic, enhancing their monitoring and tracing efficiency.
  • Users appreciate the Comprehensive Continuous Intelligence feature of Sumo Logic for transforming data into actionable insights quickly.
  • Users value the powerful visual insights and efficient log management capabilities of Sumo Logic for fast resolution.
  • Users value the real-time monitoring capabilities of Sumo Logic, enjoying swift insights and effective data management.
Cons
  • Users find Sumo Logic expensive, prompting concerns about whether its value justifies the high pricing.
  • Users find the difficult learning curve of Sumo Logic challenging, requiring significant time to become proficient.
  • Users face a steep learning curve with Sumo Logic, requiring significant time to master its features and query language.
  • Users face a steep learning curve with Sumo Logic, requiring significant time to master complex features and queries.
  • Users experience slow performance with Sumo Logic, facing delays in alerting and a cumbersome user interface.

What Are Recent G2 Reviews of Sumo Logic?

What Are G2 Users Discussing About Sumo Logic?

Splunk AppDynamics

Powered by Cisco, AppDynamics is on a mission to help companies see their technology through the lens of the business so they can work as one to prioritize what matters most. We’re reinventing the observability space and simplifying the challenge of digital transformation for the world’s largest enterprises. In this era of unprecedented digital growth, the AppDynamics Business Observability Platform transforms organizations faster by providing business context deep into the technology stack, aligning teams around shared priorities, and enabling technologists to act with confidence and control. AppDynamics has been recognized by Gartner as a leader in the APM market for more than eight years and was positioned highest in ‘ability to execute’ in Gartner’s 2021 Magic Quadrant Report for APM.

Average Rating: 4.3/5.0

Total Reviews: 335

How Do G2 Users Rate Splunk AppDynamics?

  • Multi-mode alerts: 8.9/10 (Category avg: 8.4/10)
  • Proactive identification: 10.0/10 (Category avg: 8.6/10)
  • Automation: 8.9/10 (Category avg: 8.4/10)
  • Has the product been a good partner in doing business?: 8.5/10 (Category avg: 9.2/10)

Who Is the Company Behind Splunk AppDynamics?

  • Seller: Cisco
  • Year Founded: 1984
  • HQ Location: San Jose, CA
  • Twitter: @Cisco
    720,366 Twitter followers
  • LinkedIn® Page: www.linkedin.com
    95,294 employees on LinkedIn®
  • Ownership: NASDAQ:CSCO

Who Uses This Product?

  • Who Uses This: Senior Software Engineer, Software Engineer
  • Top Industries: Information Technology and Services, Computer Software
  • Company Size: 58% Large, 35% Medium

What Do G2 Reviewers Say About Splunk AppDynamics?

AI-generated summary from verified user reviews

Pros
  • Users value the automation capabilities of AppDynamics, facilitating seamless integration with essential ITSM tools.
  • Users value the seamless integration capabilities of AppDynamics with multi-cloud environments and ITSM tools like ServiceNow.
  • Users find the ease of integration with tools like ServiceNow enhances their AppDynamics experience significantly.
  • Users value the easy integration with ITSM tools like ServiceNow, enhancing their AppDynamics experience.
  • Users appreciate the easy integrations with downstream products like ITSM tools, enhancing the overall monitoring experience.
Cons
  • Users face billing issues such as high renewal costs and delayed support following the Cisco acquisition.
  • Users find the high renewal costs and slow updates frustrating after Cisco's acquisition of AppDynamics.
  • Users express frustration over the inefficient alert system, impacting timely responses and overall product effectiveness.
  • Users report poor customer support, citing delays in assistance and lengthy timelines for product enhancements after the acquisition.
  • Users face pricing issues with Splunk AppDynamics, citing high renewal costs and slow support responses post-acquisition.

What Are Recent G2 Reviews of Splunk AppDynamics?

What Are G2 Users Discussing About Splunk AppDynamics?

Sysdig Monitor

Sysdig Monitor radically simplifies cloud and Kubernetes monitoring with deep visibility into container and Kubernetes workloads along with a managed Prometheus service. You get immediate, granular details and troubleshooting tools for rapidly changing container environments. Unlike other vendors who provide limited Kubernetes detail, Sysdig displays all important information in a single unified view with actionable remediation steps. Your team can remove silos by unifying monitoring for hybrid and multi-cloud environments. Offload the maintenance of Prometheus servers and get a fully compatible managed service with long-term storage, automatic service detection, out-of-the-box dashboards/alerts, and curated exporters for integrations. If you need custom metrics, Sysdig Monitor can provide more data from your application environments at a lower cost. Sysdig Monitor provides teams with: - Kubernetes monitoring and troubleshooting - Managed service for Prometheus - Cloud infrastructure monitoring - Cloud Costs Optimization - Custom Metrics - VM and Host monitoring

Average Rating: 4.6/5.0

Total Reviews: 40

How Do G2 Users Rate Sysdig Monitor?

  • Multi-mode alerts: 10.0/10 (Category avg: 8.4/10)
  • Proactive identification: 10.0/10 (Category avg: 8.6/10)
  • Automation: 10.0/10 (Category avg: 8.4/10)
  • Has the product been a good partner in doing business?: 9.4/10 (Category avg: 9.2/10)

Who Is the Company Behind Sysdig Monitor?

  • Seller: Sysdig
  • Year Founded: 2013
  • HQ Location: San Francisco, California
  • Twitter: @Sysdig
    10,284 Twitter followers
  • LinkedIn® Page: www.linkedin.com
    562 employees on LinkedIn®

Who Uses This Product?

  • Top Industries: Computer Software, Information Technology and Services
  • Company Size: 40% Medium, 38% Large

What Do G2 Reviewers Say About Sysdig Monitor?

AI-generated summary from verified user reviews

Pros
  • Users value the seamless integration and deep visibility of Sysdig Monitor, enhancing cloud-native monitoring and troubleshooting.
  • Users value the seamless integration with Kubernetes, enhancing monitoring and troubleshooting across cloud-native environments effortlessly.
  • Users benefit from deep visibility into Kubernetes and containers, enhancing monitoring and troubleshooting in cloud-native environments.
  • Users appreciate the seamless deployment process of Sysdig Monitor, making cloud-native stack monitoring effortlessly efficient.
  • Users value the actionable insights and deep visibility offered by Sysdig Monitor for effortless cloud-native stack management.
Cons
  • Users find the pricing structure expensive, making it less suitable for smaller teams or specific use cases.
  • Users find the interface overwhelming and the pricing structure not cost-effective for smaller teams.
  • Users find the poor UI of Sysdig Monitor overwhelming, making navigation and usability challenging.
  • Users find the pricing structure of Sysdig Monitor to be not cost-effective for smaller teams or specific use cases.

What Are Recent G2 Reviews of Sysdig Monitor?

Prometheus

Prometheus is an open-source systems monitoring and alerting toolkit designed for reliability and scalability. It collects and stores metrics as time series data, enabling real-time monitoring of applications, systems, and services. With its powerful query language, PromQL, users can analyze and visualize data effectively. Prometheus operates independently, requiring no external dependencies, and integrates seamlessly with various service discovery mechanisms, making it ideal for dynamic environments. Key Features and Functionality: - Dimensional Data Model: Prometheus organizes time series data using a flexible dimensional model, identifying each series by a metric name and a set of key-value pairs. - Powerful Query Language (PromQL): PromQL allows users to query, correlate, and transform time series data for visualizations, alerts, and more. - Precise Alerting: Alerting rules based on PromQL leverage the dimensional data model, with a separate Alertmanager component handling notifications and silencing. - Simple Operation: Prometheus servers function independently, relying solely on local storage. Developed in Go, the statically linked binaries are easy to deploy across various environments. - Instrumentation Libraries: A wide range of official and community-contributed libraries are available for instrumenting applications in most major programming languages. - Ubiquitous Integrations: Prometheus offers numerous integrations, facilitating easy extraction of metrics from existing systems. Primary Value and Problem Solved: Prometheus addresses the need for a robust, scalable, and flexible monitoring solution in modern, dynamic environments. Its ability to collect, store, and query time series data empowers organizations to gain real-time insights into their systems' performance and health. By providing precise alerting and seamless integration with various service discovery mechanisms, Prometheus ensures that issues are detected and addressed promptly, enhancing system reliability and operational efficiency.

Average Rating: 4.5/5.0

Total Reviews: 60

How Do G2 Users Rate Prometheus?

  • Multi-mode alerts: 7.8/10 (Category avg: 8.4/10)
  • Proactive identification: 7.7/10 (Category avg: 8.6/10)
  • Automation: 8.6/10 (Category avg: 8.4/10)
  • Has the product been a good partner in doing business?: 8.7/10 (Category avg: 9.2/10)

Who Is the Company Behind Prometheus?

  • Seller: Prometheus Authors
  • Year Founded: 1998
  • HQ Location: Raleigh, North Carolina, United States
  • Twitter: @PrometheusIO
    51,776 Twitter followers
  • LinkedIn® Page: www.linkedin.com
    1,142 employees on LinkedIn®

Who Uses This Product?

  • Who Uses This: DevOps Engineer, Software Engineer
  • Top Industries: Computer Software, Information Technology and Services
  • Company Size: 41% Medium, 33% Small

What Do G2 Reviewers Say About Prometheus?

AI-generated summary from verified user reviews

Pros
  • Users appreciate the easy integrations of Prometheus, finding it user-friendly and efficient for monitoring applications.
  • Users value the powerful alerting system of Prometheus, appreciating its efficiency and ease of setup.
  • Users praise the easy integrations of Prometheus with tools like Grafana and Slack, enhancing their monitoring experience.
  • Users appreciate the efficient real-time monitoring of Prometheus, praising its seamless integration and ease of use.
  • Users value the real-time monitoring capabilities of Prometheus, appreciating its efficiency and powerful integrations.
Cons
  • Users find the learning curve steep for mastering PromQL, especially those new to time-series databases.
  • Users find the difficult learning curve of Prometheus, especially with PromQL, challenging for newcomers to master.
  • Users find the difficult installation of Prometheus challenging, particularly lacking technical expertise to set up advanced features.
  • Users find that without Grafana, graph visualization in Prometheus makes data interpretation challenging and less accessible.
  • Users find the alerting features ineffective, suggesting that improvements could enhance usability and functionality.

What Are Recent G2 Reviews of Prometheus?

What Are G2 Users Discussing About Prometheus?

LogicMonitor

LogicMonitor is an AI-first observability platform that helps enterprises protect revenue, brand reputation, and customer experience in a digital-first world. As every customer interaction depends on application and infrastructure performance, downtime is more than an IT issue—it is a business risk. LogicMonitor eliminates blind spots across cloud, infrastructure, applications, and the Internet, giving IT teams unified visibility from user experience to code-level performance. With AI-powered insights, intelligent alerting, and automation, LogicMonitor helps organizations detect, prioritize, and prevent issues before they impact customers. By enabling teams to move from reactive incident response to autonomous IT operations, LogicMonitor helps modern enterprises reduce disruption, operate efficiently at scale, and keep digital services performing reliably. For more information, visit  www.logicmonitor.com and our blog, or follow us on LinkedIn, X, Facebook, and YouTube.

Average Rating: 4.5/5.0

Total Reviews: 586

How Do G2 Users Rate LogicMonitor?

  • Multi-mode alerts: 8.7/10 (Category avg: 8.4/10)
  • Proactive identification: 8.3/10 (Category avg: 8.6/10)
  • Automation: 7.9/10 (Category avg: 8.4/10)
  • Has the product been a good partner in doing business?: 9.0/10 (Category avg: 9.2/10)

Who Is the Company Behind LogicMonitor?

  • Seller: LogicMonitor
  • Company Website:
  • Year Founded: 2007
  • HQ Location: Santa Barbara, CA
  • Twitter: @logicmonitor
    12,430 Twitter followers
  • LinkedIn® Page: www.linkedin.com
    1,258 employees on LinkedIn®

Who Uses This Product?

  • Who Uses This: Infrastructure Manager, IT Manager
  • Top Industries: Information Technology and Services, Computer Software
  • Company Size: 52% Medium, 30% Large

What Do G2 Reviewers Say About LogicMonitor?

AI-generated summary from verified user reviews

Pros
  • Users value the ease of use in LogicMonitor, benefiting from its intuitive navigation and simple management features.
  • Users praise the implementation ease of LogicMonitor, appreciating its fast setup and intuitive platform navigation.
  • Users value the broad range of monitoring features in LogicMonitor, enhancing both infrastructure and application oversight.
  • Users value the comprehensive monitoring of LogicMonitor, providing deep insights into applications and infrastructure effortlessly.
  • Users commend the excellent customer support of LogicMonitor, facilitating enhanced monitoring and problem management effortlessly.
Cons
  • Users find the steep learning curve challenging due to the need for advanced skills and internet reliance.
  • Users note limited features, facing challenges like integrations, training needs, and an expensive licensing model.
  • Users find LogicMonitor to be expensive, especially for small teams without a free tier or affordable licenses.
  • Users find the inadequate monitoring capabilities of LogicMonitor frustrating, especially with traditional server workloads and configuration demands.
  • Users find the complexity of integrations and setup challenging, often requiring external tools and training for effective use.

What Are Recent G2 Reviews of LogicMonitor?

What Are G2 Users Discussing About LogicMonitor?

Chronosphere

Chronosphere is the only observability platform that puts you back in control by taming rampant data growth and cloud-native complexity, delivering increased business confidence. Chronosphere is an efficient, reliable and flexible SaaS solution, built for scaling cloud-native engineering organizations. Teams at startups to well-known global brands in the Fortune 500 around the world trust Chronosphere to help them operate scalable, highly available, and resilient applications. The Chronosphere platform can ingest metrics and distributed trace data in a variety of open source formats, allowing you to leverage existing observability investments for greater speed and flexibility.

Average Rating: 4.5/5.0

Total Reviews: 20

How Do G2 Users Rate Chronosphere?

  • Multi-mode alerts: 10.0/10 (Category avg: 8.4/10)
  • Proactive identification: 10.0/10 (Category avg: 8.6/10)
  • Automation: 10.0/10 (Category avg: 8.4/10)
  • Has the product been a good partner in doing business?: 9.8/10 (Category avg: 9.2/10)

Who Is the Company Behind Chronosphere?

  • Seller: Palo Alto Networks
  • Year Founded: 2005
  • HQ Location: Santa Clara, CA
  • Twitter: @PaloAltoNtwks
    128,951 Twitter followers
  • LinkedIn® Page: www.linkedin.com
    23,492 employees on LinkedIn®
  • Ownership: NYSE: PANW

Who Uses This Product?

  • Top Industries: Financial Services
  • Company Size: 65% Large, 25% Medium

What Are Recent G2 Reviews of Chronosphere?

Middleware

Middleware is a full-stack observability platform designed to help users monitor and debug their applications by consolidating all metrics, logs, and traces into a single unified timeline. This solution is particularly beneficial for developers and DevOps teams, as it allows them to identify root causes of issues and resolve them in real time. By breaking down data silos, Middleware enhances visibility across various components of an application, ultimately leading to reduced downtime and improved user experiences. The target audience for Middleware includes businesses of all sizes, from startups to large enterprises, that rely on complex software infrastructures. These organizations often face challenges in monitoring their applications effectively, especially when dealing with multiple data sources. Middleware addresses these challenges by providing a comprehensive suite of monitoring tools that cater to diverse use cases. For instance, teams can leverage log monitoring to track application performance, while real-time monitoring capabilities ensure that any anomalies are detected and addressed promptly. Key features of Middleware include log monitoring, application performance management (APM), infrastructure monitoring, and synthetic monitoring. The unified dashboard is a standout feature, allowing users to view all relevant data—metrics, logs, and traces—consolidated in one place. This holistic view simplifies the debugging process, enabling teams to quickly pinpoint issues and implement solutions. Additionally, Middleware offers alerting and notification functionalities that keep users informed of critical events, ensuring that they can respond to potential problems before they escalate. Root-cause analysis is another essential aspect of Middleware, empowering teams to investigate and understand the underlying factors contributing to application issues. This feature not only aids in immediate problem resolution but also helps in preventing similar issues from arising in the future. Furthermore, the integration of LLM observability enhances the platform's capabilities, providing deeper insights into application behavior and performance. Overall, Middleware stands out in the observability landscape by offering a comprehensive, user-friendly platform that integrates various monitoring tools into a cohesive experience. Its focus on real-time insights and root-cause analysis makes it a valuable asset for organizations looking to optimize their software performance and enhance user satisfaction.

Average Rating: 4.7/5.0

Total Reviews: 55

How Do G2 Users Rate Middleware?

  • Multi-mode alerts: 9.2/10 (Category avg: 8.4/10)
  • Proactive identification: 8.6/10 (Category avg: 8.6/10)
  • Automation: 9.2/10 (Category avg: 8.4/10)
  • Has the product been a good partner in doing business?: 9.2/10 (Category avg: 9.2/10)

Who Is the Company Behind Middleware?

  • Seller: Middleware
  • Company Website:
  • Year Founded: 2014
  • HQ Location: San Francisco, California
  • Twitter: @middleware_labs
    301 Twitter followers
  • LinkedIn® Page: linkedin.com
    50 employees on LinkedIn®

Who Uses This Product?

  • Top Industries: Computer Software, Information Technology and Services
  • Company Size: 71% Small, 16% Large

What Do G2 Reviewers Say About Middleware?

AI-generated summary from verified user reviews

Pros
  • Users value the unified, real-time monitoring of Middleware, streamlining issue resolution across diverse environments efficiently.
  • Users appreciate the ease of use of Middleware, with a modern UI that simplifies onboarding and daily workflows.
  • Users value the real-time monitoring capabilities of Middleware, enhancing issue resolution and overall operational efficiency.
  • Users value the unified, real-time dashboard of Middleware, enabling fast diagnostics across diverse environments effortlessly.
  • Users commend the easy setup of Middleware, simplifying integration and enhancing efficiency in DevOps workflows.
Cons
  • Users face integration issues requiring additional configuration, especially with advanced features and legacy systems.
  • Users find the configuration complexity initially challenging, particularly with advanced options and integrations, causing a steep learning curve.
  • Users find the steep learning curve of Middleware challenging, especially for those new to APM concepts and integrations.
  • Users experience a slight learning curve with Middleware, particularly affecting those new to advanced observability tools.
  • Users find the complex setup of Middleware challenging, especially due to manual configurations and a steep learning curve.

What Are Recent G2 Reviews of Middleware?

Honeycomb

Honeycomb is the observability platform that enables engineering teams to find and solve problems they couldn't before. Honeycomb’s approach is fundamentally different from other tools that claim observability, and is built to help teams answer novel questions about their ever-evolving cloud applications. Honeycomb is a modern observability platform built to help engineering teams quickly find and fix issues, including the ones they didn’t know to look for. Teams use Honeycomb to understand how their systems behave in production, get full context around every request, and resolve problems before customers notice. Where traditional tools separate logs, metrics, and traces, Honeycomb combines all telemetry into a single, unified event model. This enables fast, interactive querying across high-cardinality and high-dimensional data, so engineers can ask new questions without hitting limits or waiting minutes for results. Powered by a trace-first data store and designed for real-time exploration, Honeycomb makes it easy to pinpoint what’s broken, why it’s happening, and who is affected. It’s observability designed for modern, complex systems—simple to adopt, fast to query, and built to scale.

Average Rating: 4.5/5.0

Total Reviews: 36

How Do G2 Users Rate Honeycomb?

  • Has the product been a good partner in doing business?: 9.3/10 (Category avg: 9.2/10)

Who Is the Company Behind Honeycomb?

  • Seller: Honeycomb.io
  • Company Website:
  • Year Founded: 2016
  • HQ Location: San Francisco, US
  • Twitter: @honeycombio
    14,830 Twitter followers
  • LinkedIn® Page: www.linkedin.com
    296 employees on LinkedIn®

Who Uses This Product?

  • Top Industries: Information Technology and Services, Computer Software
  • Company Size: 49% Medium, 41% Large

What Do G2 Reviewers Say About Honeycomb?

AI-generated summary from verified user reviews

Pros
  • Users find Honeycomb easy to use, enhancing system monitoring and alerting with intuitive visuals and extensive support.
  • Users value the efficient data insights provided by Honeycomb, enhancing their understanding of production systems significantly.
  • Users commend the efficiency of analytics in Honeycomb, transforming data understanding and enhancing production system insights.
  • Users commend the exceptional customer support of Honeycomb, fostering confidence and effective implementation for improved observability.
  • Users value the flexibility of Honeycomb, expertly handling arbitrary data for both prototyping and production systems.
Cons
  • Users find the difficult learning curve due to poor documentation and the need for self-learning, especially for beginners.
  • Users find Honeycomb expensive, but acknowledge that the value justifies the cost for application observability.
  • Users find the learning curve steep due to challenging documentation and the need for self-learning and external tools.
  • Users find the learning difficulty with Honeycomb frustrating due to unclear documentation and a steep learning curve.
  • Users face limitations in tracking payloads and history duration, necessitating supplementary tools for comprehensive analytics.

What Are Recent G2 Reviews of Honeycomb?

Centreon Infra Monitoring

Centreon is a comprehensive IT monitoring solution designed to help organizations gain full visibility and control over their IT operations. By providing real-time insights into system performance, network health, and application availability, Centreon enables businesses to proactively manage their IT environments, ensuring uninterrupted operations and optimal resource utilization. Targeted primarily at IT departments and operations teams, Centreon serves a diverse range of industries, from small businesses to large enterprises. Its user-friendly interface and customizable dashboards make it accessible for both technical and non-technical users. This versatility allows organizations to tailor the monitoring experience to their specific needs, making it an invaluable tool for maintaining operational efficiency and enhancing service delivery. One of the key use cases for Centreon is its ability to prevent downtime through proactive issue detection. By continuously monitoring critical systems and applications, Centreon alerts IT teams to potential problems before they escalate into significant outages. This proactive approach minimizes disruptions and helps organizations maintain a reliable IT infrastructure, which is essential for meeting business demands and ensuring customer satisfaction. Centreon also emphasizes resource optimization, allowing businesses to maximize efficiency and reduce IT costs. By providing detailed insights into resource utilization, organizations can identify underperforming assets and make informed decisions about capacity planning and resource allocation. This capability enables businesses to streamline their IT operations, ultimately leading to cost savings and improved performance. In addition, Centreon enhances the user experience by delivering consistent, high-quality IT services. With its comprehensive monitoring capabilities, IT teams can ensure that applications and services are running smoothly, providing end-users with the reliable performance they expect. This focus on user experience fosters customer loyalty and supports overall business success by aligning IT services with organizational goals. Centreon distinguishes itself in the IT monitoring category by combining powerful monitoring features with a user-centric approach. Its ability to deliver actionable insights, prevent downtime, optimize resources, and enhance user experience makes it a vital tool for organizations looking to improve their IT operations and achieve business success.

Average Rating: 4.6/5.0

Total Reviews: 89

How Do G2 Users Rate Centreon Infra Monitoring?

  • Multi-mode alerts: 7.7/10 (Category avg: 8.4/10)
  • Proactive identification: 10.0/10 (Category avg: 8.6/10)
  • Automation: 10.0/10 (Category avg: 8.4/10)
  • Has the product been a good partner in doing business?: 8.1/10 (Category avg: 9.2/10)

Who Is the Company Behind Centreon Infra Monitoring?

  • Seller: Centreon
  • Company Website:
  • Year Founded: 2005
  • HQ Location: Paris, France
  • Twitter: @Centreon
    697 Twitter followers
  • LinkedIn® Page: www.linkedin.com
    154 employees on LinkedIn®

Who Uses This Product?

  • Who Uses This: Network Engineer
  • Top Industries: Information Technology and Services, Internet
  • Company Size: 63% Medium, 25% Large

What Do G2 Reviewers Say About Centreon Infra Monitoring?

AI-generated summary from verified user reviews

Pros
  • Users appreciate the ease of use of Centreon Infra Monitoring, enjoying its flexibility and organized monitoring experience.
  • Users appreciate the ease of centralized monitoring with Centreon, enjoying a clear view of their entire infrastructure.
  • Users value the centralized monitoring capabilities of Centreon, providing a clear and organized view of their infrastructure.
  • Users value the real-time monitoring capabilities of Centreon, enhancing their ability to oversee diverse infrastructure seamlessly.
  • Users appreciate the flexible integrations of Centreon Infra Monitoring, seamlessly connecting with various tools and devices.
Cons
  • Users find the complex configuration process challenging, especially during setup and integration with other tools.
  • Users find Centreon Infra Monitoring to have a not user-friendly interface, complicating setup and upgrades significantly.
  • Users find the complex setup of Centreon Infra Monitoring time-consuming and challenging, particularly for newcomers.
  • Users find the difficult learning curve of Centreon Infra Monitoring challenging, particularly during setup and upgrades.
  • Users find the learning curve steep, particularly during setup and upgrades, requiring significant technical effort.

What Are Recent G2 Reviews of Centreon Infra Monitoring?

What Are G2 Users Discussing About Centreon Infra Monitoring?

SquaredUp

SquaredUp is a unified observability portal. Say goodbye to blind spots and data silos. Using data mesh and cutting-edge data visualization, SquaredUp gives IT and engineering teams one place to see everything that matters. Bring together data from across your tech stack without the headache of moving the data. Unlike other monitoring and observability tools that rely on a data warehouse, SquaredUp leaves your data where it is, plugging directly into each data source to index and stitch the data together using a data mesh. Teams have one place to go where they can search, visualize, and analyze data across all their tools. Take control of infrastructure, application, and product performance with unified visibility. Learn more at squaredup.com What you get: > Cutting-edge data visualization > Access to 100+ data sources > Any custom data source via Web API > Multi-cloud observability > Cost monitoring > Unlimited dashboards > Unlimited monitors Key features: > Out-of-box dashboards > Simple, flexible dashboard designer > Real-time monitoring > High-level roll-up views > Object drill downs > Notifications (Slack, Teams, email, etc.) > SQL analytics Free for up to 3 users. Head over to SquaredUp - The Unified Observability Portal to learn more >>> https://squaredup.com/ We also have a dedicated SCOM product, Dashboard Server for SCOM. See our product page to learn how we help to transform SCOM with end-to-end visibility >>> https://ds.squaredup.com/ To find out what plan is best for you, go to >>> https://squaredup.com/pricing/

Average Rating: 4.9/5.0

Total Reviews: 15

How Do G2 Users Rate SquaredUp?

  • Multi-mode alerts: 10.0/10 (Category avg: 8.4/10)
  • Proactive identification: 10.0/10 (Category avg: 8.6/10)
  • Automation: 10.0/10 (Category avg: 8.4/10)
  • Has the product been a good partner in doing business?: 10.0/10 (Category avg: 9.2/10)

Who Is the Company Behind SquaredUp?

  • Seller: SquaredUp
  • Year Founded: 2011
  • HQ Location: Maidenhead, GB
  • Twitter: @squared_up
    1,170 Twitter followers
  • LinkedIn® Page: www.linkedin.com
    80 employees on LinkedIn®

Who Uses This Product?

  • Company Size: 60% Large, 33% Medium

What Do G2 Reviewers Say About SquaredUp?

AI-generated summary from verified user reviews

Pros
  • Users appreciate the easy dashboard customization in SquaredUp, enhancing their ability to visualize system performance effortlessly.
  • Users value the ease of visualization in SquaredUp, enhancing clarity and reducing stress in monitoring systems.
  • Users appreciate the interactive dashboard quality of SquaredUp, making it easy to visualize system data effectively.
  • Users appreciate the interactive dashboards of SquaredUp for their clarity and ease of use across systems.
  • Users appreciate the easy-to-use interactive dashboards of SquaredUp, enhancing visibility and simplifying system monitoring.
Cons
  • Users face a noticeable learning curve and prolonged setup times with SquaredUp, impacting initial user experience.
  • Users note a complex setup process for integrations and visualizations, requiring time and patience to master.
  • Users find the configuration difficulty of SquaredUp can be time-consuming and requires a steep learning curve.
  • Users report a difficult configuration process with SquaredUp, requiring patience and time for custom setups and integrations.
  • Users experience a noticeable learning curve when trying to fully utilize SquaredUp's features, requiring extra patience.

What Are Recent G2 Reviews of SquaredUp?

What Are G2 Users Discussing About SquaredUp?

Sematext Cloud

Sematext Cloud is an innovative, unified platform with all-in-one solutions for infrastructure monitoring, application performance monitoring, log management, real user monitoring, and synthetic monitoring to provide unified, real-time observability of your entire technology stack. It's used by organizations of all sizes and across a wide range of industries, with the goal of driving collaboration between engineering and business teams, reduce the time of root-cause-analysis, understand user behavior and track key business metrics.

Average Rating: 4.7/5.0

Total Reviews: 38

How Do G2 Users Rate Sematext Cloud?

  • Multi-mode alerts: 5.0/10 (Category avg: 8.4/10)
  • Proactive identification: 6.7/10 (Category avg: 8.6/10)
  • Automation: 5.0/10 (Category avg: 8.4/10)
  • Has the product been a good partner in doing business?: 9.5/10 (Category avg: 9.2/10)

Who Is the Company Behind Sematext Cloud?

  • Seller: Sematext
  • Year Founded: 2007
  • HQ Location: Brooklyn, NY
  • Twitter: @sematext
    3,758 Twitter followers
  • LinkedIn® Page: www.linkedin.com
    16 employees on LinkedIn®

Who Uses This Product?

  • Top Industries: Information Technology and Services
  • Company Size: 47% Medium, 45% Small

What Are Recent G2 Reviews of Sematext Cloud?

What Are G2 Users Discussing About Sematext Cloud?

Adam Crivello
AC
Researched and written by Adam Crivello
Updated October 3, 2024