Best Observability Software - Page 2

How Many Observability Software Products Does G2 Track?

Total Products under this Category: 134

Category Stats (Sep 2026)

  • Average Rating: 4.56/5 (↑0.01 vs Aug 2026) The average rating of products in this category, based on all submitted ratings
  • Top Trending Product: Honeycomb (+0.62%) - Among all products in this category, Honeycomb recorded the largest rating increase compared to last month

Last updated: September 05, 2026

How Does G2 Rank Observability Software Products?

Why You Can Trust G2's Software Rankings:

  • 30 Analysts and Data Experts
  • 17,700+ Authentic Reviews
  • 134+ Products
  • Unbiased Rankings

G2's software rankings are built on verified user reviews, rigorous moderation, and a consistent research methodology maintained by a team of analysts and data experts. Each product is measured using the same transparent criteria, with no paid placement or vendor influence. While reviews reflect real user experiences, which can be subjective, they offer valuable insight into how software performs in the hands of professionals. Together, these inputs power the G2 Score, a standardized way to compare tools within every category.

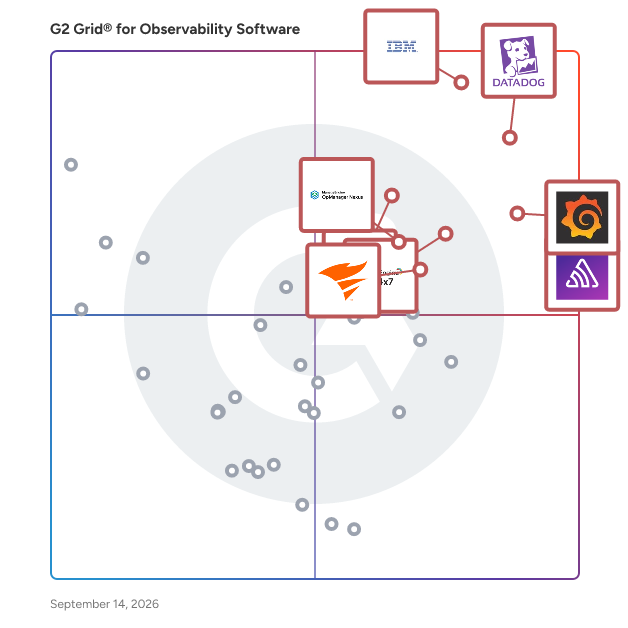
G2 Grid® for Observability Software

G2 Grid® for Observability Software plotting products by satisfaction and market presence

Highlighted products: IBM Instana, Datadog, Sentry, Grafana Labs, Site24x7, Dynatrace, OpManager Nexus, and SolarWinds Observability.

Underlying data: [Grid® JSON](https://www.g2.com/categories/observability-software/grids.json?focus%5B%5D=ibm-instana&focus%5B%5D=datadog&focus%5B%5D=sentry&focus%5B%5D=grafana-labs&focus%5B%5D=site24x7&focus%5B%5D=dynatrace&focus%5B%5D=opmanager-nexus&focus%5B%5D=solarwinds-worldwide-llc-solarwinds-observability)

Coralogix

Coralogix is a modern, full-stack observability platform transforming how businesses process and understand their data. Our unique architecture powers in-stream analytics without reliance on indexing or hot storage. We specialize in comprehensive monitoring of logs, metrics, trace and security events, enhancing operational efficiency and reducing total cost of ownership by up to 70%. Coralogix stands out for its simple pricing model, based solely on data volume ingested and retained, and offers free, fast customer support with less than 30 second response time and 1 hour resolution time. Our platform covers the entire range of observability with features such as APM, RUM, SIEM, Kubernetes monitoring and more, all streamlined for quick integration and immediate value. Components within the stream store the system state to provide stateful insights and real-time alerting without ever needing to index the data — so there are never any trade-offs to achieve observability. Once ingested, parsed, and enriched, data is written remotely to an archive bucket controlled by the client. The archive can be queried directly at any time, from the platform UI or via CLI, giving users infinite retention with full control over, and access to, their data. View and query your data from any dashboard using any syntax. Coralogix has successfully completed relevant security and privacy compliances by BDO including GDPR, SOC 2, PCI, HIPAA, and ISO 27001/27701.

Average Rating: 4.6/5.0

Total Reviews: 339

Who Is the Company Behind Coralogix?

  • Seller: Coralogix
  • Company Website:
  • Year Founded: 2014
  • HQ Location: San Francisco, CA
  • Twitter: @Coralogix
    4,102 Twitter followers
  • LinkedIn® Page: www.linkedin.com
    591 employees on LinkedIn®

Who Uses This Product?

  • Who Uses This: Software Engineer, DevOps Engineer
  • Top Industries: Computer Software, Information Technology and Services
  • Company Size: 53% Medium, 34% Large

What Do G2 Reviewers Say About Coralogix?

AI-generated summary from verified user reviews

Pros
  • Users appreciate the ease of use of Coralogix, highlighting its simple setup and efficient integrations.
  • Users value the integration of logs, metrics, and alerts, enhancing efficiency in root-cause analysis and monitoring.
  • Users commend the exceptional customer support of Coralogix, ensuring quick resolutions and a smooth experience.
  • Users value the real-time monitoring of Coralogix, enhancing their understanding of user behavior and improving incident response.
  • Users value the intuitive user interface of Coralogix, appreciating its ease of log searching and export functionality.
Cons
  • Users find that the learning curve is steep for beginners, making navigation and understanding features challenging.
  • Users find the learning difficulty of Coralogix challenging, especially when navigating advanced features and the overwhelming UI.
  • Users experience slow performance with Coralogix, leading to frustration due to delayed log fetching and UI loading.
  • Users find the difficult learning curve of Coralogix challenging, especially for beginners navigating complex options.
  • Users find the missing feature for downloading log results a significant limitation in Coralogix's functionality.

What Are Recent G2 Reviews of Coralogix?

ManageEngine Applications Manager

ManageEngine Applications Manager is an application performance & IT infrastructure monitoring solution that is designed to combat modern infrastructure problems and ensure that your business and end users are unaffected by substandard performance and downtime. By leveraging deep application performance monitoring with byte-code instrumentation, infrastructure monitoring, hybrid cloud monitoring, and digital experience monitoring from a single console, IT and DevOps teams will be able to gain code-level insights, automate their processes, pinpoint & resolve performance issues, and deliver better business outcomes. Overall, our product will help businesses optimize application usage & revenue, reduce MTTR, improve DevOps processes, migrate to the cloud with confidence, respond to incidents faster, and ensure seamless user experiences.

Average Rating: 4.7/5.0

Total Reviews: 111

Who Is the Company Behind ManageEngine Applications Manager?

  • Seller: Zoho
  • Year Founded: 1996
  • HQ Location: Austin, TX
  • Twitter: @Zoho
    137,880 Twitter followers
  • LinkedIn® Page: www.linkedin.com
    30,913 employees on LinkedIn®
  • Phone: +1 (888) 900-9646

Who Uses This Product?

  • Top Industries: Information Technology and Services, Computer Software
  • Company Size: 46% Medium, 42% Large

What Do G2 Reviewers Say About ManageEngine Applications Manager?

AI-generated summary from verified user reviews

Pros
  • Users appreciate the real-time monitoring capabilities of ManageEngine Applications Manager, enhancing visibility and troubleshooting efficiency.
  • Users value the real-time monitoring capabilities of ManageEngine Applications Manager, enhancing troubleshooting and application health visibility.
  • Users value the real-time monitoring features of ManageEngine Applications Manager for proactive issue resolution and performance tracking.
  • Users value the real-time monitoring capabilities of ManageEngine Applications Manager, enhancing their ability to troubleshoot proactively.
  • Users value the real-time visibility in ManageEngine Applications Manager, enabling proactive issue resolution and performance monitoring.
Cons
  • Users experience limited features that hinder integration and scalability, making it hard to monitor efficiently.
  • Users face feature limitations in ManageEngine Applications Manager, impacting integration and scalability for large enterprises.
  • Users face integration issues that hinder scalability and complicate monitoring across diverse applications in large environments.
  • Users find the learning curve steep for ManageEngine Applications Manager, complicating setup and utilization of advanced features.
  • Users find the initial setup complexity to be time-consuming and challenging, especially in larger environments.

What Are Recent G2 Reviews of ManageEngine Applications Manager?

What Are G2 Users Discussing About ManageEngine Applications Manager?

Last9

Last9 is the preferred single pane of observability for Logs, Traces, Metrics, built for modern engineering teams and high cardinality environments. — OpenTelemetry native, Cloud Native and Prometheus compatible, with support for 100+ integrations — Simple pricing model with a predictable “pay for what you use” plan, no per host or per user billing ——— Application developers, infrastructure engineers, DevOps & SREs, and business users send their Logs, Traces, and Metrics to Last9’s telemetry warehouse to monitor their services and systems and run alerting with anomaly algorithms for changes in patterns and behavior. Users are provided a Control Plane, as a first-class developer experience, to manage their telemetry data, its lifecycle, and its associated costs. Pre-Ingestion Workflows to filter, drop, and enrich data even before it’s stored don’t require instrumentation or code changes, and also enable engineering teams to not sacrifice visibility for cost optimizations. With Last9 built for high cardinality in mind — a generous 20M active time series per metric per day is supported, and tools like Cardinality Explorer & Streaming Aggregations allow identifying and handling telemetry with large cardinality. With correlated telemetry, Last9’s native explorer for Logs, Traces, and Metrics empowers users to quickly debug issues and not change context by allowing to jump between telemetry data, teams have the flexibility to use any tool that they’re comfortable with — either the embedded Grafana dashboard that Last9 comes with, or use Last9 as a data source for their preferred visualization tool. Organizations can choose between a SaaS or a BYOC/on-prem deployment model. Last9 is available on both AWS and GCP marketplaces. ——— Customers include Replit, Disney+ Hotstar, Clevertap, Circle, Probo, and Quickwork. Last9 is backed by Sequoia India (now called Peak XV) and Better Capital, along with a handful of prominent angels and advisors from Hashicorp, GoJek, Razorpay, Sendbird, and more.

Average Rating: 4.7/5.0

Total Reviews: 51

Who Is the Company Behind Last9?

  • Seller: Last9
  • Year Founded: 2020
  • HQ Location: San Francisco, California
  • Twitter: @last9io
    3,031 Twitter followers
  • LinkedIn® Page: www.linkedin.com
    27 employees on LinkedIn®

Who Uses This Product?

  • Who Uses This: Software Engineer, Senior Software Engineer
  • Top Industries: Computer Software, Financial Services
  • Company Size: 67% Medium, 31% Small

What Do G2 Reviewers Say About Last9?

AI-generated summary from verified user reviews

Pros
  • Users value the ease of use of Last9, finding it simplifies monitoring with minimal setup and clear navigation.
  • Users praise Last9 for its responsive and helpful customer support, facilitating smooth platform adoption and effective troubleshooting.
  • Users value the high reliability of Last9, noting its effectiveness in streamlining observability and incident response.
  • Users value the easy integrations of Last9, enhancing usability and streamlining the debugging process.
  • Users appreciate the easy integration and debugging features of Last9, enhancing their overall experience and efficiency.
Cons
  • Users find the difficult learning curve in Last9 challenging, particularly with SLOs and documentation clarity.
  • Users experience dashboard issues with data logging and UI unresponsiveness, complicating their troubleshooting tasks.
  • Users note a steep learning curve with Last9's rapid advancements, though the support team is helpful.
  • Users note a lack of advanced functionality and native multi-tab support, impacting their overall experience with Last9.
  • Users find the initial learning curve steep with Last9, though support from the team helps ease the transition.

What Are Recent G2 Reviews of Last9?

LogicMonitor

LogicMonitor is an AI-first observability platform that helps enterprises protect revenue, brand reputation, and customer experience in a digital-first world. As every customer interaction depends on application and infrastructure performance, downtime is more than an IT issue—it is a business risk. LogicMonitor eliminates blind spots across cloud, infrastructure, applications, and the Internet, giving IT teams unified visibility from user experience to code-level performance. With AI-powered insights, intelligent alerting, and automation, LogicMonitor helps organizations detect, prioritize, and prevent issues before they impact customers. By enabling teams to move from reactive incident response to autonomous IT operations, LogicMonitor helps modern enterprises reduce disruption, operate efficiently at scale, and keep digital services performing reliably. For more information, visit  www.logicmonitor.com and our blog, or follow us on LinkedIn, X, Facebook, and YouTube.

Average Rating: 4.5/5.0

Total Reviews: 587

Who Is the Company Behind LogicMonitor?

  • Seller: LogicMonitor
  • Company Website:
  • Year Founded: 2007
  • HQ Location: Santa Barbara, CA
  • Twitter: @logicmonitor
    12,430 Twitter followers
  • LinkedIn® Page: www.linkedin.com
    1,258 employees on LinkedIn®

Who Uses This Product?

  • Who Uses This: Infrastructure Manager, IT Manager
  • Top Industries: Information Technology and Services, Computer Software
  • Company Size: 52% Medium, 30% Large

What Do G2 Reviewers Say About LogicMonitor?

AI-generated summary from verified user reviews

Pros
  • Users value the ease of use in LogicMonitor, benefiting from its intuitive navigation and simple management features.
  • Users praise the implementation ease of LogicMonitor, appreciating its fast setup and intuitive platform navigation.
  • Users value the broad range of monitoring features in LogicMonitor, enhancing both infrastructure and application oversight.
  • Users value the comprehensive monitoring of LogicMonitor, providing deep insights into applications and infrastructure effortlessly.
  • Users commend the excellent customer support of LogicMonitor, facilitating enhanced monitoring and problem management effortlessly.
Cons
  • Users find the steep learning curve challenging due to the need for advanced skills and internet reliance.
  • Users note limited features, facing challenges like integrations, training needs, and an expensive licensing model.
  • Users find LogicMonitor to be expensive, especially for small teams without a free tier or affordable licenses.
  • Users find the inadequate monitoring capabilities of LogicMonitor frustrating, especially with traditional server workloads and configuration demands.
  • Users find the complexity of integrations and setup challenging, often requiring external tools and training for effective use.

What Are Recent G2 Reviews of LogicMonitor?

What Are G2 Users Discussing About LogicMonitor?

Honeycomb

Honeycomb is the observability platform that enables engineering teams to find and solve problems they couldn't before. Honeycomb’s approach is fundamentally different from other tools that claim observability, and is built to help teams answer novel questions about their ever-evolving cloud applications. Honeycomb is a modern observability platform built to help engineering teams quickly find and fix issues, including the ones they didn’t know to look for. Teams use Honeycomb to understand how their systems behave in production, get full context around every request, and resolve problems before customers notice. Where traditional tools separate logs, metrics, and traces, Honeycomb combines all telemetry into a single, unified event model. This enables fast, interactive querying across high-cardinality and high-dimensional data, so engineers can ask new questions without hitting limits or waiting minutes for results. Powered by a trace-first data store and designed for real-time exploration, Honeycomb makes it easy to pinpoint what’s broken, why it’s happening, and who is affected. It’s observability designed for modern, complex systems—simple to adopt, fast to query, and built to scale.

Average Rating: 4.5/5.0

Total Reviews: 36

Who Is the Company Behind Honeycomb?

  • Seller: Honeycomb.io
  • Company Website:
  • Year Founded: 2016
  • HQ Location: San Francisco, US
  • Twitter: @honeycombio
    14,830 Twitter followers
  • LinkedIn® Page: www.linkedin.com
    296 employees on LinkedIn®

Who Uses This Product?

  • Top Industries: Information Technology and Services, Computer Software
  • Company Size: 49% Medium, 41% Large

What Do G2 Reviewers Say About Honeycomb?

AI-generated summary from verified user reviews

Pros
  • Users find Honeycomb easy to use, enhancing system monitoring and alerting with intuitive visuals and extensive support.
  • Users value the efficient data analysis capabilities of Honeycomb, transforming their understanding of production systems.
  • Users value the intuitive data visualizations of Honeycomb, enhancing analysis and efficiency in system monitoring.
  • Users value Honeycomb for its real-time monitoring, enhancing system health awareness and enabling quick issue resolution.
  • Users value the intuitive data visualization and alerting features of Honeycomb, enhancing system monitoring and issue resolution.
Cons
  • Users find the difficult learning curve due to poor documentation and the need for self-learning, especially for beginners.
  • Users find the learning curve steep due to challenging documentation and the need for self-learning and external tools.
  • Users find the learning difficulty with Honeycomb frustrating due to unclear documentation and a steep learning curve.
  • Users desire more control in-product, citing limited features like the lack of aggregation options for reporting.
  • Users find limited reporting capabilities in Honeycomb necessitate reliance on external tools for effective analytics.

What Are Recent G2 Reviews of Honeycomb?

Paessler PRTG

Your infrastructure is complex. Your monitoring tool shouldn't be. Paessler PRTG delivers mission-critical visibility across IT and OT environments, deploying in minutes, not months. Whether you're managing servers, switches, virtual machines, cloud services, or industrial systems, PRTG monitors everything from a single platform, so your team always knows what's running, what's struggling, and what needs attention, before users do. Fast to deploy. Easy to run. Auto-discovery finds devices on your network automatically, and 300+ pre-configured sensors cover the most common infrastructure components out of the box. Support for all major protocols (SNMP, WMI, REST APIs, SSH, NetFlow, and more) means PRTG fits into your existing environment without forcing changes to it. Built for lean teams under real pressure. Customizable dashboards give instant visibility across your entire landscape. Flexible alerting (via email, SMS, push notification, or third-party integrations) ensures the right people are notified the moment something goes wrong. Historical trend data helps you spot patterns and plan ahead, not just react. Scales on your terms. From a single site to distributed multi-location environments, PRTG grows with your organization. Available as an on-premises installation or a hosted solution, it adapts to your infrastructure and your IT policies, no rip-and-replace required. Trusted by more than 500,000 users across 190+ countries since 1997, Paessler PRTG is the monitoring standard for IT professionals who need results, not complexity.

Average Rating: 4.7/5.0

Total Reviews: 207

Who Is the Company Behind Paessler PRTG?

  • Seller: Paessler GmbH
  • Company Website:
  • Year Founded: 1997
  • HQ Location: Nuremberg, Germany
  • LinkedIn® Page: www.linkedin.com
    400 employees on LinkedIn®

Who Uses This Product?

  • Who Uses This: Software Engineer, Network Administrator
  • Top Industries: Information Technology and Services, Telecommunications
  • Company Size: 52% Medium, 35% Large

What Do G2 Reviewers Say About Paessler PRTG?

AI-generated summary from verified user reviews

Pros
  • Users find Paessler PRTG's ease of use impressive, enjoying intuitive setup and customizable features for effective monitoring.
  • Users value the reliable monitoring capabilities of PRTG, enjoying its customizable sensors and mobile accessibility.
  • Users highlight the reliable monitoring capabilities of PRTG, enabling efficient tracking of critical network infrastructure.
  • Users value the robust alerting system of PRTG, ensuring immediate notifications for any network disruptions or issues.
  • Users find the easy setup of Paessler PRTG efficient, enabling quick monitoring of their network infrastructure.
Cons
  • Users find the high acquisition cost problematic, complicating the decision to monitor additional metrics and services.
  • Users report slow performance with large reports and dashboards, affecting usability during peak access times.
  • Users report user interface issues with PRTG, finding the web interface dated and the mobile app lacking polish.
  • Users find the learning curve for advanced features of PRTG to be steeper than expected, especially for new users.
  • Users find the complex setup of PRTG challenging, requiring extensive experimentation and fine-tuning for optimal performance.

What Are Recent G2 Reviews of Paessler PRTG?

What Are G2 Users Discussing About Paessler PRTG?

IBM Concert platform

IBM Concert® is an agentic IT Ops platform that creates an adaptable, unified operational layer across your environment. It connects signals, generates shared context, and coordinates action across teams and tools, so your entire system operates as one. With cross-domain intelligence, Concert helps you reduce risk, maintain business continuity, improve performance, and optimize cost across the stack. Powered by agentic AI, it surfaces what matters, prioritizes business impact, and orchestrates action through governed workflows. 

Average Rating: 4.2/5.0

Total Reviews: 27

Who Is the Company Behind IBM Concert platform?

  • Seller: IBM
  • Company Website:
  • Year Founded: 1911
  • HQ Location: Armonk, New York, United States
  • Twitter: @IBMSecurity
    74,660 Twitter followers
  • LinkedIn® Page: www.linkedin.com
    344,328 employees on LinkedIn®

Who Uses This Product?

  • Company Size: 41% Small, 37% Medium

What Do G2 Reviewers Say About IBM Concert platform?

AI-generated summary from verified user reviews

Pros
  • Users value the ease of use of IBM Concert, which simplifies project management and enhances team communication effectively.
  • Users value the end-to-end visibility and actionable insights of IBM Concert, enhancing focus and collaboration in their workflows.
  • Users value the automation capabilities of IBM Concert, enhancing efficiency and collaboration while minimizing manual efforts.
  • Users find the easy setup of IBM Concert smooth, enhancing productivity by integrating multiple tools into one platform.
  • Users value IBM Concert for its effective problem-solving capabilities, offering clear insights and speeding up incident resolution.
Cons
  • Users find the learning difficulty of IBM Concert challenging, often requiring time and better onboarding support.
  • Users find the initial setup complex, with a steep learning curve that challenges new users to get acquainted.
  • Users feel the learning curve is steep, making it challenging to grasp all features of IBM Concert quickly.
  • Users face integration issues with IBM Concert, noting the need for smoother connections and improved onboarding support.
  • Users express a need for limited customization options in IBM Concert, which hinder adaptability for diverse team requirements.

What Are Recent G2 Reviews of IBM Concert platform?

Middleware

Middleware is a full-stack observability platform designed to help users monitor and debug their applications by consolidating all metrics, logs, and traces into a single unified timeline. This solution is particularly beneficial for developers and DevOps teams, as it allows them to identify root causes of issues and resolve them in real time. By breaking down data silos, Middleware enhances visibility across various components of an application, ultimately leading to reduced downtime and improved user experiences. The target audience for Middleware includes businesses of all sizes, from startups to large enterprises, that rely on complex software infrastructures. These organizations often face challenges in monitoring their applications effectively, especially when dealing with multiple data sources. Middleware addresses these challenges by providing a comprehensive suite of monitoring tools that cater to diverse use cases. For instance, teams can leverage log monitoring to track application performance, while real-time monitoring capabilities ensure that any anomalies are detected and addressed promptly. Key features of Middleware include log monitoring, application performance management (APM), infrastructure monitoring, and synthetic monitoring. The unified dashboard is a standout feature, allowing users to view all relevant data—metrics, logs, and traces—consolidated in one place. This holistic view simplifies the debugging process, enabling teams to quickly pinpoint issues and implement solutions. Additionally, Middleware offers alerting and notification functionalities that keep users informed of critical events, ensuring that they can respond to potential problems before they escalate. Root-cause analysis is another essential aspect of Middleware, empowering teams to investigate and understand the underlying factors contributing to application issues. This feature not only aids in immediate problem resolution but also helps in preventing similar issues from arising in the future. Furthermore, the integration of LLM observability enhances the platform's capabilities, providing deeper insights into application behavior and performance. Overall, Middleware stands out in the observability landscape by offering a comprehensive, user-friendly platform that integrates various monitoring tools into a cohesive experience. Its focus on real-time insights and root-cause analysis makes it a valuable asset for organizations looking to optimize their software performance and enhance user satisfaction.

Average Rating: 4.7/5.0

Total Reviews: 55

Who Is the Company Behind Middleware?

  • Seller: Middleware
  • Company Website:
  • Year Founded: 2014
  • HQ Location: San Francisco, California
  • Twitter: @middleware_labs
    301 Twitter followers
  • LinkedIn® Page: linkedin.com
    50 employees on LinkedIn®

Who Uses This Product?

  • Top Industries: Computer Software, Information Technology and Services
  • Company Size: 71% Small, 16% Large

What Do G2 Reviewers Say About Middleware?

AI-generated summary from verified user reviews

Pros
  • Users value the unified, real-time monitoring of Middleware, streamlining issue resolution across diverse environments efficiently.
  • Users appreciate the ease of use of Middleware, with a modern UI that simplifies onboarding and daily workflows.
  • Users value the real-time monitoring capabilities of Middleware, enhancing issue resolution and overall operational efficiency.
  • Users value the unified, real-time dashboard of Middleware, enabling fast diagnostics across diverse environments effortlessly.
  • Users commend the easy setup of Middleware, simplifying integration and enhancing efficiency in DevOps workflows.
Cons
  • Users face integration issues requiring additional configuration, especially with advanced features and legacy systems.
  • Users find the configuration complexity initially challenging, particularly with advanced options and integrations, causing a steep learning curve.
  • Users find the steep learning curve of Middleware challenging, especially for those new to APM concepts and integrations.
  • Users experience a slight learning curve with Middleware, particularly affecting those new to advanced observability tools.
  • Users find the complex setup of Middleware challenging, especially due to manual configurations and a steep learning curve.

What Are Recent G2 Reviews of Middleware?

Netdata

Netdata is an AI-driven real-time observability platform that monitors systems, containers, applications, and infrastructure across servers, cloud environments, Kubernetes clusters, and IoT devices. With zero-configuration deployment, Netdata installs instantly, automatically discovers metrics, builds dashboards, and begins monitoring without setup. Netdata AI serves as an intelligent on-call assistant, automatically investigating alerts, correlating anomalies across thousands of metrics, identifying root causes, and explaining incidents with clear, actionable recommendations. By transforming raw telemetry into AI-guided insights, Netdata helps engineering teams move from alert to resolution in minutes instead of hours. The platform collects per-second metrics through 800+ integrations across operating systems, containers, databases, applications, OpenMetrics exporters, StatsD, and logs. Its distributed architecture processes data at the edge, enabling high-resolution monitoring and visibility into short-lived performance issues that traditional monitoring tools often miss. Netdata is available as a scalable SaaS platform with Netdata Cloud or as a private deployment within your own infrastructure, supporting on-prem, private cloud, and air-gapped environments while delivering automated dashboards, ML-based anomaly detection, and real-time troubleshooting.

Average Rating: 4.6/5.0

Total Reviews: 51

Who Is the Company Behind Netdata?

  • Seller: Netdata
  • Year Founded: 2018
  • HQ Location: San Francisco, US
  • Twitter: @netdatahq
    4,040 Twitter followers
  • LinkedIn® Page: www.linkedin.com
    79 employees on LinkedIn®

Who Uses This Product?

  • Top Industries: Information Technology and Services, Computer Software
  • Company Size: 44% Small, 43% Medium

What Do G2 Reviewers Say About Netdata?

AI-generated summary from verified user reviews

Pros
  • Users highlight the ease of use of Netdata, praising its quick setup and intuitive dashboard for monitoring.
  • Users praise the easy setup of Netdata, experiencing quick implementation and immediate access to detailed metrics.
  • Users praise the ease of setup and detailed real-time monitoring provided by Netdata, enabling efficient system management.
  • Users value the real-time monitoring of Netdata, appreciating its detail and immediacy for swift decision-making.
  • Users find the easy installation and user-friendly dashboard of Netdata to be highly beneficial for monitoring systems.
Cons
  • Users note missing APM features and limited documentation, which affect usability and long-term data retention.
  • Users find the insufficient documentation on best practices limits their ability to fully optimize Netdata's capabilities.
  • Users note the limited compatibility with Windows and lack of integrations, impacting their monitoring experience.
  • Users find the limited functionality of Netdata frustrating, especially with scalability and third-party dependencies affecting performance.
  • Users highlight resource limitations in Netdata, struggling with data volume and scalability challenges on their systems.

What Are Recent G2 Reviews of Netdata?

Splunk APM

Splunk APM is critical to help provide visibility and context into your apps and services as your environment scales. Splunk APM provides the most advanced solution for engineers who build and troubleshoot modern applications; with full fidelity trace analysis to provide context across complex cloud and microservice environments, AI directed troubleshooting and high cardinality to identify and resolve problems faster, AlwaysOn Profiling to provide code level visibility of service bottlenecks, and OpenTelemetry standardization to provide greater flexibility and control as you embrace new technologies and processes.

Average Rating: 4.4/5.0

Total Reviews: 17

Who Is the Company Behind Splunk APM?

  • Seller: Splunk
  • Year Founded: 2003
  • HQ Location: San Francisco, California, United States
  • Twitter: @splunk
    78,182 Twitter followers
  • LinkedIn® Page: www.linkedin.com
    10,012 employees on LinkedIn®
  • Ownership: NASDAQ:SPLK

Who Uses This Product?

  • Top Industries: Financial Services, Information Technology and Services
  • Company Size: 70% Large, 20% Medium

What Do G2 Reviewers Say About Splunk APM?

AI-generated summary from verified user reviews

Pros
  • Users appreciate the high-quality data from Splunk APM, which enhances product quality and boosts customer satisfaction.
  • Users value the high-quality data provided by Splunk APM, enhancing product quality and customer satisfaction.
  • Users appreciate the high quality data from Splunk APM, leading to improved products and happier customers.
  • Users value the high quality data provided by Splunk APM, enhancing product quality and customer satisfaction.
  • Users value the high-quality error tracking of Splunk APM, enhancing product quality and customer satisfaction.
Cons
  • Users find the inadequate reporting features of Splunk APM cumbersome, making data retrieval a challenging task.
  • Users find the inefficient log management challenging, often leading to difficulties in accessing specific logs and reports.
  • Users find it challenging to pull logs and data reports, highlighting the difficulties in log management within Splunk APM.
  • Users face log management issues, making it challenging to pull specific logs and data reports efficiently.
  • Users find reporting cumbersome, often struggling to pull specific logs and preferring broader reports instead.

What Are Recent G2 Reviews of Splunk APM?

What Are G2 Users Discussing About Splunk APM?

WatchTower Platform ML Insights

Embedded intelligence to proactively prevent problems, fix issues faster and get more done.

Average Rating: 4.2/5.0

Total Reviews: 11

Who Is the Company Behind WatchTower Platform ML Insights?

  • Seller: Symantec
  • Year Founded: 1982
  • HQ Location: San Jose, California, United States
  • Twitter: @symantec
    182,168 Twitter followers
  • LinkedIn® Page: www.linkedin.com
    13,153 employees on LinkedIn®
  • Ownership: NASDAQ:SYMC

Who Uses This Product?

  • Company Size: 73% Large, 18% Medium

What Are Recent G2 Reviews of WatchTower Platform ML Insights?

Checkmk

Checkmk is a full-stack monitoring and observability platform designed to provide unified visibility into hybrid IT infrastructures. With more than 2,000 built-in integrations, it offers broad coverage across networks, servers, cloud workloads, Kubernetes and applications. The platform is highly automated, featuring auto-discovery of hosts and services and rule-based configuration to reduce manual setup. It is highly scalable, capable of efficiently monitoring thousands of hosts and millions of services. A central web-based interface allows users to manage configuration, visualize data with customizable dashboards, and track system performance over time. Checkmk is available as packages for all common Linux distributions, as a virtual or physical appliance, through AWS and Azure Marketplace images, or as SaaS. Checkmk is available in four editions: Checkmk Community offers free and open source monitoring for small infrastructures. Checkmk Pro allows for monitoring at speed and scale for data center infrastructures. Checkmk Ultimate offers full-stack observability for hybrid and cloud-native infrastructures which is also available with multi-tenancy and data segregation to support security and compliance. And Checkmk Cloud for full-stack observability for hybrid and cloud-native infrastructures in a SaaS platform. Available extensions include synthetic monitoring and OpenTelemetry for application monitoring. The Checkmk Relay enables secure data collection for segmented networks using outbound-only communication, supporting fully air-gapped and zero-inbound monitoring deployments. Checkmk supports integration with ITSM tools and third-party platforms, enabling automatic ticket creation and consistent alerting. Features such as forecasting, capacity planning, and asset inventory as well as lifecycle management and auto-registration help teams manage dynamic IT environments. Monitoring capabilities: - Monitoring of hybrid infrastructures: cloud, on-premises, virtual, and container environments. - 2000+ built-in integrations networks, servers, cloud workloads, Kubernetes and applications out-of-the-box dashboards provide key metrics for AWS and Azure environments, Linux and Windows servers, and Kubernetes clusters. - Automated discovery and configuration. - Alerting with native ITSM integrations. Operational benefits: - Provides insights into system health, capacity trends, and future resource needs through built-in assessments and forecasting tools. - Reduces manual effort with auto-discovery, rule-based configuration, and centralized agent management as well as auto-registration and host lifecycle management. - Accelerates incident response time by using custom self-healing workflows via the ‘Alert Handler’. - Allows creation of tailored dashboards and views to focus on the most relevant metrics for each team. - Maintains an up-to-date inventory of hardware and software assets, enriched with live monitoring data. - Supports distributed monitoring and can handle massive amounts of data. Why choose Checkmk? - Cost Efficiency: Transparent pricing model with a strong price-performance ratio - Security: Meets stringent security requirements, including fully air-gapped deployments and zero-inbound monitoring. - Visibility: Delivers broad and deep visibility with flexible deployment options. - Scalability: Scales efficiently to support large, distributed environments with high host and service counts. - Extensibility: Supports custom plug-ins, integrations, synthetic monitoring to monitor you applications from the user’s perspective and OpenTelemetry for application monitoring. Customers include: Adobe, Cloudera, Fujitsu, Siemens, Orange, VW, HP, Zalando, Fitbit, NEC, Continental, NHL, Capgemini, Sixt, Intesa SanPaolo

Average Rating: 4.7/5.0

Total Reviews: 295

Who Is the Company Behind Checkmk?

  • Seller: Checkmk
  • Company Website:
  • Year Founded: 2007
  • HQ Location: Munich, DE
  • Twitter: @checkmk
    1,755 Twitter followers
  • LinkedIn® Page: www.linkedin.com
    232 employees on LinkedIn®

Who Uses This Product?

  • Who Uses This: IT Engineer, Systemadministrator
  • Top Industries: Information Technology and Services, Computer & Network Security
  • Company Size: 42% Medium, 40% Large

What Do G2 Reviewers Say About Checkmk?

AI-generated summary from verified user reviews

Pros
  • Users appreciate the ease of use of Checkmk, finding it quick to deploy and well-documented.
  • Users commend Checkmk for its flexibility and powerful monitoring capabilities, effectively managing diverse IT infrastructures.
  • Users appreciate the comprehensive monitoring capabilities of Checkmk, enabling effective oversight of diverse IT environments.
  • Users value the flexibility and customization of Checkmk, making it a powerful solution tailored to their needs.
  • Users value Checkmk for its real-time monitoring capabilities, allowing efficient oversight of diverse systems and applications.
Cons
  • Users find the steep learning curve challenging, making onboarding difficult for non-regular users and complicating their experience.
  • Users find difficult learning due to complex customization and limited data insights in Checkmk, affecting usability.
  • Users find the configuration process overly complex, especially during onboarding for new and non-regular users.
  • Users find the learning difficulty steep due to complex configurations and lacking intuitive documentation for advanced features.
  • Users find the complex setup of Checkmk challenging, especially for newcomers unfamiliar with the system.

What Are Recent G2 Reviews of Checkmk?

What Are G2 Users Discussing About Checkmk?

OpsPilot

OpsPilot OpsPilot is an AI-powered observability and autonomous reliability platform with an AI Site Reliability Engineering (SRE) teammate that helps engineering and operations teams detect, understand, and resolve incidents faster — and increasingly prevent them from happening at all. Your 24/7 stack expert Modern production systems — microservices, distributed architectures, cloud and hybrid environments — generate enormous volumes of telemetry. Your existing tools surface that data. But they still leave engineers responsible for interpreting signals, finding root causes, and deciding what to do next. OpsPilot closes that gap. It continuously analyzes telemetry across your applications, infrastructure, and services — then tells your team what is happening, why it is happening, and what to do about it. From dashboards to autonomous reliability OpsPilot goes beyond alerting and visualization. It correlates signals across metrics, logs, traces, and deployment events to identify abnormal behavior, explain root causes, and guide teams toward faster resolution — dramatically reducing time spent on incident investigation and operational troubleshooting. Over time, it evolves from reactive investigation toward proactive and autonomous operations. Your AI SRE teammate OpsPilot acts as an AI SRE teammate — augmenting your operations team by answering the questions engineers face during incidents: What changed? Where is the failure occurring? Which service is responsible? What should we investigate next? Three core capabilities Observability — collects and correlates telemetry across metrics, logs, traces, JVM data, and application-level diagnostics for a complete picture of system behavior. Operational Intelligence — applies AI-driven analysis to surface what changed, what is causing the issue, which components are involved, and what actions may resolve it. Foundational capabilities include anomaly detection, alert reduction, telemetry correlation, and root cause analysis. Action and Automation — supports guided incident response, runbook generation, automated remediation, and continuous operational learning — moving teams progressively toward autonomous reliability. OpenTelemetry-native. No new agents required. OpsPilot ingests telemetry via OTLP over gRPC or HTTP — no proprietary agent required. It works with your existing OpenTelemetry instrumentation across Kubernetes, microservices, cloud services, and serverless platforms. Prometheus-compatible metrics, Loki log ingestion, and Jaeger/Zipkin trace formats are also supported. For teams needing deep JVM or ColdFusion diagnostics, the optional FusionReactor APM agent provides additional application-level telemetry. Built for DevOps, SRE, and platform engineering teams OpsPilot is designed for organizations running modern production systems that require high reliability and operational efficiency — particularly teams moving toward SRE or platform engineering models who need deeper operational insight without increasing headcount. Deployed as SaaS, hybrid, or agentless via OpenTelemetry.

Average Rating: 4.8/5.0

Total Reviews: 174

Who Is the Company Behind OpsPilot?

  • Seller: Intergral
  • Company Website:
  • Year Founded: 1998
  • HQ Location: Boeblingen, DE
  • Twitter: @Fusion_Reactor
    9,345 Twitter followers
  • LinkedIn® Page: www.linkedin.com

Who Uses This Product?

  • Who Uses This: CTO, Developer
  • Top Industries: Information Technology and Services, Computer Software
  • Company Size: 61% Small, 29% Medium

What Do G2 Reviewers Say About OpsPilot?

AI-generated summary from verified user reviews

Pros
  • Users value the ease of use of OpsPilot, facilitating quick access to crucial metrics and troubleshooting insights.
  • Users find the real-time web metrics invaluable, enabling quick insights and identification of performance issues in their applications.
  • Users appreciate the real-time visibility and detailed insights provided by FusionReactor APM for effective monitoring.
  • Users value the real-time monitoring of OpsPilot, enabling effective performance management and quick issue resolution.
  • Users praise the responsive and friendly customer support of OpsPilot, making troubleshooting and assistance seamless.
Cons
  • Users find the learning curve challenging, as advanced features require careful configuration and can be overwhelming.
  • Users face difficult configuration challenges, leading to confusion and potentially missing out on important insights.
  • Users find the learning difficulty of OpsPilot challenging initially, requiring some research before effective use.
  • Users find the UI confusing, especially the Cloud version, despite ongoing improvements for clarity and usability.
  • Users find the UI design confusing, noting that it can complicate the initial experience with OpsPilot.

What Are Recent G2 Reviews of OpsPilot?

What Are G2 Users Discussing About OpsPilot?

Automation Anywhere Agentic Process Automation

Automation Anywhere Agentic Process Automation (APA) is an enterprise platform that orchestrates AI agents, RPA bots, APIs, documents, and human expertise as a single governed system of work. APA transforms what is possible with automation — orchestrating every instrument of work across every system, with execution grounded in process expertise, and end-to-end process governance across every agent, every step, and every decision. It turns individual capabilities into compounded business transformation. With the APA platform, you can optimize what already runs your business and expand into what has never been feasible before. What's inside the platform Process Reasoning Engine (PRE) — the decision layer. Goal-driven AI agents plan, act, adapt, and self-correct in real time as conditions change. Mozart Orchestrator — a unified composer that manages decisions, dependencies, context, and exceptions across agents, automations, documents, and APIs. AI Agent Studio — a low-code workspace for building AI agents on foundational models from Amazon Bedrock, Google Vertex AI, Azure OpenAI, OpenAI, and others. Automator AI — generative AI–powered automation development across any application, cloud or on-premises. Document Automation — processes unstructured documents at over 95% accuracy, and 5x faster with Cloud Extraction Service for large-scale extraction. Process Discovery — surfaces bottlenecks and identifies what to automate next. Automation Co-Pilot — triggers multi-step agentic workflows in natural language, inside the applications teams already use. Governance built in, not bolted on Every agent, action, and decision runs inside enterprise controls: fine-grained role-based access control (RBAC), AES-256 encryption at rest, TLS in transit, native audit logs with SIEM integration, and human-in-the-loop oversight. Automation Anywhere maintains SOC 1 Type 2, SOC 2 Type 2, ISO 27001, ISO 22301, and HITRUST certifications, and supports GDPR compliance. Proven in production 1,500+ live APA deployments, 400M+ automations run per year, and 1.8M+ unique AI agent executions across 26 global regions. Bancolombia — 1,300% ROI in the first year and a 50% increase in customer service efficiency JBS — $1M and 125,000 hours saved in IT Granite Telecom — $635,000 in monthly savings and 15,000 hours saved per month Ricoh — 500 days of operational time saved per month SoftBank Corp. — 85% reduction in recruitment hours Who it's for Enterprise operations, IT, finance, HR, customer service, and shared services teams in banking, insurance, healthcare, life sciences, manufacturing, telecommunications, and the public sector — wherever complex, cross-system work has to run reliably and be governed. Learn more at https://www.automationanywhere.com.

Average Rating: 4.5/5.0

Total Reviews: 4,094

Who Is the Company Behind Automation Anywhere Agentic Process Automation?

  • Seller: Automation Anywhere
  • Company Website:
  • Year Founded: 2003
  • HQ Location: San Jose, CA
  • Twitter: @AutomationAnywh
    55,050 Twitter followers
  • LinkedIn® Page: www.linkedin.com
    2,327 employees on LinkedIn®

Who Uses This Product?

  • Who Uses This: RPA Developer, Software Engineer
  • Top Industries: Information Technology and Services, Computer Software
  • Company Size: 59% Large, 23% Medium

What Do G2 Reviewers Say About Automation Anywhere Agentic Process Automation?

AI-generated summary from verified user reviews

Pros
  • Users praise the ease of use in Automation Anywhere Agentic Process Automation for simplifying RPA bot creation and management.
  • Users value the ease of automating repetitive tasks with Automation Anywhere, enhancing productivity and efficiency effortlessly.
  • Users appreciate the efficiency of Automation Anywhere, highlighting its ease of use and significant impact on productivity.
  • Users value the automation ease of Automation Anywhere, enabling non-coders to effortlessly build bots and streamline tasks.
  • Users appreciate the intuitive interface of Automation Anywhere, making automation easy and enhancing overall efficiency.
Cons
  • Users find Automation Anywhere's pricing model to be expensive and complex, which can be challenging for small teams.
  • Users find the steep learning curve challenging, especially for beginners navigating advanced features and debugging workflows.
  • Users find the missing features of Automation Anywhere Agentic Process Automation frustrating, limiting their workflow capabilities.
  • Users experience software bugs causing issues like errors in automation and problems with browser extensions.
  • Users often face bot issues including complex debugging and integration challenges, affecting overall usability and performance.

What Are Recent G2 Reviews of Automation Anywhere Agentic Process Automation?

What Are G2 Users Discussing About Automation Anywhere Agentic Process Automation?

Catchpoint

The Internet relies on Catchpoint Global 5000 companies, top online retailers, financial services, cloud infrastructure and services companies, and xSPs trust Catchpoint’s Internet Performance Monitoring (IPM) to detect and resolve internal or external issues across the Internet stack before they impact customers, employees, or digital experiences. Offering Internet Synthetics, RUM, BGP, Heartbeat Monitoring, Distributed Tracing, and performance optimization with high-fidelity data and flexible visualizations, Catchpoint is powered by the world’s largest active agent network to provide real-world user experience visibility and internet stack insights that complement Application Performance Monitoring (APM) to give IT Ops team instant awareness of incidents, root cause insights, and quick resolution.

Average Rating: 4.5/5.0

Total Reviews: 109

Who Is the Company Behind Catchpoint?

  • Seller: LogicMonitor
  • Company Website:
  • Year Founded: 2007
  • HQ Location: Santa Barbara, CA
  • Twitter: @logicmonitor
    12,430 Twitter followers
  • LinkedIn® Page: www.linkedin.com
    1,258 employees on LinkedIn®

Who Uses This Product?

  • Who Uses This: Software Engineer
  • Top Industries: Information Technology and Services, Financial Services
  • Company Size: 65% Large, 22% Medium

What Do G2 Reviewers Say About Catchpoint?

AI-generated summary from verified user reviews

Pros
  • Users value Catchpoint for its real-time issue detection, enhancing performance monitoring and speeding up resolution times.
  • Users value Catchpoint for its effective monitoring capabilities, providing real-time insights and proactive issue detection.
  • Users praise the exceptional customer support of Catchpoint, highlighting their quick responses and effective troubleshooting.
  • Users appreciate the real-time alerting features of Catchpoint, enabling quick issue detection and seamless user experience.
  • Users value the real-time alerts from Catchpoint that enhance issue detection and improve system performance monitoring.
Cons
  • Users feel that the pricing is too high and lacks transparency, making it less accessible for smaller teams.
  • Users find the difficult learning curve of Catchpoint challenging initially, though it becomes easier with time.
  • Users find the learning curve challenging, noting the initial complexity and time needed to master Catchpoint's features.
  • Users find the pricing structure inflexible, as it tends to favor larger enterprises over smaller teams.
  • Users find the complex configuration challenging initially, as it requires time to learn and master the features.

What Are Recent G2 Reviews of Catchpoint?

What Are G2 Users Discussing About Catchpoint?

Tian Lin
TL
Researched and written by Tian Lin
Updated June 12, 2025