Best Predictive Analytics Tools and Software - Page 4

How Many Predictive Analytics Software Products Does G2 Track?

Total Products under this Category: 367

Category Stats (Sep 2026)

  • Average Rating: 4.44/5 The average rating of products in this category, based on all submitted ratings
  • Top Trending Product: Palantir Foundry (+1.94%) - Among all products in this category, Palantir Foundry recorded the largest rating increase compared to last month

Last updated: September 01, 2026

How Does G2 Rank Predictive Analytics Software Products?

Why You Can Trust G2's Software Rankings:

  • 30 Analysts and Data Experts
  • 30,000+ Authentic Reviews
  • 367+ Products
  • Unbiased Rankings

G2's software rankings are built on verified user reviews, rigorous moderation, and a consistent research methodology maintained by a team of analysts and data experts. Each product is measured using the same transparent criteria, with no paid placement or vendor influence. While reviews reflect real user experiences, which can be subjective, they offer valuable insight into how software performs in the hands of professionals. Together, these inputs power the G2 Score, a standardized way to compare tools within every category.

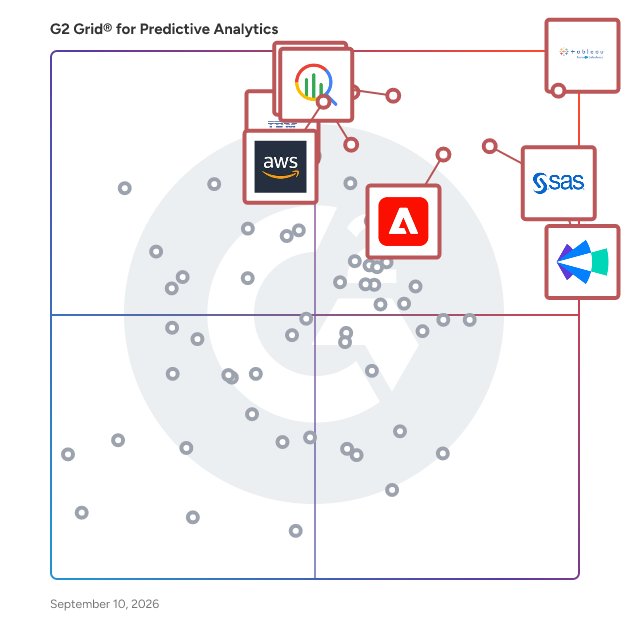
G2 Grid® for Predictive Analytics Software

G2 Grid® for Predictive Analytics Software plotting products by satisfaction and market presence

Highlighted products: Tableau, Clari, SAS Viya, Google Cloud BigQuery, Adobe Analytics, IBM Cognos Analytics, Amazon Quick, and IBM SPSS Statistics.

Underlying data: [Grid® JSON](https://www.g2.com/categories/predictive-analytics/grids.json?focus%5B%5D=tableau&focus%5B%5D=clari&focus%5B%5D=sas-sas-viya&focus%5B%5D=google-cloud-bigquery&focus%5B%5D=adobe-analytics&focus%5B%5D=ibm-cognos-analytics&focus%5B%5D=amazon-quick&focus%5B%5D=ibm-spss-statistics)

ibi WebFOCUS

The ibi WebFOCUS® platform is an enterprise business intelligence and analytics solution equipped with data management, visual discovery, predictive analytics, and powerful visualizations. Combining these capabilities and data science in one unified platform, the WebFOCUS solution helps make data-driven decisions across the enterprise providing reports, dashboards, and customer-facing applications at scale.

Average Rating: 4.4/5.0

Total Reviews: 149

How Do G2 Users Rate ibi WebFOCUS?

  • Has the product been a good partner in doing business?: 8.9/10 (Category avg: 8.9/10)
  • Algorithms: 8.1/10 (Category avg: 8.6/10)

Who Is the Company Behind ibi WebFOCUS?

  • Seller: ibi
  • Year Founded: 1975
  • HQ Location: Fort Lauderdale, FL
  • Twitter: @infobldrs
    32,864 Twitter followers
  • LinkedIn® Page: www.linkedin.com
    890 employees on LinkedIn®
  • Phone: 212-736-4433

Who Uses This Product?

  • Top Industries: Information Technology and Services, Government Administration
  • Company Size: 57% Large, 32% Medium

What Are Recent G2 Reviews of ibi WebFOCUS?

What Are G2 Users Discussing About ibi WebFOCUS?

Explorium

Explorium is the leading B2B data layer for building high-performance GTM agents. Our seamless API and MCP integrations power agents with premium B2B data, accelerating development, enhancing contextual intelligence, and improving ROI. Backed by years of expertise in B2B data and access to more than 50 data sources, we deliver enterprise-grade data through flexible delivery options. Try it for free at https://www.explorium.ai/sign-up/?utm_source=g2&utm_medium_organic

Average Rating: 4.6/5.0

Total Reviews: 28

How Do G2 Users Rate Explorium?

  • Has the product been a good partner in doing business?: 10.0/10 (Category avg: 8.9/10)
  • Algorithms: 9.2/10 (Category avg: 8.6/10)

Who Is the Company Behind Explorium?

  • Seller: Explorium
  • HQ Location: San Mateo, California
  • Twitter: @Explorium_ai
    1,347 Twitter followers
  • LinkedIn® Page: www.linkedin.com
    85 employees on LinkedIn®

Who Uses This Product?

  • Top Industries: Financial Services, Education Management
  • Company Size: 57% Small, 39% Medium

What Are Recent G2 Reviews of Explorium?

What Are G2 Users Discussing About Explorium?

SAS Visual Statistics

Multiple users can explore data, then interactively create and refine predictive models. Distributed, in-memory processing slashes model development time, quickly surfacing valuable insights you can act on.

Average Rating: 4.4/5.0

Total Reviews: 24

How Do G2 Users Rate SAS Visual Statistics?

  • Has the product been a good partner in doing business?: 8.1/10 (Category avg: 8.9/10)
  • Algorithms: 7.1/10 (Category avg: 8.6/10)

Who Is the Company Behind SAS Visual Statistics?

  • Seller: SAS Institute Inc.
  • Year Founded: 1976
  • HQ Location: Cary, NC
  • Twitter: @SASsoftware
    60,863 Twitter followers
  • LinkedIn® Page: www.linkedin.com
    15,122 employees on LinkedIn®
  • Phone: 1-800-727-0025

Who Uses This Product?

  • Company Size: 52% Large, 32% Small

What Do G2 Reviewers Say About SAS Visual Statistics?

AI-generated summary from verified user reviews

Pros
  • Users value the ease of use in SAS Visual Statistics, noting no training required for effective operation.
  • Users value the automated analytics in SAS Visual Statistics, making data understanding and forecasting straightforward.
  • Users value the proactive customer support of SAS Visual Statistics, enhancing their overall experience with the product.
  • Users value the advanced machine learning capabilities of SAS Visual Statistics for efficient data analysis and predictive modeling.
  • Users value the reliable reporting tools of SAS Visual Statistics for their effective forecasting and clarity.
Cons
  • Users express concerns about the high licensing cost, making SAS Visual Statistics difficult to afford for many.
  • Users find that learning may be difficult without prior experience with SAS tools, limiting usability and understanding.
  • Users are concerned about the high licensing cost and associated infrastructure requirements of SAS Visual Statistics.
  • Users feel that customization difficulty in SAS Visual Statistics hinders their ability to tailor the software effectively.
  • Users struggle with data analysis difficulty, finding it hard to grasp modeling calculations and reconcile approaches effectively.

What Are Recent G2 Reviews of SAS Visual Statistics?

Spotfire Analytics

Spotfire® is a visual data science platform designed to help organizations address complex, industry-specific challenges by effectively utilizing data. This solution offers a range of flexible packaging options tailored to meet the diverse needs of teams at various stages of their visual data science journey. Turn raw data into real-time decisions with powerful, interactive visual analytics with Spotfire® Analytics. Spotfire Analytics is designed for business agility, enabling every user to explore data visually, uncover patterns quickly, and make confident, data-driven decisions without writing a single line of code. As a self-service visual data science solution, it empowers teams across roles and departments to gain fast, actionable insights that drive impact. With its no-code interactive dashboards and rich visual exploration capabilities, Spotfire Analytics connects natively to hundreds of cloud, on-premises, and real-time data sources. Built-in geoanalytics extend the power of analysis with multi-layer mapping and seamless integration of spatial data, while data wrangling and transformation can be performed directly within the visual interface, making it easy to clean, shape, and blend data as you analyze. AI-assisted recommendations and anomaly detection help uncover hidden patterns, suggest the most meaningful visualizations, and accelerate the path to discovery. Customizable visualizations, workflows, and an intuitive interface ensure that insights are not only easier to create but also easier to share. With seamless collaboration features, Spotfire Analytics enables teams to work together, align on insights, and act decisively. Whether the goal is to analyze trends, detect anomalies, or unlock location-based intelligence, Spotfire Analytics delivers the speed, flexibility, and depth needed to make smarter decisions with confidence. Explore and understand your data visually, uncover hidden insights, and build powerful analytics applications - all without writing a single line of code. Spotfire Analytics combines advanced interactive visualizations and intuitive data wrangling in one environment. Connect to hundreds of data sources, from files to real-time streaming data, and transform messy data directly within your visuals. Built-in AI recommendations help you find patterns, anomalies, and trends faster. With flexible visualizations, spatial analytics, and custom applications, anyone can turn raw data into actionable insights in minutes. Designed for business agility, Spotfire Analytics empowers every user to explore, analyze, and share results confidently - turning questions into decisions. Best for: Analysts, data-savvy professionals, and teams looking to explore and share data visually with maximum flexibility.

Average Rating: 4.2/5.0

Total Reviews: 328

How Do G2 Users Rate Spotfire Analytics?

  • Has the product been a good partner in doing business?: 8.4/10 (Category avg: 8.9/10)
  • AI Text Summarization: 8.3/10 (Category avg: 8.1/10)
  • Algorithms: 6.3/10 (Category avg: 8.6/10)
  • AI Text Generation: 8.3/10 (Category avg: 8.1/10)

Who Is the Company Behind Spotfire Analytics?

Who Uses This Product?

  • Who Uses This: Student, Manager
  • Top Industries: Oil & Energy, Information Technology and Services
  • Company Size: 52% Large, 26% Medium

What Do G2 Reviewers Say About Spotfire Analytics?

AI-generated summary from verified user reviews

Pros
  • Users appreciate the powerful and flexible data visualization capabilities of Spotfire Analytics, enhancing their data exploration experience.
  • Users appreciate the ease of use of Spotfire Analytics, enabling quick insights and effective decision-making with complex data.
  • Users appreciate the easy integrations of Spotfire Analytics, enhancing accuracy and enabling robust AI-powered analytics seamlessly.
  • Users rave about Spotfire's powerful analytics capabilities, enabling advanced data handling and insightful visualizations seamlessly.
  • Users love the transformative interactive visualizations of Spotfire, simplifying complex data for clear understanding across teams.
Cons
  • Users find Spotfire's steep learning curve challenging, particularly for those unfamiliar with data modeling and scripting.
  • Users find the learning difficulty significant, especially for beginners navigating advanced features and options in Spotfire.
  • Users find the licensing costs high, making Spotfire Analytics less accessible for smaller organizations.
  • Users often face a steep learning curve with Spotfire Analytics, making initial use challenging for newcomers.
  • Users note that there are limitations in data comparison and features, affecting usability and clarity of Spotfire Analytics.

What Are Recent G2 Reviews of Spotfire Analytics?

What Are G2 Users Discussing About Spotfire Analytics?

H2O

H2O.ai is the leading AI Cloud company, on a mission to democratize AI and drive an open AI movement around the world. They focus on drawing insights from structured and unstructured data like video and documents with their award-winning products like Hydrogen Torch and Document AI. Customers use the H2O AI Cloud to rapidly solve complex business problems and accelerate the discovery of new ideas. H2O.ai is the trusted AI provider to more than 20,000 global organizations, millions of data scientists and over half of the Fortune 500, including AT&T, Commonwealth Bank of Australia, Citi, GlaxoSmithKline, Hitachi, Kaiser Permanente, Procter & Gamble, PayPal, PwC, Reckitt, Unilever, Goldman Sachs, NVIDIA, and Wells Fargo are not only customers and partners, but strategic investors in the company. More than 30 Kaggle Grandmasters (the community of best-in-the-world machine learning practitioners and data scientists) are makers at H2O.ai. A strong AI for Good ethos to make the world a better place and Responsible AI drive the company’s purpose. Please join our movement at www.h2o.ai. H2O.ai offers enterprise customers with multiple platforms for AI and machine learning, including the open source distributed machine learning platform H2O-3, automatic machine learning platform H2O Driverless AI, and the recently announced H2O Q, an AI platform for business users: H2O-3 is an open source, scalable and distributed in-memory AI and machine learning platform. H2O-3 also has a strong AutoML functionality and supports the most widely used statistical and machine learning algorithms including gradient boosted machines, generalized linear models, deep learning, XGBoost and more. H2O Driverless AI empowers data scientists to work on projects faster and more efficiently by using automation to accomplish tasks quickly with automatic feature engineering, model tuning, model tuning, model selection, model validation and machine learning interpretability, custom recipes, time-series and automatic deployment pipeline generation for model scoring. H2O Q is a new AI platform that provides the essential building blocks to make AI apps and will bring the power of AI to millions of business users. It delivers automatic insights and predictions for “in the moment” business questions and is ideal for data analysts, citizen data scientists and all business users.

Average Rating: 4.5/5.0

Total Reviews: 22

How Do G2 Users Rate H2O?

  • Has the product been a good partner in doing business?: 8.3/10 (Category avg: 8.9/10)
  • Algorithms: 8.3/10 (Category avg: 8.6/10)

Who Is the Company Behind H2O?

  • Seller: H2O.ai
  • Year Founded: 2012
  • HQ Location: Mountain View, CA
  • Twitter: @h2oai
    25,222 Twitter followers
  • LinkedIn® Page: www.linkedin.com
    372 employees on LinkedIn®

Who Uses This Product?

  • Company Size: 54% Small, 29% Large

What Are Recent G2 Reviews of H2O?

What Are G2 Users Discussing About H2O?

Prophet

Prophet is a world-class predictive intelligence platform that utilises advanced mathematics, machine-learning and human intervention to ensure organisations can make better decisions, daily.

Average Rating: 4.2/5.0

Total Reviews: 12

How Do G2 Users Rate Prophet?

  • Has the product been a good partner in doing business?: 9.2/10 (Category avg: 8.9/10)
  • Algorithms: 8.2/10 (Category avg: 8.6/10)

Who Is the Company Behind Prophet?

  • Seller: Prophet
  • HQ Location: San Francisco, CA
  • Twitter: @prophetstrategy
    8,586 Twitter followers
  • LinkedIn® Page: www.linkedin.com
    724 employees on LinkedIn®

Who Uses This Product?

  • Company Size: 50% Small, 33% Large

What Do G2 Reviewers Say About Prophet?

AI-generated summary from verified user reviews

Pros
  • Users find Prophet's ease of use remarkable, appreciating its straightforward implementation and flexibility in Python and R.
  • Users appreciate the efficiency of Prophet, benefiting from its easy implementation and accurate time-series forecasting.
  • Users value the flexibility of Prophet with its compatibility in both Python and R for easy implementation.
Cons
  • Users find the complex implementation of multi-variate forecasting in Prophet challenging and cumbersome to navigate.

What Are Recent G2 Reviews of Prophet?

Akkio

Akkio is the AI platform that empowers media companies to lead the market with AI. By partnering with cutting-edge AI agents, media teams streamline the entire campaign lifecycle, delivering tailored results for every client. Built on an AI-first foundation with an intuitive interface, Akkio equips every team member with powerful intelligence, helping companies grow, teams thrive, and clients win.

Average Rating: 4.5/5.0

Total Reviews: 14

How Do G2 Users Rate Akkio?

  • Has the product been a good partner in doing business?: 10.0/10 (Category avg: 8.9/10)
  • AI Text Summarization: 7.8/10 (Category avg: 8.1/10)
  • Algorithms: 9.4/10 (Category avg: 8.6/10)
  • AI Text Generation: 7.8/10 (Category avg: 8.1/10)

Who Is the Company Behind Akkio?

  • Seller: Akkio Inc.
  • Year Founded: 2019
  • HQ Location: Cambridge, US
  • Twitter: @AkkioHQ
    5,355 Twitter followers
  • LinkedIn® Page: www.linkedin.com
    61 employees on LinkedIn®

Who Uses This Product?

  • Company Size: 64% Small, 14% Medium

What Do G2 Reviewers Say About Akkio?

AI-generated summary from verified user reviews

Pros
  • Users find generative AI integration in Akkio incredibly helpful for enhancing their overall experience and productivity.
  • Users find generative AI extremely helpful when leveraging Akkio for enhanced machine learning capabilities.
Cons
  • Users express dissatisfaction with the insufficient learning resources available for Akkio, hindering their ability to maximize the platform.

What Are Recent G2 Reviews of Akkio?

TIMi

TIMi is the most efficient Data Science and Data Processing Platform. Since 2007, we have been creating and improving the most powerful framework to push the barriers of analytics, predictive analytics, AI and Big Data, while offering a helpful, fast and friendly environment. The TIMi Suite consists of four tools: 1. Anatella (Analytical ETL, Data Prep & Big Data), 2. Modeler (Auto-ML / Automated Predictive Modelling / Automated-AI), 3. StarDust (3D Segmentation) 4. Kibella (BI Dashboarding solution). TIMi dominates the Data Science market: In the "Summer 2022 - Momentum Report” from G2, in the “Data Science” category, TIMi has the #1 rank: TIMi is the Data Science solution with both the highest market growth and the highest customer-satisfaction! More about this subject here: https://timi.eu/blog/timi-the-number-one-data-science-platform/

Average Rating: 4.8/5.0

Total Reviews: 50

How Do G2 Users Rate TIMi?

  • Has the product been a good partner in doing business?: 9.1/10 (Category avg: 8.9/10)
  • AI Text Summarization: 8.3/10 (Category avg: 8.1/10)
  • Algorithms: 9.1/10 (Category avg: 8.6/10)
  • AI Text Generation: 9.2/10 (Category avg: 8.1/10)

Who Is the Company Behind TIMi?

  • Seller: TIMi SPRL
  • Year Founded: 2007
  • HQ Location: Brussels
  • Twitter: @TIMiSuite
    3,532 Twitter followers
  • LinkedIn® Page: www.linkedin.com
    86 employees on LinkedIn®

Who Uses This Product?

  • Top Industries: Information Technology and Services, Banking
  • Company Size: 40% Small, 32% Large

What Do G2 Reviewers Say About TIMi?

AI-generated summary from verified user reviews

Pros
  • Users highlight the exceptional customer support from the TIMi team, noting their quick response times and helpfulness.
  • Users find TIMi easy to use, thanks to its intuitive design and quick learning curve.
  • Users appreciate TIMi's user-friendly interface and exceptional support, making data transformation quick and efficient.
  • Users value the fast and intuitive automation capabilities of TIMi, streamlining data transformations and analyses effectively.
  • Users value the intuitive charting features of TIMi, enabling efficient data visualization and analysis.

What Are Recent G2 Reviews of TIMi?

What Are G2 Users Discussing About TIMi?

Wand.ai

Wand platform, enables business users and data analysts to solve real-world business problems easily and quickly – Collaborative, measurable and scalable.

Average Rating: 3.8/5.0

Total Reviews: 15

How Do G2 Users Rate Wand.ai?

  • AI Text Summarization: 8.7/10 (Category avg: 8.1/10)
  • Algorithms: 7.5/10 (Category avg: 8.6/10)
  • AI Text Generation: 8.3/10 (Category avg: 8.1/10)

Who Is the Company Behind Wand.ai?

  • Seller: Wand.ai
  • Year Founded: 2022
  • HQ Location: San Francisco, Bay Area, US
  • LinkedIn® Page: www.linkedin.com
    190 employees on LinkedIn®

Who Uses This Product?

  • Company Size: 67% Small, 33% Medium

What Do G2 Reviewers Say About Wand.ai?

AI-generated summary from verified user reviews

Pros
  • Users find Wand.ai's ease of learning remarkable, facilitating quick access to AI functionalities without a steep learning curve.
  • Users appreciate the ease of use of Wand.ai, enabling quick, flexible, and efficient interaction with AI tools.
  • Users appreciate the flexibility of Wand.ai, effortlessly adapting it to various use cases and workflows.
  • Users appreciate the intuitive interface of Wand.ai, making AI interaction seamless and enhancing productivity effortlessly.
  • Users enjoy the speed of task completion with Wand.ai, making content creation and idea generation effortless.
Cons
  • Users find the difficult customization of Wand.ai limits usability and makes the experience less reliable overall.
  • Users find that limited features on lower plans hinder functionality and require manual adjustments, affecting usability.
  • Users experience slow performance during heavy usage, affecting the reliability and responsiveness of Wand.ai.

What Are Recent G2 Reviews of Wand.ai?

CrunchMetrics

CrunchMetrics is an advanced anomaly detection system, that leverages the combined power of statistical methods and AI-ML based techniques to sift through your data to identify incidents that are business critical in nature. It examines historical data to understand and establish what is ‘normal’ behavior, and then constantly monitors data streams to single out ‘abnormal’ patterns, known as anomalies.

Average Rating: 4.3/5.0

Total Reviews: 23

How Do G2 Users Rate CrunchMetrics?

  • Has the product been a good partner in doing business?: 9.0/10 (Category avg: 8.9/10)

Who Is the Company Behind CrunchMetrics?

  • Seller: CrunchMetrics
  • Year Founded: 2019
  • HQ Location: Broomfield, Colorado
  • Twitter: @crunchmetrics
    388 Twitter followers
  • LinkedIn® Page: www.linkedin.com

Who Uses This Product?

  • Company Size: 52% Small, 30% Medium

What Do G2 Reviewers Say About CrunchMetrics?

AI-generated summary from verified user reviews

Pros
  • Users value the innovative real-time anomaly detection of CrunchMetrics, enhancing decision-making across various industries.
  • Users love the ease of use of CrunchMetrics, finding the interface intuitive and flexible for smooth operations.
  • Users praise CrunchMetrics for its powerful analytical skills and real-time anomaly detection, enhancing decision-making and insights.
  • Users value the efficiency of CrunchMetrics, benefiting from real-time anomaly detection and enhanced decision-making capabilities.
  • Users praise the flexibility of CrunchMetrics, enabling seamless integration and adaptation to diverse data needs.
Cons
  • Users find the pricing expensive compared to competitors, suggesting improvements for better accessibility and tutorials.
  • Users find the confusing pricing of CrunchMetrics to be expensive and lacking transparency, limiting its accessibility.
  • Users mention a challenging learning curve that may complicate daily use of CrunchMetrics.
  • Users find that the pricing structure can be harsh and challenging for some organizations based on their size.
  • Users find the implementation process complex, which can complicate their experience with CrunchMetrics.

What Are Recent G2 Reviews of CrunchMetrics?

What Are G2 Users Discussing About CrunchMetrics?

Metaps

Metaps provides one SDK that analyzes and provides essential data for marketing, promotions, and monetization.

Average Rating: 4.2/5.0

Total Reviews: 16

How Do G2 Users Rate Metaps?

  • AI Text Summarization: 9.4/10 (Category avg: 8.1/10)
  • Algorithms: 9.3/10 (Category avg: 8.6/10)
  • AI Text Generation: 10.0/10 (Category avg: 8.1/10)

Who Is the Company Behind Metaps?

  • Seller: Metaps
  • Year Founded: 2023
  • HQ Location: 渋谷区, JP
  • Twitter: @Metaps_PR
    4,053 Twitter followers
  • LinkedIn® Page: www.linkedin.com
    46 employees on LinkedIn®
  • Ownership: TYO: 6172

Who Uses This Product?

  • Company Size: 53% Small, 41% Medium

What Are Recent G2 Reviews of Metaps?

Spotfire Statistica

Statistica helps you innovate and solve complex problems faster, empower more people, and infuse algorithms everywhere to ensure insights quickly turn into optimal outcomes.

Average Rating: 4.1/5.0

Total Reviews: 12

How Do G2 Users Rate Spotfire Statistica?

  • Has the product been a good partner in doing business?: 9.6/10 (Category avg: 8.9/10)
  • Algorithms: 9.2/10 (Category avg: 8.6/10)

Who Is the Company Behind Spotfire Statistica?

Who Uses This Product?

  • Company Size: 38% Small, 31% Large

What Are Recent G2 Reviews of Spotfire Statistica?

What Are G2 Users Discussing About Spotfire Statistica?

IQub Business Intelligence Reporting Solutions

eBusiness Advisor tracks and monitors your business to provide insight into your business, highlighting what is working well and what isn't. Designed for simplicity but built for performance, eBusiness Advisor puts key information in the hands of those that need it.

Average Rating: 4.5/5.0

Total Reviews: 14

How Do G2 Users Rate IQub Business Intelligence Reporting Solutions?

  • Has the product been a good partner in doing business?: 8.8/10 (Category avg: 8.9/10)
  • AI Text Summarization: 10.0/10 (Category avg: 8.1/10)
  • Algorithms: 8.3/10 (Category avg: 8.6/10)
  • AI Text Generation: 8.3/10 (Category avg: 8.1/10)

Who Is the Company Behind IQub Business Intelligence Reporting Solutions?

Who Uses This Product?

  • Company Size: 47% Medium, 47% Small

What Are Recent G2 Reviews of IQub Business Intelligence Reporting Solutions?

Faraday

Through both an intuitive, no-code UI and a robust API, Faraday enables the modern marketer to easily describe and deploy predictions for virtually any customer behavior–no PhD required. Make your marketing strategies proactive by using proven machine learning techniques to predict for propensity to buy, convert, churn, and more. With hundreds of integrations, Faraday lets you embed AI in workflows throughout your stack to make your favorite tools perform even better. Try it for free.

Average Rating: 3.4/5.0

Total Reviews: 14

How Do G2 Users Rate Faraday?

  • Has the product been a good partner in doing business?: 8.8/10 (Category avg: 8.9/10)
  • AI Text Summarization: 6.1/10 (Category avg: 8.1/10)
  • Algorithms: 6.9/10 (Category avg: 8.6/10)
  • AI Text Generation: 6.1/10 (Category avg: 8.1/10)

Who Is the Company Behind Faraday?

  • Seller: Faraday
  • Year Founded: 2012
  • HQ Location: Burlington, VT
  • Twitter: @faradayai_
    375 Twitter followers
  • LinkedIn® Page: www.linkedin.com
    43 employees on LinkedIn®

Who Uses This Product?

  • Company Size: 50% Medium, 43% Small

What Are Recent G2 Reviews of Faraday?

What Are G2 Users Discussing About Faraday?

Hyllo

Hyllo is a comprehensive platform designed to streamline and enhance communication and collaboration within organizations. It offers a suite of tools that facilitate seamless interaction among team members, ensuring efficient project management and information sharing. By integrating various communication channels into a single interface, Hyllo simplifies workflows and reduces the need for multiple disparate tools. Key Features and Functionality: - Unified Communication: Combines messaging, video conferencing, and file sharing in one platform, enabling real-time collaboration. - Project Management Tools: Provides task assignment, progress tracking, and deadline management to keep projects on schedule. - Integration Capabilities: Seamlessly integrates with popular third-party applications, enhancing productivity without disrupting existing workflows. - Customizable Workspaces: Allows teams to create tailored environments that suit their specific needs and preferences. - Security and Compliance: Ensures data protection with robust security measures and compliance with industry standards. Primary Value and Solutions: Hyllo addresses the common challenges of fragmented communication and disjointed project management by offering a centralized platform that fosters transparency and efficiency. It eliminates the need for multiple tools, reducing complexity and costs. By enhancing collaboration and streamlining processes, Hyllo empowers teams to achieve their goals more effectively and with greater cohesion.

Average Rating: 4.3/5.0

Total Reviews: 27

How Do G2 Users Rate Hyllo?

  • Has the product been a good partner in doing business?: 9.0/10 (Category avg: 8.9/10)
  • AI Text Summarization: 8.5/10 (Category avg: 8.1/10)
  • Algorithms: 8.8/10 (Category avg: 8.6/10)
  • AI Text Generation: 8.4/10 (Category avg: 8.1/10)

Who Is the Company Behind Hyllo?

  • Seller: Hyllo Analytics
  • Year Founded: 2015
  • HQ Location: Oakville, Ontario
  • Twitter: @Hyllo_io
    149 Twitter followers
  • LinkedIn® Page: www.linkedin.com
    3 employees on LinkedIn®

Who Uses This Product?

  • Top Industries: Information Technology and Services
  • Company Size: 56% Small, 37% Medium

What Do G2 Reviewers Say About Hyllo?

AI-generated summary from verified user reviews

Cons
  • Users experience 500 errors in the free version, limiting the effectiveness of Hyllo for campaign triggers.

What Are Recent G2 Reviews of Hyllo?

Bijou Barry
BB
Researched and written by Bijou Barry
Updated October 29, 2024