INVIS Solutions
Who Is the Company Behind INVIS Solutions?
- Seller: INVIS Solutions
- HQ Location: Knoxville, US
- LinkedIn® Page: www.linkedin.com
Total Products under this Category: 155
Last updated: September 05, 2026
Why You Can Trust G2's Software Rankings:
G2's software rankings are built on verified user reviews, rigorous moderation, and a consistent research methodology maintained by a team of analysts and data experts. Each product is measured using the same transparent criteria, with no paid placement or vendor influence. While reviews reflect real user experiences, which can be subjective, they offer valuable insight into how software performs in the hands of professionals. Together, these inputs power the G2 Score, a standardized way to compare tools within every category.
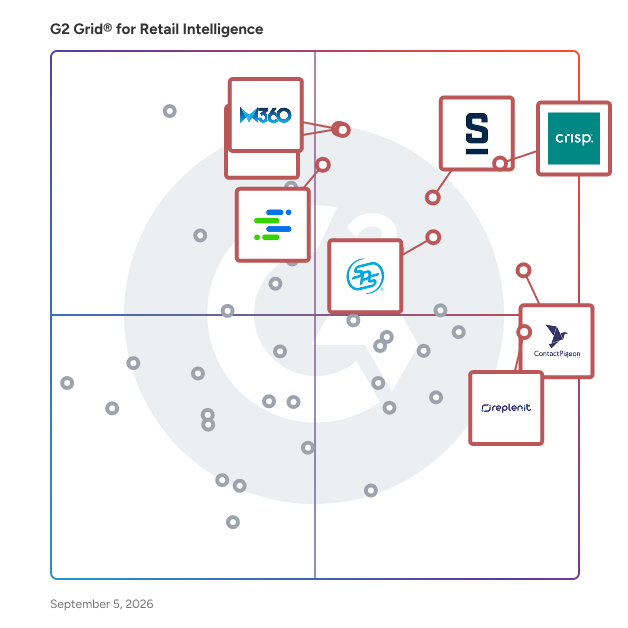
Highlighted products: Crisp Data Platform, ContactPigeon, Stackline, Market360, Board, SPS Commerce Revenue Recovery, Replenit, and Syndigo.
Underlying data: [Grid® JSON](https://www.g2.com/categories/retail-intelligence/grids.json?focus%5B%5D=crisp-data-platform&focus%5B%5D=contactpigeon&focus%5B%5D=stackline&focus%5B%5D=market360&focus%5B%5D=board&focus%5B%5D=sps-commerce-revenue-recovery&focus%5B%5D=replenit&focus%5B%5D=syndigo-syndigo)
Ivy Insights is a fully integrated data analytics solution on the cloud for consumer goods. Our Insights solution delivers clear, crisp, and actionable intelligence to consumer goods companies in real-time data integration and analysis. Our dashboards help depict your data based on a market summary, daily or monthly sales volumes, top SKUs, brand distribution, and more across different markets.
Kalibrate Fuel Planning gives fuel and convenience retailers the insight they need to make confident, data-driven decisions about their networks. Powered by advanced predictive modeling and comprehensive market data, the software helps retailers understand current performance, identify future opportunities, and determine where investment can deliver the greatest return. With Kalibrate Fuel Planning, retailers can forecast the potential performance of new locations before committing capital. Analysis extends beyond fuel volumes to include convenience stores, quick-service restaurants, car washes, EV charging, and other important revenue streams. This creates a more complete understanding of the commercial potential of each location and helps businesses identify whitespace opportunities before competitors. The platform combines more than 100 site characteristics with information about the surrounding competitive environment. Kalibrate’s modeling methodology helps businesses understand why certain locations perform strongly, assess acquisition opportunities, benchmark individual sites and entire networks, and identify locations with additional growth potential. Retailers can also better understand market and site share, recognize market saturation, and prioritize investment accordingly. Scenario modeling enables teams to explore the potential impact of changes before implementing them. Retailers can assess opening or closing locations, adding or removing pumps, upgrading convenience stores, responding to new competitors, or making multiple network changes simultaneously. By understanding potential changes in volume and cannibalization, businesses can make more informed decisions about their capital. Whether the objective is network expansion, optimization, acquisition analysis, rationalization, or long-term strategic planning, Kalibrate Fuel Planning provides a clearer view of opportunities and risks. This allows retailers to move beyond short-term decisions and develop three- and five-year plans designed to strengthen volumes, profitability, and overall network performance.
Kalibrate Fuel Pricing is a fuel pricing software solution that helps fuel retailers set, manage, optimize, and execute fuel prices across individual sites and multi-site networks. The platform is designed for fuel pricing teams that need to make data-driven pricing decisions while balancing business objectives such as fuel volume, margin, and profitability. Kalibrate Fuel Pricing combines pricing automation, configurable business rules, machine learning-based optimization, reporting, and market intelligence in a single platform. Fuel retailers can configure their own unique pricing strategy using more than 100 rules and validations, allowing pricing decisions to reflect their specific market position, operating requirements, and commercial objectives. Teams retain control over recommendations and can review, modify, approve, or reject prices before they are implemented. The platform's optimization capabilities use patented machine learning models to recommend prices in line with a retailers own strategy — based on factors including demand signals, price elasticity, and market changes. Optimization models are trained exclusively on each customer's own data, while recommendations are based on that customer's data, micro-market evaluations, and selected pricing strategy. Customer data and models are segregated and are not shared across customers. Key features and capabilities include: Fuel pricing automation: Create rules for predictable pricing decisions, update multiple sites in bulk, and automate approved prices while maintaining control over pricing strategy. Price optimization: Use machine learning models to generate price recommendations aligned with defined volume, margin, and other pricing objectives. Configurable pricing rules: Apply more than 100 rules and validations to translate an organization's nuanced fuel pricing strategy into repeatable processes. Reporting and analytics: Monitor the impact of pricing decisions on volume, margin, and profitability using dashboards, more than 50 system reports, exports, and API connections. System integrations: Connect with external systems including POS, pumps, price signs, data warehouses, and business intelligence tools through APIs, with the option to send validated prices directly to POS systems. Mobile pricing: Review, set, and approve fuel prices from mobile devices, collect field survey data, and share real-time updates between field and pricing teams. Kalibrate Fuel Pricing is intended for fuel retailers seeking to standardize pricing processes across their network, reduce manual pricing activity, analyze pricing performance, and execute their chosen pricing strategy consistently across locations. It is the software of choice for fuel retailers globally. Operating in 25 countries and sending out millions of prices monthly.
Future-proof tracking, AI-powered Click & View Attribution, and all necessary integrations to restore trust in data for e-commerce shops. Enable your marketing team to optimize the entire funnel for customer acquisition cost (CAC), customer lifetime value (CLTV), or profitability on ad spend. Leading eCommerce companies like AG1, Ankerkraut and Lucardi use Kickbite on a daily basis
Average Rating: 4.6/5.0
Total Reviews: 5
AI-generated summary from verified user reviews
"Finally a single source of truth"
Rating: 4.5/5.0 stars
— Zahari D.
"Essential tool for full funnel optimization"
Rating: 4.0/5.0 stars
— Joram D.
Lucky enables brands to visualize real-time inventory at major retail stores and capture retail attribution data with our products. We work with enterprise retailers like Sephora, Nordstrom, and Walgreens as a data partner for their brands.
Mi9 Intelligence is a robust retail analytics platform suited for enterprise-level retailers that ensures everyone from junior buyers to senior executives has access to hyper-accurate metrics. Mi9 Intelligence dashboards incorporate powerful predictive analytics that can be created and fine-tuned by users on the fly.
Movista transforms how work gets done in retail. Founded by industry veterans who experienced the challenges of managing distributed workforces, Movista created the leading enterprise platform for flawless in-store execution and performance. The Movista platform integrates or replaces a multitude of disparate systems into a single user-friendly, mobile interface. Behind the simple end-user experience is a robust workforce management platform. PLAN - Centralized scheduling, planning and instant store data to help you plan toward demand, resource planning and stocking product. EXECUTE - Our platform houses all project instructions, plans and examples in one location so field employees can plan ahead and spend more time on execution while in the store.Hourly employees cover locations faster and accomplish more per day, which leads to decreased corporate management costs and decreased in-store execution times. VERIFY - Movista gives managers the ability to verify field work in real-time through: Field-rep submitted images Real-time monitoring of field team performance and attendance Geo-fencing / Geolocation of all work done Exception reporting and alerts OPTIMIZE - Increase real-time operational and promotional efficiencies while driving more accurate predictions for procurement, sales forecasts, employee scheduling and marketing strategies.
Average Rating: 4.0/5.0
Total Reviews: 7
"One of the best platform for viewing all in-store operations for retail management"
Rating: 4.5/5.0 stars
— Verified User in Computer Software
"A Great cloud based management retail software"
Rating: 4.0/5.0 stars
— Verified User in Business Supplies and Equipment
We help small CPG manufacturers pinpoint exactly what to do to sell more - without an army of analysts or huge budgets. With Byzzer’s retail analytics platform, you can easily access, visualize, and extract actionable business insights powered by NielsenIQ data. Sign up for free today!
OpenBrand is a durables market measurement and competitive intelligence solution that helps brands and retailers understand market performance, competitive activity, and consumer behavior across key retail categories. It is used by teams that need to track what is changing in the market, understand why performance is moving, and support commercial decisions with more defensible data. The product is designed for durable-goods categories where pricing, promotions, assortment, availability, retailer execution, product attributes, and consumer behavior all influence performance. OpenBrand brings these signals into one working environment so users can analyze market movement across retailers, brands, categories, and products without relying only on spreadsheets, retailer portals, syndicated datasets, or disconnected point solutions. Who Uses OpenBrand? OpenBrand is commonly used by analytics, pricing, consumer insights, competitive intelligence, strategy, category, merchandising, and sales teams inside durable-goods manufacturers and retailers. What are OpenBrand’s Key Use Cases? OpenBrand supports teams that need to: - Measure market share and performance across retailers, categories, brands, and products - Monitor competitive pricing, promotions, assortment, availability, and retail execution signals - Understand purchase drivers, consideration, demographics, brand switching, and shopper behavior - Build reports for executive updates, retailer meetings, pricing reviews, line reviews, and category planning - Support commercial decisions with category-aware data, methodology context, and analyst-backed guidance What Problems Does OpenBrand Help Solve? OpenBrand helps teams move from fragmented market signals to a clearer view of what is happening, why it is happening, and which decisions should follow. Users apply OpenBrand to explain market movement, evaluate competitor actions, identify category or retailer opportunities, and create reporting that can be used across internal and customer-facing conversations.
OptimalCentral is Amazon seller software that integrates business functions into one platform, offering tools for optimization, advertising, operations, and content creation. It audits product listings across three Amazon search layers—A9/A10 keyword ranking, COSMO intent matching, and Alexa for Shopping conversational discovery. Key features include the Listing Audit for diagnostics, AEO Tracker for Alexa visibility monitoring, and Ads Audit to reduce wasted spend and recommend bids. The Profit Dashboard calculates net profit per SKU, factoring in fees, refunds, and ad spend. The Listing Generator benchmarks content against competitors, while the Inventory Planner flags storage-fee risks and calculates reorder quantities. Additional tools include the Keyword Rank Tracker, Product Monitor, and Campaign Builder. Reports and ASINs are analyzed without storing raw data, with an optional API for automatic report retrieval.
OttixHow is a retail sales and competitive analytics platform that uses AI to help retailers, brands, and distributors increase sales and profit margins by using data-driven competitive insights. OttixHow's AI-driven algorithms have a 99% matching accuracy and provide in-depth data intelligence about your products in the competitive marketplace. These insights are delivered through our online platform or can be integrated with your systems directly. OttixHow provides weightage of a match found which will be used to determine the accuracy of a product match. The higher the weightage of the match, the more likely it is that the product match is accurate. This information can be used by retailers to make better decisions about pricing, promotions, and sales.
PriceIntelGuru is a price intelligence platform developed by WebDataGuru to help businesses make accurate, data-driven pricing decisions in competitive markets. Built for retailers, manufacturers, and eCommerce companies, it offers comprehensive tools for competitor price tracking, market trend analysis, product matching, and dynamic pricing optimization. Designed to support pricing and product teams, PriceIntelGuru gathers and analyzes real-time pricing data from various sources, including online retailers, marketplaces, and competitor websites. The platform helps businesses monitor competitor pricing strategies, respond to market changes, and plan more effectively with detailed analytics. Key Features Include: Competitor Price Monitoring: Track real-time competitor pricing across thousands of SKUs and multiple channels. Product Matching: Automatically match identical or similar products across competitor catalogs using AI-driven algorithms for accurate comparisons and price benchmarking. Market Trend Analysis: Understand broader pricing trends across the industry to guide seasonal or promotional pricing strategies. Dynamic Pricing Rules: Set custom pricing rules to automate price adjustments based on competitor actions, inventory levels, or demand fluctuations. Custom Alerts & Reporting: Get notified of relevant pricing changes and access configurable dashboards for easy analysis and reporting. PriceIntelGuru’s product matching capabilities ensure businesses compare like-for-like products across competitors—even when SKUs, descriptions, or attributes vary. This improves the accuracy of price comparisons and enables smarter pricing decisions based on precise data alignment. The platform also supports integration with internal systems and third-party tools via APIs, and data can be delivered in multiple formats. Both technical and non-technical users benefit from its intuitive interface and flexible configuration options. Backed by WebDataGuru’s expertise in AI and machine learning, PriceIntelGuru continuously improves its matching logic and pricing recommendations, ensuring users receive the most relevant insights as the market evolves. Use Cases: Competitive price benchmarking Automated dynamic pricing MAP compliance monitoring Product assortment and pricing gap analysis Multi-channel price tracking with matched product data Now fully aligned under the WebDataGuru brand, PriceIntelGuru complements the company’s broader data extraction and monitoring services. It provides businesses with the tools needed to optimize pricing, improve margins, and strengthen competitive positioning through intelligent, real-time data.
