Best Predictive Analytics Software for Medium-Sized Businesses

How Many Predictive Analytics Software Products Does G2 Track?

Total Products under this Category: 586

Category Stats (Nov 2026)

  • Average Rating: 4.44/5 The average rating of products in this category, based on all submitted ratings
  • Top Trending Product: IFS Copperleaf (+1.9%) - Among all products in this category, IFS Copperleaf recorded the largest rating increase compared to last month

Last updated: November 01, 2026

How Does G2 Rank Predictive Analytics Software Products?

Why You Can Trust G2's Software Rankings:

  • 30 Analysts and Data Experts
  • 34,800+ Authentic Reviews
  • 586+ Products
  • Unbiased Rankings

G2's software rankings are built on verified user reviews, rigorous moderation, and a consistent research methodology maintained by a team of analysts and data experts. Each product is measured using the same transparent criteria, with no paid placement or vendor influence. While reviews reflect real user experiences, which can be subjective, they offer valuable insight into how software performs in the hands of professionals. Together, these inputs power the G2 Score, a standardized way to compare tools within every category.

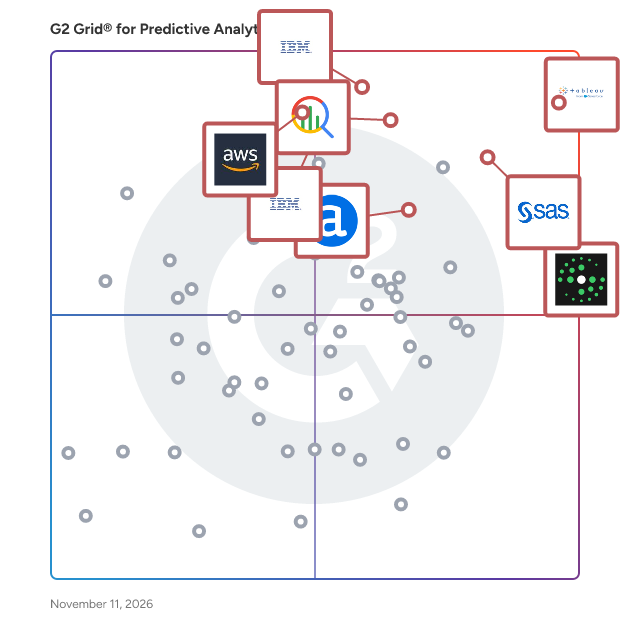
G2 Grid® for Predictive Analytics Software

G2 Grid® for Predictive Analytics Software plotting products by satisfaction and market presence

Highlighted products: Tableau, Salesloft, SAS Viya, Google Cloud BigQuery, IBM Cognos Analytics, Amazon Quick, Alteryx, and IBM SPSS Statistics.

Underlying data: [Grid® JSON](https://www.g2.com/categories/predictive-analytics/grids.json?focus%5B%5D=tableau&focus%5B%5D=salesloft&focus%5B%5D=sas-sas-viya&focus%5B%5D=google-cloud-bigquery&focus%5B%5D=ibm-cognos-analytics&focus%5B%5D=amazon-quick&focus%5B%5D=alteryx&focus%5B%5D=ibm-spss-statistics&segment=mid-market)

Tableau

Tableau is the world’s leading AI-powered analytics platform. Whether you are a business user or an analyst, Tableau turns trusted data into actionable insights. With our flexible, interoperable platform, you can: Turn data into action at scale with human and agent collaboration. Tableau Next delivers agentic AI for faster data-insight-action workflows. It surfaces insights, provides proactive recommendations, and helps you take action in the flow of work. Scale data-driven insights with complete operational confidence. Tableau Cloud enables fully managed analytics at scale. It accelerates your time to value and gives you access to the latest AI-powered innovations. Deploy visual, self-service analytics with unmatched control and flexibility. Tableau Server meets your organization's governance and security needs. It provides enterprise-grade, self-service analytics on-premise or in your private cloud.

Average Rating: 4.4/5.0

Total Reviews: 4,121

How Do G2 Users Rate Tableau?

  • Has the product been a good partner in doing business?: 8.6/10 (Category avg: 8.9/10)
  • AI Text Summarization: 8.0/10 (Category avg: 8.1/10)
  • Algorithms: 8.4/10 (Category avg: 8.6/10)
  • AI Text Generation: 8.0/10 (Category avg: 8.1/10)

Who Is the Company Behind Tableau?

  • Seller: Salesforce
  • Company Website:
  • Year Founded: 1999
  • HQ Location: San Francisco, CA
  • LinkedIn® Page: www.linkedin.com
    89,711 employees on LinkedIn®
  • Ownership: NYSE:CRM

Who Uses This Product?

  • Who Uses This: Data Analyst, Business Analyst
  • Top Industries: Information Technology and Services, Computer Software
  • Company Size: 41% Large, 36% Medium

What Do G2 Reviewers Say About Tableau?

AI-generated summary from verified user reviews

Pros
  • Users appreciate the ease of use in Tableau, allowing quick insights and interactive dashboard creation effortlessly.
  • Users find Tableau's simple and interactive data visualization essential for transforming complex data into actionable insights.
  • Users value the simple and interactive data visualization capabilities of Tableau, enhancing clarity and insights from complex data.
  • Users value Tableau's intuitive design and powerful visualization capabilities that facilitate quick insights and effective decision-making.
  • Users value the intuitive interface of Tableau, enabling effortless creation of engaging, clear data visualizations for insights.
Cons
  • Users experience a steep learning curve with Tableau, requiring time and effort to master its advanced features.
  • Users find the learning difficulty of Tableau challenging, especially for advanced features and new terminology.
  • Users find Tableau to be expensive, especially for small organizations, impacting accessibility and overall affordability.
  • Users experience slow performance with Tableau when processing large datasets, impacting usability and efficiency.
  • Users find formatting and implementation difficult, often feeling overwhelmed when trying to create tables effectively.

What Are Recent G2 Reviews of Tableau?

What Are G2 Users Discussing About Tableau?

Salesloft

Salesloft is the revenue orchestration platform that closes the gap between what revenue teams know and what they do next. Powered by agentic AI, Salesloft's Predictive Revenue System connects live signals from buyer engagement, conversations, deals, and forecast data, turning intelligence into clear, prioritized action. Trusted by more than 4,000 organizations including Adobe, 3M, IBM, and Zoom, Salesloft helps revenue teams move from guesswork to confidence, quarter after quarter.

Average Rating: 4.5/5.0

Total Reviews: 9,677

How Do G2 Users Rate Salesloft?

  • Has the product been a good partner in doing business?: 9.1/10 (Category avg: 8.9/10)
  • Algorithms: 10.0/10 (Category avg: 8.6/10)

Who Is the Company Behind Salesloft?

  • Seller: Salesloft
  • Company Website:
  • Year Founded: 2011
  • HQ Location: Atlanta, GA
  • LinkedIn® Page: www.linkedin.com
    1,098 employees on LinkedIn®

Who Uses This Product?

  • Who Uses This: Account Executive, Sales Development Representative
  • Top Industries: Computer Software, Information Technology and Services
  • Company Size: 51% Medium, 32% Large

What Do G2 Reviewers Say About Salesloft?

AI-generated summary from verified user reviews

Pros
  • Users find Salesloft easy to use, appreciating its convenience in reducing admin tasks and connecting with calendars.
  • Users find Salesloft to be helpful for reducing admin tasks and enhancing productivity with convenient scheduling and analytics.
  • Users value the enhanced human support and seamless CRM integration that boost their productivity and reporting.
  • Users value the automation capabilities of Salesloft, enhancing productivity and simplifying activity tracking within their CRM.
  • Users value the time-saving features of Salesloft, which simplify admin tasks and streamline outreach processes.
Cons
  • Users find the missing features in Salesloft frustrating, particularly for sharing cadences and account hierarchy.
  • Users report call issues with Salesloft, including glitches and lack of VoIP options affecting communication efficiency.
  • Users face integration issues with Salesloft, experiencing email disconnects and security concerns that disrupt workflows.
  • Users find the learning curve steep, especially new SDRs facing challenges with cadences and setup complexities.
  • Users experience technical limitations with Salesloft, including syncing errors and challenges in sharing cadences across teams.

What Are Recent G2 Reviews of Salesloft?

What Are G2 Users Discussing About Salesloft?

SAS Viya

SAS Viya is a cloud-native data and AI platform that enables teams to build, deploy and scale explainable AI that drives trusted, confident decisions. It unites the entire data and AI life cycle and empowers teams to innovate quickly while balancing speed, automation and governance by design. Viya unifies data management, advanced analytics and decisioning in a single platform, so organizations can move from experimentation to production with confidence, delivering measurable business impact that is secure, explainable and scalable across any environment. Key capabilities required to deliver trusted decisions include: • End-to-end clarity across the data and AI life cycle, with built-in lineage, auditability and continuous monitoring to support defensible decisions. • Governance by design, enabling consistent oversight across data, models and decisions to reduce risk and accelerate adoption. • Explainable AI at scale, so insights and outcomes can be understood, validated and trusted by business and regulators alike. • Operationalized analytics, ensuring value continues beyond deployment through monitoring, retraining and life cycle management. • Flexible, cloud-native deployment, allowing organizations to start anywhere and scale everywhere while maintaining control.

Average Rating: 4.3/5.0

Total Reviews: 793

How Do G2 Users Rate SAS Viya?

  • Has the product been a good partner in doing business?: 8.2/10 (Category avg: 8.9/10)
  • AI Text Summarization: 6.7/10 (Category avg: 8.1/10)
  • Algorithms: 8.6/10 (Category avg: 8.6/10)
  • AI Text Generation: 6.3/10 (Category avg: 8.1/10)

Who Is the Company Behind SAS Viya?

  • Seller: SAS Institute
  • Company Website:
  • Year Founded: 1976
  • HQ Location: Cary, NC
  • LinkedIn® Page: www.linkedin.com
    15,122 employees on LinkedIn®
  • Phone: 1-800-727-0025

Who Uses This Product?

  • Who Uses This: Student, Biostatistician
  • Top Industries: Pharmaceuticals, Banking
  • Company Size: 34% Small, 33% Large

What Do G2 Reviewers Say About SAS Viya?

AI-generated summary from verified user reviews

Pros
  • Users enjoy the ease of use of SAS Viya, thanks to its simple syntax and integrated features for analytics.
  • Users commend SAS Viya for its powerful and sophisticated features that enhance data analysis and collaboration across teams.
  • Users value the powerful analytics and integration features of SAS Viya, significantly enhancing data analysis capabilities.
  • Users value the powerful data analysis capabilities of SAS Viya, enhancing efficiency and integration for various tasks.
  • Users value the modern, intuitive user interface of SAS Viya, enhancing productivity with seamless navigation and integration.
Cons
  • Users find the learning difficulty of SAS Viya challenging, especially for beginners due to its complexity and limited resources.
  • Users find SAS Viya has a steep learning curve, making it challenging for newcomers to grasp effectively.
  • Users find SAS Viya's complexity and steep learning curve challenging, hindering effective use and self-learning opportunities.
  • Users find the difficult learning curve of SAS Viya challenging, especially for beginners seeking easier comprehension.
  • Users find the licensing costs of SAS Viya to be prohibitively expensive, especially for features they don't use.

What Are Recent G2 Reviews of SAS Viya?

What Are G2 Users Discussing About SAS Viya?

AI can help you find the answers. G2 helps you trust them.

Connect G2 to Claude or ChatGPT for answers grounded in G2's trusted reviews, comparisons, and pricing from real user insights.

How it works

Google Cloud BigQuery

BigQuery is an AI-ready, petabyte-scale, and cost-effective data warehouse that lets you run analytics over vast amounts of data in near real time. Store 10 GiB of data and run up to 1 TiB of queries for free per month.

Average Rating: 4.5/5.0

Total Reviews: 1,159

How Do G2 Users Rate Google Cloud BigQuery?

  • Has the product been a good partner in doing business?: 8.6/10 (Category avg: 8.9/10)
  • AI Text Summarization: 7.6/10 (Category avg: 8.1/10)
  • Algorithms: 8.8/10 (Category avg: 8.6/10)
  • AI Text Generation: 7.4/10 (Category avg: 8.1/10)

Who Is the Company Behind Google Cloud BigQuery?

  • Seller: Google
  • Year Founded: 1998
  • HQ Location: Mountain View, CA
  • LinkedIn® Page: www.linkedin.com
    301,144 employees on LinkedIn®
  • Ownership: NASDAQ:GOOG
  • Phone: +1 (650) 253-0000

Who Uses This Product?

  • Who Uses This: Data Engineer, Data Analyst
  • Top Industries: Information Technology and Services, Computer Software
  • Company Size: 38% Large, 35% Medium

What Do G2 Reviewers Say About Google Cloud BigQuery?

AI-generated summary from verified user reviews

Pros
  • Users value the ease of use of Google Cloud BigQuery, appreciating its intuitive interface and fast query execution.
  • Users admire the fast query performance of Google Cloud BigQuery, enhancing their experience with large datasets.
  • Users value the fast querying capabilities of Google Cloud BigQuery, enabling efficient analysis of large datasets.
  • Users value the seamless SQL integration of BigQuery, enhancing data analytics in the Google Cloud ecosystem.
  • Users value the query efficiency of Google Cloud BigQuery, enjoying fast performance on large datasets with ease.
Cons
  • Users find the costs can escalate quickly without careful query optimization and monitoring on Google Cloud BigQuery.
  • Users experience query issues leading to escalated costs and unexpected behavior with special characters in BigQuery.
  • Users find that costs can escalate quickly with Google Cloud BigQuery due to unoptimized queries and large datasets.
  • Users report that costs can escalate quickly due to needing careful optimization and monitoring for large-scale queries.
  • Users find the learning curve steep for Google Cloud BigQuery, requiring significant time to master its features.

What Are Recent G2 Reviews of Google Cloud BigQuery?

What Are G2 Users Discussing About Google Cloud BigQuery?

IBM Cognos Analytics

IBM Cognos Analytics is a business intelligence and analytics solution that uses agentic AI to help teams transform trusted data into actionable insights, build governed analytical applications, and make better decisions. Teams can explore data, monitor KPIs, analyze performance, forecast trends, and share insights across the business. The solution is built for business leaders, analysts, report authors, IT teams, and data governance teams that need governed reporting, self-service analytics, data modeling, and flexible deployment options. Common use cases include enterprise reporting, operational reporting, financial reporting, dashboarding, performance management, forecasting, and governed self-service analytics. It supports both centralized BI teams and distributed users who need consistent access to trusted analytics. Key capabilities: 1. Create governed reports and dashboards: Build, schedule, distribute, and manage reports, dashboards, and visualizations for teams, executives, and stakeholders. Support routine reporting, business reviews, and purpose-built analytical applications with consistent information. 2. Explore data with control: Use self-service analytics, certified data models, governed metrics, access controls, and auditability to keep reporting consistent across teams and departments. 3. Analyze and forecast faster: Use natural-language assistance, automated insights, and forecasting to help users understand data faster in supported versions and deployments. 4. Put Reporting Agents to work: Use agentic AI capabilities in supported versions and deployments to find reports, summarize results, share insights, and create or refine reports using natural language. 5. Deploy where the business needs it: Run Cognos Analytics in on-premises, IBM-hosted, hybrid, or certified container environments to align with infrastructure, security, and governance requirements. Cognos Analytics helps organizations reduce repetitive reporting work, improve consistency across metrics and dashboards, and make governed data analytics easier to access across the business.

Average Rating: 4.1/5.0

Total Reviews: 479

How Do G2 Users Rate IBM Cognos Analytics?

  • Has the product been a good partner in doing business?: 7.8/10 (Category avg: 8.9/10)
  • AI Text Summarization: 8.1/10 (Category avg: 8.1/10)
  • Algorithms: 9.0/10 (Category avg: 8.6/10)
  • AI Text Generation: 7.9/10 (Category avg: 8.1/10)

Who Is the Company Behind IBM Cognos Analytics?

  • Seller: IBM
  • Company Website:
  • Year Founded: 1911
  • HQ Location: Armonk, New York, United States
  • LinkedIn® Page: www.linkedin.com
    344,328 employees on LinkedIn®
  • Ownership: SWX:IBM

Who Uses This Product?

  • Who Uses This: Software Engineer, Analyst
  • Top Industries: Information Technology and Services, Financial Services
  • Company Size: 56% Large, 27% Medium

What Do G2 Reviewers Say About IBM Cognos Analytics?

AI-generated summary from verified user reviews

Pros
  • Users appreciate the ease of use of IBM Cognos Analytics, enjoying intuitive navigation and effortless data visualization.
  • Users value the easy report generation in IBM Cognos Analytics, enabling consistent reporting from multiple data sources effortlessly.
  • Users appreciate the powerful AI-driven insights and enterprise-grade reporting capabilities of IBM Cognos Analytics.
  • Users love the drag-and-drop visualization feature in IBM Cognos Analytics for quick and easy data insights.
  • Users appreciate the user-friendly interface of IBM Cognos Analytics, enhancing their ability to analyze and visualize data effortlessly.
Cons
  • Users note a steep learning curve for mastering advanced features, impacting the initial onboarding experience.
  • Users find it difficult to learn and navigate IBM Cognos Analytics, especially for retrieving historical data and building reports.
  • Users often experience slow performance when generating complex reports, requiring frequent resets and causing frustration.
  • Users find the complexity of report building in IBM Cognos Analytics challenging without extensive training.
  • Users often struggle with the complex usage of IBM Cognos Analytics, particularly during onboarding and learning advanced features.

What Are Recent G2 Reviews of IBM Cognos Analytics?

What Are G2 Users Discussing About IBM Cognos Analytics?

Amazon Quick

Amazon QuickSight is a cloud-based unified business intelligence (BI) service at hyperscale. With QuickSight, all users can meet varying analytic needs from the same source of truth through modern interactive dashboards, paginated reports, natural language queries and embedded analytics. With Amazon Q in QuickSight, business analysts and business users can use natural language to build, discover, and share meaningful insights in seconds, turning insights into impact faster. Over 100,000 customers use Amazon QuickSight. Learn more at https://quicksight.aws

Average Rating: 4.3/5.0

Total Reviews: 681

How Do G2 Users Rate Amazon Quick?

  • Has the product been a good partner in doing business?: 8.3/10 (Category avg: 8.9/10)
  • AI Text Summarization: 8.2/10 (Category avg: 8.1/10)
  • Algorithms: 8.1/10 (Category avg: 8.6/10)
  • AI Text Generation: 8.2/10 (Category avg: 8.1/10)

Who Is the Company Behind Amazon Quick?

Who Uses This Product?

  • Who Uses This: Data Analyst, Software Engineer
  • Top Industries: Computer Software, Information Technology and Services
  • Company Size: 40% Small, 36% Medium

What Do G2 Reviewers Say About Amazon Quick?

AI-generated summary from verified user reviews

Pros
  • Users value the seamless integration of Amazon QuickSight with AWS services, enhancing their dashboard creation and management experience.
  • Users find Amazon QuickSight to be easy to use and implement, enhancing their data analysis and visualization experience.
  • Users value the easy integrations of Amazon Quick, allowing seamless interaction with AWS services for effective dashboard creation.
  • Users appreciate the data visualization capabilities of Amazon QuickSight, enhancing clarity and insight in analytics presentations.
  • Users value the easy integration and intuitive design of Amazon QuickSight for building interactive, scalable dashboards.
Cons
  • Users find the limited customization options in Amazon QuickSight frustrating, impacting ease of use and flexibility.
  • Users report a steep learning curve with Amazon QuickSight that hinders initial setup and overall usability.
  • Users often find limited visualization options in Amazon Quick, hindering the ability to customize and analyze data effectively.
  • Users find missing features in QuickSight, particularly in customization and advanced analytics compared to competitors.
  • Users feel the poor interface design hampers usability and needs to be more intuitive and user-friendly.

What Are Recent G2 Reviews of Amazon Quick?

What Are G2 Users Discussing About Amazon Quick?

Alteryx

Alteryx is the agentic analytics and automation company that helps organizations turn complex data into trusted insights, decisions, and action. Built for the people closest to the business, the Alteryx One platform is designed to work across an organization’s existing data and technology ecosystem. It enables business users to produce AI-ready datasets and define, maintain, and update business logic into visual workflows that AI uses to automate operations and insights. This business logic stays visible, understandable, repeatable, and auditable (VURA), so that teams can automate data-intensive workflows without coding. Alteryx closes the last-mile gap between data platforms and the decisions and operations that run the business—giving AI the trusted business context it needs to deliver reliable results. Over 8,000 customers worldwide, including more than half of the Global 2000, rely on Alteryx to improve revenue performance, manage costs, increase operational efficiency, and reduce risk. Collectively, they run more than 380 million workflows on Alteryx each year.

Average Rating: 4.6/5.0

Total Reviews: 932

How Do G2 Users Rate Alteryx?

  • Has the product been a good partner in doing business?: 8.8/10 (Category avg: 8.9/10)
  • AI Text Summarization: 7.2/10 (Category avg: 8.1/10)
  • Algorithms: 8.3/10 (Category avg: 8.6/10)
  • AI Text Generation: 7.0/10 (Category avg: 8.1/10)

Who Is the Company Behind Alteryx?

  • Seller: Alteryx
  • Company Website:
  • Year Founded: 1997
  • HQ Location: Irvine, CA
  • LinkedIn® Page: www.linkedin.com
    2,312 employees on LinkedIn®
  • Ownership: Private

Who Uses This Product?

  • Who Uses This: Data Analyst, Analyst
  • Top Industries: Financial Services, Accounting
  • Company Size: 61% Large, 22% Medium

What Do G2 Reviewers Say About Alteryx?

AI-generated summary from verified user reviews

Pros
  • Users appreciate the ease of use of Alteryx, enabling them to work efficiently without coding expertise.
  • Users appreciate the automation capabilities of Alteryx, enabling efficient workflows and streamlined data processing.
  • Users find Alteryx to be super-intuitive, making complex data analysis and migration tasks significantly easier.
  • Users find Alteryx to be super-intuitive and easy to learn, greatly simplifying their data analysis processes.
  • Users commend Alteryx for its efficiency, with quick workflows and time savings in data preparation and automation.
Cons
  • Users find the expensive licensing costs of Alteryx a barrier for wider adoption and utilization.
  • Users find the learning curve steep, requiring time to grasp all the tools effectively.
  • Users are frustrated with missing features like improved email notifications and bugs in tools during transitions.
  • Users find that mastering advanced tools in Alteryx requires time, affecting overall ease of use.
  • Users experience slow performance with large workflows on Alteryx, impacting efficiency and usability significantly.

What Are Recent G2 Reviews of Alteryx?

IBM SPSS Statistics

IBM SPSS Statistics is an end-to-end statistical solution that simplifies advanced statistical analysis across industries for users of any statistical expertise. It offers comprehensive resources, expert support, and proven reliability to transform complex data into impactful decisions IBM SPSS Statistics recent version 32 release comes up with powerful new features such as AI Output Assistant, Mediation Analysis, Curated Help Designer and many advanced algorithms. IBM SPSS Statistics • offers an easy to use drag and drop interface along with AI Output Assistant to interpret complex statistical output in easy language. • simplifies complex data analysis using advanced statistical techniques that performs data preparation and management, to analysis and reporting. • performs predictive analysis using advanced forecasting procedures to uncover patterns and predict future trends. • creates compelling visual representations to identify trends, derive accurate conclusions and deliver graphs and presentation-ready reports Explore how both individuals and organizations spanning across Industries can simply complex statistical test through an easy to use, accurate ,reliable and secure solution. Use Cases 1. Market Research - Statistical procedures highlighting how to do market research with IBM SPSS 2. Client Acquisition – Emphasizes on how can organizations can acquire more clients and understand consumer behavior 3. Forecasting – Analyze historical sales data, evaluate key trends, predict outcomes relevant to inventory planning 4. Healthcare - Enabling healthcare organizations to improve patient outcomes 5. Government - Empowering Government institutions to take smarter policy decisions 6. Supply Chain - Utilize Statistical Algorithms to make data-driven decisions across procurement, inventory, logistics, and demand planning. Visit here to see what's new in v32 - https://www.ibm.com/products/spss-statistics/whats-new

Average Rating: 4.2/5.0

Total Reviews: 901

G2 Deal: Turn complex data into reliable insights. Get 30% off your first monthly or annual subscriptions. Offer ends 15 April 2026.

Analyze data, forecast trends faster now with AI that interprets results. With IBM SPSS Statistics, you get 30% off your first monthly subscriptions. Offer ends 15 April 2026.

Price: ~~79.00 USD~~ → 55.30 USD

View this exclusive G2 deal

How Do G2 Users Rate IBM SPSS Statistics?

  • Has the product been a good partner in doing business?: 8.0/10 (Category avg: 8.9/10)
  • AI Text Summarization: 10.0/10 (Category avg: 8.1/10)
  • Algorithms: 7.7/10 (Category avg: 8.6/10)
  • AI Text Generation: 10.0/10 (Category avg: 8.1/10)

Who Is the Company Behind IBM SPSS Statistics?

  • Seller: IBM
  • Company Website:
  • Year Founded: 1911
  • HQ Location: Armonk, New York, United States
  • LinkedIn® Page: www.linkedin.com
    344,328 employees on LinkedIn®
  • Ownership: SWX:IBM

Who Uses This Product?

  • Who Uses This: Research Assistant, Assistant Professor
  • Top Industries: Higher Education, Research
  • Company Size: 43% Large, 30% Medium

What Do G2 Reviewers Say About IBM SPSS Statistics?

AI-generated summary from verified user reviews

Pros
  • Users appreciate the ease of use of IBM SPSS Statistics, which simplifies complex analyses with its intuitive interface.
  • Users appreciate the user-friendly interface of IBM SPSS Statistics for executing complex analyses effortlessly.
  • Users value the robust data management capabilities of IBM SPSS Statistics, improving the quality of data analysis significantly.
  • Users commend the intuitive user interface of IBM SPSS Statistics, facilitating smooth navigation and data handling.
  • Users value the analysis capabilities of IBM SPSS Statistics, enhancing credibility and clarity in data presentation.
Cons
  • Users find the IBM SPSS Statistics expensive, with high costs posing challenges for students and smaller teams.
  • Users find the poor visualization in SPSS Statistics unappealing, often leading to the use of alternative tools for better graphics.
  • Users find the learning curve steep, with a cluttered UI and inadequate tutorials hindering their experience with SPSS.
  • Users find the outdated interface of IBM SPSS Statistics unappealing, impacting usability and overall experience negatively.
  • Users frequently face performance issues with SPSS, especially when handling large datasets, leading to slowdowns or crashes.

What Are Recent G2 Reviews of IBM SPSS Statistics?

What Are G2 Users Discussing About IBM SPSS Statistics?

Adobe Analytics

Adobe Analytics empowers marketing, product, and business teams with insights to understand their customers and the journeys they take across digital channels, products, content, and services. From digital data collection and relational clickstream processing to in-depth analysis, and reporting, Adobe Analytics helps you understand visitor engagement across your digital properties — making it possible to optimize digital marketing strategies, improve user experience, and drive business growth. Features: - Collect and ingest behavioral data in real-time from your web and mobile channels. - Automatically convert raw data for unlimited analysis to discover customer patterns, spot anomalies, identify friction in your digital experiences, and uncover insights from digital journeys. - Equip marketers and analysts with AI capabilities that speed through analyses so they can quickly and confidently generate insights to improve the digital experience. - Integrate and share insights, segments, and outputs from your data across other business applications.

Average Rating: 4.2/5.0

Total Reviews: 1,185

How Do G2 Users Rate Adobe Analytics?

  • Has the product been a good partner in doing business?: 8.0/10 (Category avg: 8.9/10)
  • AI Text Summarization: 9.1/10 (Category avg: 8.1/10)
  • Algorithms: 8.6/10 (Category avg: 8.6/10)
  • AI Text Generation: 8.8/10 (Category avg: 8.1/10)

Who Is the Company Behind Adobe Analytics?

  • Seller: Adobe
  • Company Website:
  • Year Founded: 1982
  • HQ Location: San Jose, CA
  • LinkedIn® Page: www.linkedin.com
    42,975 employees on LinkedIn®
  • Ownership: NASDAQ:ADBE

Who Uses This Product?

  • Who Uses This: Data Analyst, Analyst
  • Top Industries: Marketing and Advertising, Information Technology and Services
  • Company Size: 43% Large, 30% Medium

What Do G2 Reviewers Say About Adobe Analytics?

AI-generated summary from verified user reviews

Pros
  • Users value the advanced segmentation and customizable dashboards of Adobe Analytics for effective data analysis and visualization.
  • Users love the advanced segmentation and customizable dashboards in Adobe Analytics, enabling detailed data analysis and visualization.
  • Users value the ease of use in Adobe Analytics, enabled by advanced segmentation and customizable dashboards for efficient data analysis.
  • Users love Adobe Analytics for its advanced segmentation and customizable dashboards, enhancing data analysis and visualization significantly.
  • Users value the customizable reporting in Adobe Analytics, enabling in-depth analysis and meaningful insights for marketing strategies.
Cons
  • Users struggle with a steep learning curve and complex setup in Adobe Analytics, making initial usage challenging.
  • Users often face a steep learning curve with Adobe Analytics, making setup and tracking complex and challenging for newcomers.
  • Users find Adobe Analytics expensive, particularly for smaller teams, and its complex setup adds to the overall burden.
  • Users experience slow performance with Adobe Analytics, especially when handling large datasets, impacting overall efficiency.
  • Users find the complexity of setup in Adobe Analytics challenging, especially for new users and smaller teams.

What Are Recent G2 Reviews of Adobe Analytics?

What Are G2 Users Discussing About Adobe Analytics?

DataRobot

DataRobot’s enterprise AI platform democratizes data science with end-to-end automation for building, deploying, and managing machine learning models. This platform maximizes business value by delivering AI at scale and continuously optimizing performance over time. The company’s proven combination of cutting edge software and world-class AI implementation, training, and support services, empowers any organization – regardless of size, industry, or resources – to drive better business outcomes with AI.

Average Rating: 4.4/5.0

Total Reviews: 52

How Do G2 Users Rate DataRobot?

  • Has the product been a good partner in doing business?: 8.4/10 (Category avg: 8.9/10)
  • AI Text Summarization: 10.0/10 (Category avg: 8.1/10)
  • Algorithms: 8.9/10 (Category avg: 8.6/10)
  • AI Text Generation: 8.3/10 (Category avg: 8.1/10)

Who Is the Company Behind DataRobot?

  • Seller: DataRobot
  • Year Founded: 2012
  • HQ Location: Boston, Massachusetts
  • LinkedIn® Page: www.linkedin.com
    886 employees on LinkedIn®

Who Uses This Product?

  • Top Industries: Computer Software, Information Technology and Services
  • Company Size: 51% Small, 38% Medium

What Are Recent G2 Reviews of DataRobot?

Pecan

Pecan AI is a predictive analytics platform that helps business teams understand what’s likely to happen next, while there is still time to act. With Pecan’s Predictive AI Agent, teams can turn business questions into reliable predictions for use cases like customer churn, demand forecasting, and lifetime value, without relying on long, complex data science projects. The platform automatically handles data preparation, feature engineering, modeling, validation, and delivery, and provides transparent, explainable predictions that integrate into tools like Salesforce, HubSpot, Snowflake, and BI systems to drive real business outcomes.

Average Rating: 4.7/5.0

Total Reviews: 44

How Do G2 Users Rate Pecan?

  • Has the product been a good partner in doing business?: 9.1/10 (Category avg: 8.9/10)
  • Algorithms: 8.7/10 (Category avg: 8.6/10)
  • AI Text Generation: 8.1/10 (Category avg: 8.1/10)

Who Is the Company Behind Pecan?

  • Seller: Pecan.ai
  • Company Website:
  • Year Founded: 2018
  • HQ Location: US, Israel
  • LinkedIn® Page: www.linkedin.com
    89 employees on LinkedIn®

Who Uses This Product?

  • Top Industries: Retail, Computer Software
  • Company Size: 49% Medium, 21% Large

What Do G2 Reviewers Say About Pecan?

AI-generated summary from verified user reviews

Pros
  • Users highlight the ease of use of Pecan, appreciating its supportive customer service and intuitive interface.
  • Users commend the excellent customer support from Pecan, which significantly enhances their overall experience and success.
  • Users value the speed of model-building with Pecan, enabling quick predictive models without a dedicated data science team.
  • Users find Pecan's problem-solving capabilities exceptional, enhancing predictive modeling and streamlining workflows with significant support.
  • Users appreciate the implementation ease of Pecan, highlighting its straightforward setup and user-friendly interface.
Cons
  • Users find the learning difficulty with Pecan can complicate quantifying variables and understanding data structures initially.
  • Users find that Pecan has limited visibility into model logic, complicating custom tuning and understanding model outputs.
  • Users note the limited features of Pecan, highlighting the need for better model visibility and custom tuning options.
  • Users face a learning curve with Pecan, particularly in understanding data and utilizing key features effectively.
  • Users wish for more customization options in Pecan to have better control over model tuning and selection.

What Are Recent G2 Reviews of Pecan?

Qlik Sense

Qlik Sense empowers people to make better data-driven decisions and take action. The solution provides augmented analytics for every business need from visualization and dashboards to natural language analytics, custom and embedded analytics, reporting and alerting. Our unique associative technology enhances human intuition with AI-powered insights, offering unmatched capabilities for combining data and exploring information. It indexes the associations in your data, and exposes related and unrelated values as you click, revealing hidden insights that would be missed by query-based tools. And it performs calculations as fast as you can think. Qlik Sense helps users move from passive to active analytics for real-time collaboration and action. And you get robust data integration, application automation and the convenience of SaaS with hybrid multi-cloud capabilities. See why we’ve been named a Gartner Magic Quadrant Leader for Analytics and BI platforms for 11 years in a row. Visit us at https://www.qlik.com/us/

Average Rating: 4.4/5.0

Total Reviews: 762

How Do G2 Users Rate Qlik Sense?

  • Has the product been a good partner in doing business?: 8.5/10 (Category avg: 8.9/10)
  • AI Text Summarization: 8.3/10 (Category avg: 8.1/10)
  • Algorithms: 8.3/10 (Category avg: 8.6/10)
  • AI Text Generation: 8.5/10 (Category avg: 8.1/10)

Who Is the Company Behind Qlik Sense?

  • Seller: Qlik
  • Year Founded: 1993
  • HQ Location: Radnor, PA
  • LinkedIn® Page: www.linkedin.com
    4,399 employees on LinkedIn®
  • Phone: 1 (888) 994-9854

Who Uses This Product?

  • Who Uses This: Consultant, Analyst
  • Top Industries: Information Technology and Services, Computer Software
  • Company Size: 41% Large, 41% Medium

What Do G2 Reviewers Say About Qlik Sense?

AI-generated summary from verified user reviews

Pros
  • Users appreciate the ease of use of Qlik Sense, benefiting from intuitive interactions and efficient data integration.
  • Users appreciate the robust data visualization capabilities of Qlik Sense, enhancing their data analysis and insights.
  • Users value the impressive analytics capabilities of Qlik Sense, enabling effective data exploration and trend analysis.
  • Users commend the user-friendly interface and dynamic dashboards of Qlik Sense for effective data visualization and insight discovery.
  • Users appreciate Qlik Sense's robust data integration and usability, enhancing exploration and analysis of large datasets effectively.
Cons
  • Users find limited features in Qlik Sense, leading to challenges in dashboard creation and data management.
  • Users note the missing features in Qlik Sense, particularly the need for more automated data updates and extensions.
  • Users find Qlik Sense relatively expensive compared to alternatives like Power BI, impacting overall accessibility.
  • Users find data management cumbersome, especially regarding file handling and the need for manual data refreshing.
  • Users find the learning curve steep, making it challenging for beginners to efficiently navigate Qlik Sense.

What Are Recent G2 Reviews of Qlik Sense?

What Are G2 Users Discussing About Qlik Sense?

Minitab Statistical Software

Minitab Statistical Software is a comprehensive statistical analysis solution designed to assist organizations in understanding their data, identifying opportunities for improvement, and making informed decisions. This software caters to users with varying levels of statistical expertise, offering an intuitive interface that simplifies advanced analysis while providing the necessary depth for analysts to tackle complex questions. With Minitab, users can explore and visualize data, test hypotheses, model relationships, and evaluate process performance through a robust suite of tools, including regression analysis, ANOVA, design of experiments, time series analysis, control charts, capability analysis, and reliability analysis. Targeted at a diverse audience that includes data analysts, quality improvement professionals, and engineers, Minitab is particularly valuable in industries such as manufacturing, healthcare, and R&D. Its guided features, such as the Assistant and Graph Builder, empower users to select the most appropriate analyses for their data and interpret results effectively, making it easier to derive actionable insights. One of the standout features of Minitab is its integration with Minitab Solution Center, a connected, cloud-based platform that enhances the overall analytical process. This platform allows teams to prepare and explore data, conduct statistical analyses, create interactive dashboards, and organize project workflows. By facilitating collaboration and communication, the Solution Center helps teams transition from problem identification to evaluating potential solutions, thus streamlining the entire process of data-driven decision-making. The capabilities offered in Minutab Solution Center work in tandem to provide a cohesive experience for teams engaged in analytical projects. Users can investigate patterns and sources of variation, share insights with stakeholders, and utilize results to inform decisions and drive improvements. Depending on their subscription level, organizations can also access additional tools for process mapping, predictive analytics, and advanced experimentation, further enhancing their analytical capabilities. Minitab Statistical Software stands out in its category by combining user-friendly features with powerful analytical tools, making it an essential resource for organizations aiming to leverage data for strategic decision-making and continuous improvement.

Average Rating: 4.6/5.0

Total Reviews: 221

How Do G2 Users Rate Minitab Statistical Software?

  • Has the product been a good partner in doing business?: 8.6/10 (Category avg: 8.9/10)
  • AI Text Summarization: 7.4/10 (Category avg: 8.1/10)
  • Algorithms: 8.3/10 (Category avg: 8.6/10)
  • AI Text Generation: 7.3/10 (Category avg: 8.1/10)

Who Is the Company Behind Minitab Statistical Software?

  • Seller: Minitab
  • Company Website:
  • Year Founded: 1972
  • HQ Location: State College, Pennsylvania, United States
  • LinkedIn® Page: www.linkedin.com
    732 employees on LinkedIn®

Who Uses This Product?

  • Who Uses This: Quality Manager
  • Top Industries: Automotive, Manufacturing
  • Company Size: 46% Large, 32% Medium

What Do G2 Reviewers Say About Minitab Statistical Software?

AI-generated summary from verified user reviews

Pros
  • Users appreciate the ease of use in Minitab, finding data analysis simple and intuitive for reporting.
  • Users love the intuitive data analysis tools of Minitab, praising its rich visuals and user-friendly features.
  • Users appreciate the ease of statistical analysis with Minitab, highlighting its user-friendly tools and accurate results.
  • Users appreciate the intuitive visuals and user-friendly interface of Minitab, making statistical analysis effortless and efficient.
  • Users value Minitab's robust analysis capabilities, simplifying complex data interpretation for informed decision-making.
Cons
  • Users find Minitab's licensing to be expensive, especially for intermittent use that doesn't justify the cost.
  • Users find the learning curve steep, requiring significant effort to fully utilize Minitab's features efficiently.
  • Users find Minitab to be not user-friendly, particularly struggling with editing graphs and navigating its complex interface.
  • Users find the complexity of Minitab frustrating, as too many options and clicks hinder usability and efficiency.
  • Users feel limited by the restricted features and lack of support in Minitab Statistical Software.

What Are Recent G2 Reviews of Minitab Statistical Software?

What Are G2 Users Discussing About Minitab Statistical Software?

Amazon Forecast

Amazon Forecast is a fully managed service that uses machine learning to deliver highly accurate forecasts.

Average Rating: 4.3/5.0

Total Reviews: 102

How Do G2 Users Rate Amazon Forecast?

  • Has the product been a good partner in doing business?: 8.9/10 (Category avg: 8.9/10)
  • AI Text Summarization: 8.8/10 (Category avg: 8.1/10)
  • Algorithms: 8.7/10 (Category avg: 8.6/10)
  • AI Text Generation: 9.6/10 (Category avg: 8.1/10)

Who Is the Company Behind Amazon Forecast?

Who Uses This Product?

  • Top Industries: Computer Software, Information Technology and Services
  • Company Size: 49% Small, 37% Medium

What Do G2 Reviewers Say About Amazon Forecast?

AI-generated summary from verified user reviews

Pros
  • Users appreciate the ease of use of Amazon Forecast, enabling accurate predictions without needing deep machine learning knowledge.
  • Users value the high accuracy of Amazon Forecast, leveraging advanced ML for reliable time-series predictions and insightful planning.
  • Users appreciate the high accuracy of Amazon Forecast, enabling reliable and efficient time-series predictions without ML expertise.
  • Users appreciate the high accuracy powered by machine learning in Amazon Forecast, enabling reliable and insightful predictions.
  • Users appreciate the high accuracy of Amazon Forecast, enabling reliable forecasts without deep ML expertise.
Cons
  • Users find Amazon Forecast expensive for large datasets or frequent predictions, particularly challenging for smaller businesses to manage.
  • Users find the complexity of Amazon Forecast daunting, particularly during setup and configuration for new users.
  • Users struggle with the steep learning curve of Amazon Forecast, making it challenging for non-AWS users to adapt.
  • Users warn about the high costs associated with scaling Amazon Forecast, especially with large datasets and frequent retraining.
  • Users find that handling large datasets can lead to high costs, requiring careful management to avoid budget issues.

What Are Recent G2 Reviews of Amazon Forecast?

SAP Analytics Cloud

With the SAP Analytics Cloud solution, you can bring together analytics and planning with unique integration to SAP applications and smooth access to heterogenous data sources. As the analytics and planning solution within SAP Business Technology Platform, SAP Analytics Cloud supports trusted insights and integrated planning processes enterprise-wide to help you make decisions without doubt.

Average Rating: 4.2/5.0

Total Reviews: 763

How Do G2 Users Rate SAP Analytics Cloud?

  • Has the product been a good partner in doing business?: 8.3/10 (Category avg: 8.9/10)
  • AI Text Summarization: 8.9/10 (Category avg: 8.1/10)
  • Algorithms: 8.0/10 (Category avg: 8.6/10)
  • AI Text Generation: 8.7/10 (Category avg: 8.1/10)

Who Is the Company Behind SAP Analytics Cloud?

  • Seller: SAP
  • Year Founded: 1972
  • HQ Location: Walldorf
  • LinkedIn® Page: www.linkedin.com
    149,349 employees on LinkedIn®
  • Ownership: NYSE:SAP
  • Phone: +1 (800) 872-1727

Who Uses This Product?

  • Who Uses This: Senior Consultant, Consultant
  • Top Industries: Information Technology and Services, Computer Software
  • Company Size: 48% Large, 28% Medium

What Do G2 Reviewers Say About SAP Analytics Cloud?

AI-generated summary from verified user reviews

Pros
  • Users value the ease of use of SAP Analytics Cloud, facilitating smooth training and effective data management.
  • Users value the integrated data analysis capabilities of SAP Analytics Cloud for seamless reporting and real-time insights.
  • Users appreciate the clean and effective data visualizations in SAP Analytics Cloud that enhance storytelling and reporting.
  • Users value the easy integrations of SAP Analytics Cloud, enhancing data flow and streamlining dashboard creation across teams.
  • Users value the integrated platform of SAP Analytics Cloud, combining BI, planning, and predictive analytics seamlessly.
Cons
  • Users experience slow performance during uploads and when handling large datasets, affecting usability and efficiency.
  • Users find the learning curve steep for SAP Analytics Cloud, particularly for non-technical users needing extra training.
  • Users find the learning difficulty high for SAP Analytics Cloud, requiring technical knowledge and external support for setup.
  • Users often experience performance issues, particularly with slow load times and complexity when handling large datasets.
  • Users often face performance lags with large datasets, making their experience less efficient and frustrating.

What Are Recent G2 Reviews of SAP Analytics Cloud?

What Are G2 Users Discussing About SAP Analytics Cloud?

Bijou Barry
BB
Researched and written by Bijou Barry
Updated