Best Observability Software - Page 3

How Many Observability Software Products Does G2 Track?

Total Products under this Category: 134

Category Stats (Sep 2026)

  • Average Rating: 4.56/5 (↑0.01 vs Aug 2026) The average rating of products in this category, based on all submitted ratings
  • Top Trending Product: Honeycomb (+0.62%) - Among all products in this category, Honeycomb recorded the largest rating increase compared to last month

Last updated: September 05, 2026

How Does G2 Rank Observability Software Products?

Why You Can Trust G2's Software Rankings:

  • 30 Analysts and Data Experts
  • 17,700+ Authentic Reviews
  • 134+ Products
  • Unbiased Rankings

G2's software rankings are built on verified user reviews, rigorous moderation, and a consistent research methodology maintained by a team of analysts and data experts. Each product is measured using the same transparent criteria, with no paid placement or vendor influence. While reviews reflect real user experiences, which can be subjective, they offer valuable insight into how software performs in the hands of professionals. Together, these inputs power the G2 Score, a standardized way to compare tools within every category.

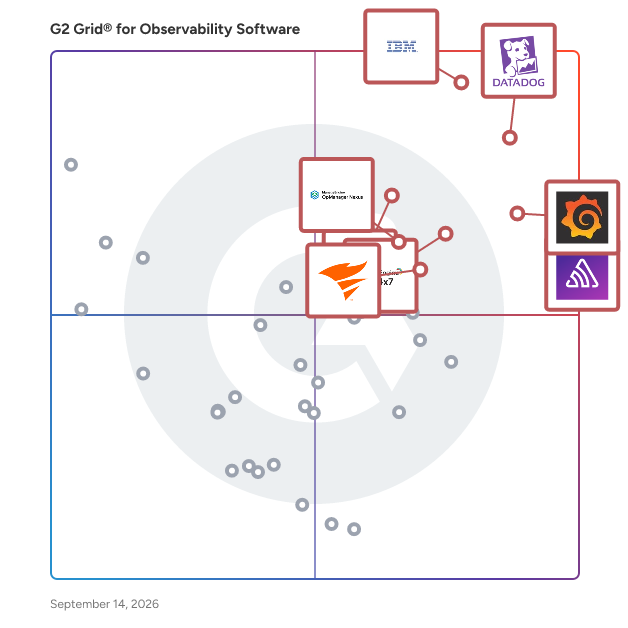
G2 Grid® for Observability Software

G2 Grid® for Observability Software plotting products by satisfaction and market presence

Highlighted products: IBM Instana, Datadog, Sentry, Grafana Labs, Site24x7, Dynatrace, OpManager Nexus, and SolarWinds Observability.

Underlying data: [Grid® JSON](https://www.g2.com/categories/observability-software/grids.json?focus%5B%5D=ibm-instana&focus%5B%5D=datadog&focus%5B%5D=sentry&focus%5B%5D=grafana-labs&focus%5B%5D=site24x7&focus%5B%5D=dynatrace&focus%5B%5D=opmanager-nexus&focus%5B%5D=solarwinds-worldwide-llc-solarwinds-observability)

meshIQ

meshIQ is the enterprise evolution platform purpose-built to transform how organizations manage and optimize their middleware—the digital nervous system of the enterprise. It provides unified visibility, control, and modernization of messaging, event streaming, and B2B transactional flows across all middleware vendors, all environments, and at enterprise scale. Acting as a real-time intelligence layer across your entire ecosystem, meshIQ connects, monitors, and analyzes every message, event, and business transaction with forensic-level insight, so you can run incredibly lean operations with confidence and control. By eliminating the expense, complexity, and manual nature of managing multiple middleware platforms, meshIQ helps enterprises dramatically cut OPEX, resolve incidents and disputes up to 70% faster, reduce manual reconciliation efforts, and accelerate service delivery. The platform also provides a safe, fast, and reliable path to modernize middleware and migrate to modern architectures such as Apache Kafka®, ActiveMQ®, and cloud-native environments—without disruption. And with built-in B2B Flow Intelligence, organizations can assure every business transaction to safeguard revenue, meet regulatory requirements, and protect customer trust and experiences.

Average Rating: 4.6/5.0

Total Reviews: 99

Who Is the Company Behind meshIQ?

  • Seller: meshIQ
  • Company Website:
  • Year Founded: 1994
  • HQ Location: Plainview, NY
  • LinkedIn® Page: www.linkedin.com
    60 employees on LinkedIn®

Who Uses This Product?

  • Who Uses This: Software Engineer
  • Top Industries: Banking, Information Technology and Services
  • Company Size: 43% Large, 37% Medium

What Do G2 Reviewers Say About meshIQ?

AI-generated summary from verified user reviews

Pros
  • Users value the ease of use of meshIQ, enjoying its intuitive design and seamless integration across platforms.
  • Users value the real-time monitoring of meshIQ, enabling quick issue detection and enhanced operational efficiency.
  • Users value the intuitive user interface of meshIQ, enabling quick insights and ease of use for everyone.
  • Users value the deep visibility meshIQ provides into middleware, enhancing monitoring and troubleshooting efficiency significantly.
  • Users appreciate the deep visibility into middleware environments, simplifying monitoring and troubleshooting processes significantly.
Cons
  • Users find the difficult learning curve of meshIQ overwhelming due to its powerful features and complex interface.
  • Users find the steep learning curve of meshIQ challenging due to its powerful but overwhelming features.
  • Users find meshIQ's complexity daunting, especially during initial setup and configuration for new users.
  • Users face difficult configuration with meshIQ, finding the setup time-consuming and the WebUI challenging to navigate.
  • Users find the learning difficulty of meshIQ challenging, particularly during initial setup and advanced feature utilization.

What Are Recent G2 Reviews of meshIQ?

Gearset DevOps

Gearset is the global leader in Salesforce DevOps. It’s a DevOps platform that helps organizations manage, automate, and govern the full Salesforce development lifecycle, from planning and deployment to testing, data management, and compliance. The platform is designed for Salesforce teams that need reliable, scalable DevOps processes across complex org environments. Gearset is used by mid-market and enterprise organizations across regulated and non-regulated industries, including healthcare, financial services, insurance, and technology. Typical users include Salesforce administrators, developers, DevOps engineers, release managers, and platform owners responsible for maintaining deployment quality, security, and operational consistency. The platform supports a wide range of Salesforce use cases, including metadata and CPQ deployments, CI/CD automation, code review workflows, sandbox seeding, test automation, and monitoring. As well as deployment automation, Gearset includes tools for Salesforce data protection and long-term data management, such as automated backups, data restore, and archiving. Observability and Org Intelligence features provide insight into org health, deployment risk, and system changes over time. Gearset also includes governance and compliance capabilities designed for enterprise environments. These features help teams maintain audit readiness and enforce access controls while supporting compliance frameworks such as SOX, ISO, HIPAA, and GDPR. The platform is delivered as a managed service and integrates with Salesforce environments without requiring complex local infrastructure. Key features and capabilities include: - Salesforce metadata, CPQ, and data deployments with CI/CD automation and version control integration - Code review, test automation, and release validation to support quality and consistency - Automated Salesforce backups, restore, and data archiving for data protection and retention - Sandbox seeding, observability, and Org Intelligence to support environment management and visibility - Governance features including audit trails, role-based access controls, and compliance support Gearset is a Salesforce Partner and has supported Salesforce teams globally since 2015. The platform is used by organizations managing multiple orgs (across regions), frequent releases, and complex compliance requirements, helping teams reduce deployment risk, improve operational visibility, and maintain control over Salesforce change management processes.

Average Rating: 4.7/5.0

Total Reviews: 305

Who Is the Company Behind Gearset DevOps?

  • Seller: Gearset
  • Company Website:
  • Year Founded: 2015
  • HQ Location: Cambridge, Cambridgeshire
  • Twitter: @GearsetHQ
    1,182 Twitter followers
  • LinkedIn® Page: www.linkedin.com
    369 employees on LinkedIn®

Who Uses This Product?

  • Who Uses This: Salesforce Developer, Salesforce Administrator
  • Top Industries: Information Technology and Services, Computer Software
  • Company Size: 36% Medium, 33% Small

What Do G2 Reviewers Say About Gearset DevOps?

AI-generated summary from verified user reviews

Pros
  • Users praise the ease of use of Gearset DevOps, highlighting smooth setup and effective features for efficient deployments.
  • Users value the automation and ease of deployment with Gearset, significantly enhancing efficiency and reducing errors.
  • Users appreciate the easy deployment capabilities of Gearset DevOps, which streamline CI/CD processes and validations effortlessly.
  • Users commend the exceptional customer support from Gearset DevOps, highlighting prompt assistance and engagement with feature requests.
  • Users value the deployment ease of Gearset DevOps, enabling swift setup and efficient management of releases.
Cons
  • Users face deployment issues requiring manual activation of Flows and cautious management of production metadata changes.
  • Users find Gearset DevOps expensive, particularly for larger teams, affecting its accessibility despite its high quality.
  • Users find complexity in custom filters and CI/CD processes, wishing for enhanced automation and streamlined operations.
  • Users face limitations in data management, as some metadata and object settings fail to transfer accurately between environments.
  • Users express disappointment over the missing features in Gearset DevOps, particularly the lack of automated dependency tracking.

What Are Recent G2 Reviews of Gearset DevOps?

Lumigo

Lumigo is a cloud native observability and debugging platform purpose-built for serverless and containerized applications. With best-in-breed distributed tracing, Lumigo helps developers and engineers navigate the complexities of highly distributed cloud applications with confidence. Deployed with zero code changes, Lumigo connects every component in modern applications, from AWS serverless and containerized services to 3rd party integrations, making it easy and quick to find and fix bugs, errors or performance issues. Visual Debugging - With no manual code changes, Lumigo visualizes your entire environment, including your containers, Lambdas, AWS managed services, and every API call to third parties. One-Click Distributed Tracing - Go beyond just metrics and logs with Lumigo’s visual stack trace of the entire request or transaction that you can seamlessly navigate to find the root cause of issues in seconds. Identify & Remove Performance Bottlenecks- Easily surface critical insights about your serverless and containerized applications to understand system health, explore performance issues, lower costs and remove bottlenecks. Serverless-Specific Smart Alerts- Predictive analytics identifies issues before they impact performance or end-users and sends alerts directly to Slack, email or any other tool in your workflow. Clear View of Your Architecture- Forget whiteboards. Lumigo provides a visual, always up-to-date view of your entire architecture. Works with your Existing Toolchain- Whether it's alerted to Slack, Microsoft Teams, VictorOps or PagerDuty, the ability to create issues directly in Jira or deploy via Terraform or Serverless Framework, Lumigo plays nice with your eco-system. Get up & running in minutes——start free! https://lumigo.io

Average Rating: 4.8/5.0

Total Reviews: 83

Who Is the Company Behind Lumigo?

  • Seller: Lumigo
  • Year Founded: 2018
  • HQ Location: San Francisco, California
  • Twitter: @Lumigo
    1,977 Twitter followers
  • LinkedIn® Page: www.linkedin.com
    11 employees on LinkedIn®

Who Uses This Product?

  • Top Industries: Computer Software, Information Technology and Services
  • Company Size: 57% Small, 34% Medium

What Are Recent G2 Reviews of Lumigo?

What Are G2 Users Discussing About Lumigo?

Pandora FMS

Pandora FMS is a unified monitoring and observability platform designed to consolidate visibility, alerting, reporting, and automation across heterogeneous IT environments. Instead of combining multiple point tools for networks, servers, applications, and cloud services, Pandora FMS centralizes data collection and operational workflows in a single console, reducing integration effort and operational complexity in on-premise, hybrid, and multi-cloud architectures. The platform collects telemetry using multiple methods, including agents, remote checks, standard protocols (e.g., SNMP/WMI), APIs, and log/event ingestion. This enables teams to monitor infrastructure and services end-to-end, correlate signals, and maintain consistent alerting policies and dashboards across distributed estates. Pandora FMS also supports capacity and trend analysis to anticipate resource constraints and identify recurring patterns, and includes AI-assisted capabilities for anomaly detection and automated thresholds to surface hard-to-spot operational signals. Pandora FMS is extensible through a large plugin ecosystem (500+ plugins and integrations), covering a wide range of enterprise and infrastructure technologies such as SAP, Oracle, Citrix, JBoss, VMware, AWS, SQL Server, Red Hat, and WebSphere. This extensibility helps organizations standardize monitoring across legacy and modern stacks without redesigning their monitoring approach per technology. Core capabilities: -Unified monitoring for networks, servers, applications, cloud services, endpoints, and logs -Centralized alerting, event correlation, dashboards, and scheduled reporting -Flexible data collection via agents, remote checks, APIs, and plugins -Scalability for distributed environments and large numbers of monitored elements -Analytics for trend/capacity planning plus AI-assisted anomaly detection and dynamic thresholds -A key differentiator is direct vendor support, which simplifies escalation and ensures continuity of expertise for deployment, tuning, and ongoing operations.

Average Rating: 4.6/5.0

Total Reviews: 212

Who Is the Company Behind Pandora FMS?

  • Seller: Pandora FMS
  • Company Website:
  • Year Founded: 2004
  • HQ Location: Madrid, Spain
  • Twitter: @pandorafms
    5,458 Twitter followers
  • LinkedIn® Page: www.linkedin.com
    56 employees on LinkedIn®

Who Uses This Product?

  • Who Uses This: Data Analyst
  • Top Industries: Information Technology and Services, Telecommunications
  • Company Size: 50% Medium, 37% Small

What Do G2 Reviewers Say About Pandora FMS?

AI-generated summary from verified user reviews

Pros
  • Users value the reliable remote monitoring capabilities of Pandora FMS, ensuring seamless oversight of their systems.
  • Users enjoy the ease of use of Pandora FMS, appreciating its intuitive interface and reliable support.
  • Users value the real-time monitoring capabilities of Pandora FMS, enhancing visibility of all network devices effortlessly.
  • Users value the flexibility and adaptability of Pandora FMS, making it suitable for diverse IT monitoring needs.
  • Users value the versatility of network monitoring in Pandora FMS, effectively managing diverse devices and environments.
Cons
  • Users find the learning curve steep, particularly with initial setup and complex functionalities of Pandora FMS.
  • Users find the complex setup of Pandora FMS challenging, particularly due to compatibility issues and steep learning curves.
  • Users note the learning difficulty with Pandora FMS, especially for those lacking technical expertise for setup and configuration.
  • Users find the complex configuration of Pandora FMS challenging, especially without extensive technical expertise.
  • Users face a difficult learning curve with Pandora FMS, which can hinder effective usage for beginners.

What Are Recent G2 Reviews of Pandora FMS?

What Are G2 Users Discussing About Pandora FMS?

Luciq

Luciq is an Agentic Observability Platform specifically designed for AI mobile builders, aimed at assisting enterprise teams in delivering seamless app experiences at scale. This innovative solution leverages autonomous AI agents to identify anomalies, prioritize critical issues, and implement resolutions automatically, often before users are even aware of any problems. By transforming observability from a passive monitoring approach to a proactive action-oriented system, Luciq empowers teams to focus on building impactful features rather than merely fixing issues. Targeted primarily at enterprise-level organizations, Luciq caters to teams that require robust tools for maintaining app performance and user satisfaction. The platform is particularly beneficial for mobile developers, product managers, and ai teams who need to ensure that their applications function flawlessly in a competitive landscape. With its lightweight SDK that integrates in mere minutes, Luciq provides comprehensive visibility into app health, including performance anomalies, user signals, and session replays, enabling teams to make informed decisions based on real-time data. One of the standout features of Luciq is SmartResolve, which automates root cause analysis and generates actionable fixes. This capability significantly reduces the time spent on debugging, allowing teams to address issues swiftly and efficiently. Furthermore, Luciq’s Business Impact Dashboard offers insights into real-time experience metrics, correlating app performance with key business outcomes such as retention, revenue, and growth. This feature equips teams with the necessary data to understand how app performance directly influences their business objectives. Luciq is built to enhance enterprise workflows by ensuring that insights and fixes are delivered to the appropriate teams automatically. Its native integrations with popular tools like GitHub, Jira, Slack, and Zendesk facilitate seamless collaboration among team members, streamlining the process of addressing app issues. Additionally, Luciq adheres to enterprise-grade compliance standards, including SOC 2, HIPAA, and GDPR, ensuring that sensitive data remains secure throughout the observability process. As a trusted solution among global mobile leaders, Luciq not only helps teams accelerate their development cycles but also minimizes user churn and consistently delivers experiences that delight users while safeguarding revenue. By providing a comprehensive observability platform that combines advanced AI capabilities with user-centric features, Luciq stands out as a valuable asset for any enterprise aiming to enhance its mobile application performance.

Average Rating: 4.3/5.0

Total Reviews: 231

Who Is the Company Behind Luciq?

  • Seller: Luciq
  • Company Website:
  • Year Founded: 2014
  • HQ Location: California, USA
  • LinkedIn® Page: www.linkedin.com
    201 employees on LinkedIn®

Who Uses This Product?

  • Who Uses This: Software Engineer, Android Developer
  • Top Industries: Computer Software, Information Technology and Services
  • Company Size: 61% Small, 27% Medium

What Do G2 Reviewers Say About Luciq?

AI-generated summary from verified user reviews

Pros
  • Users appreciate the ease of use of Luciq, enabling quick diagram creation and effortless data visualization.
  • Users appreciate the effective bug detection capabilities of Luciq, enhancing auto diagnostics and server performance management.
  • Users value the efficiency of Luciq, finding it easy to manage and track important data effortlessly.
  • Users find it easy to identify errors and report bugs quickly with Luciq's features, enhancing their troubleshooting experience.
  • Users value the excellent customer relations and effective feedback tools provided by Luciq for enhanced diagnostics.
Cons
  • Users report a lack of necessary features in Luciq, hindering efficient problem resolution and issue management.
  • Users find the lack of tools for managing screenshots and AI features limits their efficiency and workflow.
  • Users struggle with memory leak bugs in Luciq, making troubleshooting and battery-related issues challenging.
  • Users are frustrated by the delays in accessing screenshots for reproduction steps, hindering efficient troubleshooting.
  • Users find Luciq to be expensive, which may limit its accessibility for some potential customers.

What Are Recent G2 Reviews of Luciq?

What Are G2 Users Discussing About Luciq?

Scout Monitoring

Scout Monitoring is application performance monitoring that streamlines troubleshooting by helping developers find and fix performance issues before customers ever see them. With real-time alerting, a developer-centric UI, and tracing that ties bottlenecks directly to source code, Scout helps teams spend less time debugging and more time building great products. Quickly identify, prioritize, and resolve issues like memory bloat, N+1 queries, slow database queries, and related performance problems using lightweight instrumentation with minimal overhead. Built for developers, by developers, Scout supports Ruby, PHP, Python, and Elixir applications and provides a unified view of application performance, errors, and logs with simple, transparent pricing.

Average Rating: 4.6/5.0

Total Reviews: 73

Who Is the Company Behind Scout Monitoring?

  • Seller: Scout Monitoring
  • Year Founded: 2008
  • HQ Location: Fort Collins, CO
  • Twitter: @ScoutAPM
    1,777 Twitter followers
  • LinkedIn® Page: www.linkedin.com
    21 employees on LinkedIn®

Who Uses This Product?

  • Who Uses This: Founder, CTO
  • Top Industries: Computer Software, Information Technology and Services
  • Company Size: 61% Small, 35% Medium

What Do G2 Reviewers Say About Scout Monitoring?

AI-generated summary from verified user reviews

Pros
  • Users value the clear and digestible insights provided by Scout Monitoring, which enhance team efficiency at a fair price.
  • Users appreciate the efficiency of Scout Monitoring, as it simplifies identifying and addressing performance issues swiftly.
  • Users find Scout Monitoring to have a simple setup and digestible insights, making it easy to use effectively.
  • Users appreciate the comprehensive toolset of Scout Monitoring for analyzing performance and enhancing application insights.
  • Users appreciate how Scout Monitoring provides actionable performance insights, effectively highlighting critical issues for efficient resolution.
Cons
  • Users find the missing features of Scout Monitoring, like advanced error insights and higher transaction limits, limiting.
  • Users report compatibility issues with Scout Monitoring, particularly with support for non-Ruby on Rails technologies.
  • Users feel that pricing issues persist with Scout Monitoring, suggesting it may not match competitors' offerings.
  • Users believe the pricing is too high and feel that documentation needs enhancements for better clarity.
  • Users face challenges due to filtering issues with Scout Monitoring, limiting support for diverse technologies beyond Ruby on Rails.

What Are Recent G2 Reviews of Scout Monitoring?

What Are G2 Users Discussing About Scout Monitoring?

Splunk Observability Cloud

Splunk Observability Cloud is a comprehensive, real-time monitoring and troubleshooting platform designed to provide full-stack visibility across any environment. By integrating application performance monitoring, infrastructure monitoring, and digital experience monitoring, it enables organizations to detect and resolve issues swiftly, ensuring optimal system performance and enhanced user experiences. Built on OpenTelemetry standards, Splunk Observability Cloud offers AI-driven insights and analytics, facilitating proactive management of complex, distributed systems. Key Features and Functionality: - Application Performance Monitoring (APM): Identifies and addresses application issues by combining related data into intuitive visuals, accelerating mean time to resolution (MTTR). - Infrastructure Monitoring: Provides instant visibility and real-time alerts to improve hybrid cloud performance. - Digital Experience Monitoring: Delivers insights into frontend performance through Real User Monitoring and Synthetic Monitoring, ensuring seamless user experiences. - AI-Powered Analytics: Utilizes machine learning-driven features like Service Maps and Trace Analytics to offer guided troubleshooting and faster issue resolution. - OpenTelemetry-Native: Ensures data ownership and control, preventing vendor lock-in and allowing consistent instrumentation across applications. - No Data Sampling: Collects and analyzes 100% of data with NoSample™ tracing, eliminating blind spots. - Log Observer Connect: Correlates logs stored in Splunk Platform with real-time metrics and traces, providing deeper context for software behavior. Primary Value and Problem Solving: Splunk Observability Cloud addresses the challenges of monitoring and managing complex, distributed systems by offering unified visibility and real-time troubleshooting capabilities. It empowers organizations to: - Accelerate Issue Resolution: By correlating metrics, traces, and logs, teams can quickly identify root causes, reducing downtime and improving system reliability. - Enhance User Experiences: Continuous monitoring of digital experiences ensures that performance issues are detected and resolved before impacting end-users. - Optimize Operational Efficiency: AI-driven insights and automated analytics streamline troubleshooting processes, allowing teams to focus on innovation rather than firefighting. - Maintain Data Control: The OpenTelemetry-native approach provides flexibility and prevents vendor lock-in, enabling organizations to adapt and scale their observability practices as needed. By integrating these capabilities, Splunk Observability Cloud enables organizations to maintain high system performance, deliver exceptional user experiences, and drive continuous innovation.

Average Rating: 4.3/5.0

Total Reviews: 55

Who Is the Company Behind Splunk Observability Cloud?

  • Seller: Cisco
  • Year Founded: 1984
  • HQ Location: San Jose, CA
  • Twitter: @Cisco
    720,366 Twitter followers
  • LinkedIn® Page: www.linkedin.com
    95,294 employees on LinkedIn®
  • Ownership: NASDAQ:CSCO

Who Uses This Product?

  • Top Industries: Information Technology and Services, Computer Software
  • Company Size: 38% Large, 33% Small

What Do G2 Reviewers Say About Splunk Observability Cloud?

AI-generated summary from verified user reviews

Pros
  • Users value the detailed insights and analytics from Splunk Observability Cloud, enhancing performance and health monitoring of infrastructure.
  • Users value the efficient logging capabilities of Splunk Observability Cloud for insightful log analytics and security checks.
  • Users find Splunk Observability Cloud to be extremely user-friendly, streamlining tasks and enhancing efficiency in monitoring.
  • Users praise the robust logging and alerting features of Splunk Observability Cloud for enhanced data insights.
  • Users value the efficient logging capabilities of Splunk Observability Cloud, providing detailed insights and intelligent alerting.
Cons
  • Users find the pricing too expensive, suggesting a need for more economical options to increase accessibility.
  • Users find the pricing issues significant, citing high costs and a lack of training resources for effective use.
  • Users find the steep learning curve of Splunk Observability Cloud challenging, requiring time and prior knowledge to master.
  • Users find the complex setup of Splunk Observability Cloud challenging, making it difficult to effectively utilize the tool.
  • Users find the difficult learning curve of Splunk Observability Cloud challenging, especially for beginners requiring time to adapt.

What Are Recent G2 Reviews of Splunk Observability Cloud?

What Are G2 Users Discussing About Splunk Observability Cloud?

SUSE Rancher

SUSE Rancher is a complete Kubernetes management platform that simplifies how teams deploy, manage, and secure clusters across any infrastructure on-prem, in the cloud, or at the edge. It brings centralized authentication, policy enforcement, visibility, and tooling together in one place so platform teams can manage the full Kubernetes lifecycle without jumping between systems. You can run SUSE Rancher as a free community edition, or choose Rancher Prime for enterprise support and security, or Rancher Suite to combine Rancher with integrated observability, storage, and virtualization. Why teams use SUSE Rancher Cluster management that scales Manage all your Kubernetes clusters across different clouds, data centers, and even edge devices from one dashboard. Provision new clusters, apply global policies, and monitor everything from a central control plane. Works anywhere Rancher supports any certified Kubernetes distro. Use it with upstream Kubernetes, RKE2, EKS, AKS, GKE, K3s, or even vSphere. You get the same control and experience everywhere. Simple, secure app deployment Use Helm or the built-in SUSE Application Collection to deploy apps across one or many clusters. You can enforce consistent policies and get visibility into health and performance. What you get Centralized cluster lifecycle management Create, upgrade, scale, and delete clusters across environments with a few clicks or API calls. Automate Day 2 operations like backups, upgrades, and monitoring. Built-in authentication and access control Integrates with your identity provider (LDAP, AD, SAML, OIDC) and gives you fine-grained RBAC controls for all clusters. Policy and compliance management Use pre-built Kubewarden policies or write your own to enforce security and operational best practices across your fleet. Extensible platform Extend Rancher with your own tools or use community and partner-developed extensions. Easily add monitoring, logging, backup, and more through the UI. Enterprise support and ecosystem With Rancher Prime, you get access to SUSE’s private container registry, hardened images, long-term support, and expert services. Rancher Suite bundles this with enterprise observability, storage (Longhorn), and virtualization (KubeVirt-based). Who it’s for SUSE Rancher is for organizations running Kubernetes at scale. Whether you’re just getting started with containers or managing hundreds of clusters, Rancher helps platform teams simplify operations, secure infrastructure, and enable developer self-service without compromising visibility or control. Use the Community Edition to start for free, or step up to Rancher Prime or Rancher Suite for full enterprise-grade capabilities and support.

Average Rating: 4.4/5.0

Total Reviews: 158

Who Is the Company Behind SUSE Rancher?

  • Seller: SUSE
  • Company Website:
  • Year Founded: 1992
  • HQ Location: Nürnberg, DE
  • Twitter: @SUSE
    64,779 Twitter followers
  • LinkedIn® Page: www.linkedin.com
    2,718 employees on LinkedIn®

Who Uses This Product?

  • Who Uses This: DevOps Engineer, Senior DevOps Engineer
  • Top Industries: Information Technology and Services, Telecommunications
  • Company Size: 44% Large, 29% Medium

What Do G2 Reviewers Say About SUSE Rancher?

AI-generated summary from verified user reviews

Pros
  • Users value the ease of setting up Kubernetes clusters with SUSE Rancher, enhancing operational efficiency and management.
  • Users value the ease of managing clusters with SUSE Rancher, enhancing integration and orchestration efficiency.
  • Users love the versatile and powerful features of SUSE Rancher, enhancing cluster management and application deployment.
  • Users find the intuitive user interface of SUSE Rancher simplifies managing Kubernetes clusters effectively.
  • Users commend the excellent customer support from SUSE, appreciating the highly responsive and committed service provided.
Cons
  • Users find the complexity of SUSE Rancher's setup and configuration challenging, especially for Kubernetes newcomers.
  • Users find the complex setup of SUSE Rancher challenging, especially for those unfamiliar with Kubernetes.
  • Users find the configuration complexity of SUSE Rancher challenging, especially for those new to Kubernetes.
  • Users face a difficult learning curve with SUSE Rancher, challenging for those unfamiliar with Kubernetes and advanced configurations.
  • Users experience latency issues with SUSE Rancher, particularly when managing large clusters or during high load times.

What Are Recent G2 Reviews of SUSE Rancher?

What Are G2 Users Discussing About SUSE Rancher?

Lightrun

Named 2021 Gartner Cool Vendor, Lightrun builds an IDE-native observability & debugging platform that enables developers to securely add logs, metrics and traces to production and staging environments in real time, on demand. No hotfixes, redeployments or restarts required. Developers use Lightrun for multiple code-level observability needs, including: * Code-level alerts (Java, Node.js, Python, .NET) * Feature verification * Testing / debugging in production * Troubleshooting cloud native apps, Serverless, and more * Log optimization capabilities through a Log Optimizer(TM) By eliminating the need to reproduce bugs locally or issue a new software version for adding new logs or metrics to troubleshoot production issues, Lightrun's customers consistently reduce their MTTR by up to 50-60% and significantly improve development productivity. Issues that used to take 1-2 weeks to mitigate now take our customers on average less than an hour to solve. Lightrun empowers our customers' developers by eliminating the need for costly developer lifecycle operations like reproducing locally, or issuing a new software version just for adding new logs or metrics. Our customers, running petabyte-scale workloads with QPS in the high 100Ks across thousands of production servers, include companies that reach 44.5% of the internet's population and major, publicly-traded cybersecurity companies.

Average Rating: 4.8/5.0

Total Reviews: 67

Who Is the Company Behind Lightrun?

  • Seller: Lightrun
  • Year Founded: 2019
  • HQ Location: Tel Aviv, IL
  • Twitter: @Lightruntech
    282 Twitter followers
  • LinkedIn® Page: www.linkedin.com
    84 employees on LinkedIn®

Who Uses This Product?

  • Top Industries: Computer Software, Information Technology and Services
  • Company Size: 43% Medium, 28% Large

What Do G2 Reviewers Say About Lightrun?

AI-generated summary from verified user reviews

Pros
  • Users value Lightrun for its easy integrations, enhancing real-time debugging and streamlining workflows effortlessly.
  • Users value the IDE integration of Lightrun, enhancing real-time debugging efficiency in production environments.
  • Users find Lightrun's ease of use facilitates intuitive real-time debugging, enhancing their development workflow significantly.
  • Users commend Lightrun for its performance optimization, enabling efficient real-time debugging directly in production environments.
  • Users value the time-saving capabilities of Lightrun, enabling quick troubleshooting and reducing debugging complexity.
Cons
  • Users seek improvements in UI and better documentation for a more effective debugging experience with Lightrun.
  • Users note that the poor UI design hinders functionality, calling for improvements to enhance usability and integration.
  • Users note that the UX could be significantly improved with better UI and user-friendly features for efficiency.
  • Users find the learning curve steep, particularly due to the IDE plugin difficulties and compiler limitations.
  • Users note that the UI needs improvement, suggesting enhancements for a better experience across platforms.

What Are Recent G2 Reviews of Lightrun?

What Are G2 Users Discussing About Lightrun?

Bronto

Bronto is the intelligent observability platform built for modern engineering teams. We unify logs, metrics, and traces in one place, then layer AI on top to investigate incidents, surface root causes, and turn raw telemetry into clear answers. Teams use Bronto to cut through alert noise, accelerate root-cause analysis, and ship reliable software with confidence.

Average Rating: 4.7/5.0

Total Reviews: 6

Who Is the Company Behind Bronto?

Who Uses This Product?

  • Company Size: 83% Medium, 17% Small

What Are Recent G2 Reviews of Bronto?

groundcover

Observability, for the Cloud. Monitor everything you run in your cloud without compromising on cost, granularity, or scale.

Average Rating: 4.8/5.0

Total Reviews: 26

Who Is the Company Behind groundcover?

Who Uses This Product?

  • Top Industries: Computer Software
  • Company Size: 50% Medium, 38% Small

What Do G2 Reviewers Say About groundcover?

AI-generated summary from verified user reviews

Pros
  • Users value the user-friendly interface of Groundcover, making data access and service monitoring effortless.
  • Users value the intuitive interface and automation features of Groundcover, enhancing efficiency in monitoring and incident management.
  • Users love the user-friendly interface of Groundcover, making it easy to navigate and monitor services effectively.
  • Users love the easy setup of Groundcover, allowing quick deployment and integration with essential monitoring features.
  • Users find Groundcover's observability features easy to use, providing an efficient and effective monitoring solution.
Cons
  • Users note that the UI can be confusing and difficult to navigate, leading to a steep learning curve.
  • Users criticize the limited features of Groundcover, particularly struggling with UI resizing and profiling support.
  • Users find missing features like limited documentation and dashboard issues hinder their experience with Groundcover.
  • Users find poor customer support a concern, indicating a need for improvements in assistance and response times.
  • Users experience dashboard issues including messy layouts and navigation problems that hinder usability and efficiency.

What Are Recent G2 Reviews of groundcover?

OpenObserve

OpenObserve is a modern, full-stack observability platform. What sets OpenObserve (O2) apart is OpenTelemetry-native, unified logs, metrics, traces, RUM, AI SRE, and LLM observability, running in the cloud, on-prem, or in hybrid environments. O2 is open source, backed by a large community of users and contributors, with up to 140x lower storage costs than Elasticsearch, no proprietary query language, and native integration with AI-native workflows.

Average Rating: 5.0/5.0

Total Reviews: 5

Who Is the Company Behind OpenObserve?

  • Seller: OpenObserve
  • Year Founded: 2022
  • HQ Location: San Francisco, US
  • Twitter: @OpenObserve
  • LinkedIn® Page: www.linkedin.com
    33 employees on LinkedIn®

Who Uses This Product?

  • Company Size: 60% Small, 40% Medium

What Are Recent G2 Reviews of OpenObserve?

Atatus

Atatus is an AI-SRE driven observability platform built to help teams monitor, understand, and improve the performance, reliability, and security of modern systems. It brings together application performance, APIs, infrastructure, databases, network activity, logs, and user experience into a single, unified platform, enabling teams to gain real-time visibility and context across their entire stack. Trusted by teams across industries, Atatus enables engineering, DevOps, SRE, and security teams to detect anomalies early, investigate issues with correlated insights, and resolve incidents faster. By combining full-stack observability with API intelligence, database and network monitoring, security log analysis, and AI-driven signal correlation, Atatus helps reduce mean time to resolution (MTTR), improve system reliability, strengthen security posture, and deliver better user experiences while maintaining visibility into critical business operations.

Average Rating: 4.7/5.0

Total Reviews: 95

Who Is the Company Behind Atatus?

  • Seller: Atatus
  • Year Founded: 2014
  • HQ Location: Chennai, TamilNadu
  • Twitter: @atatusapp
    93 Twitter followers
  • LinkedIn® Page: www.linkedin.com
    64 employees on LinkedIn®

Who Uses This Product?

  • Who Uses This: CEO, CTO
  • Top Industries: Computer Software, Information Technology and Services
  • Company Size: 72% Small, 23% Medium

What Do G2 Reviewers Say About Atatus?

AI-generated summary from verified user reviews

Pros
  • Users highlight the fantastic customer support of Atatus, making it easy to resolve issues and enhance experience.
  • Users find Atatus to be easy to use, facilitating efficient navigation and excellent customer support.
  • Users enjoy Atatus for its intuitive interface, making it easy to navigate and integrate into workflows.
  • Users enjoy the easy setup process of Atatus, appreciating its intuitive interface and seamless integration.
  • Users value the big-picture analytics of Atatus, enhancing their ability to monitor and optimize application performance effectively.
Cons
  • Users find a lack of detailed information in Atatus documentation, leading to potential setup challenges.

What Are Recent G2 Reviews of Atatus?

What Are G2 Users Discussing About Atatus?

Zabbix

Zabbix is an all-in-one, open source monitoring and observability solution that makes any hardware, software, service, or web application more efficient and reliable. Available on-premise and in the cloud, Zabbix can deploy anywhere and monitor any device, system, or app in any environment – while providing comprehensive data protection, easy integration, and limitless data visualization options. Zabbix uses a wide range of data collection methods to collect metrics, defining smart problem thresholds and harnessing the power of machine learning to suppress unwanted alert storms and notify users regarding the root cause of issues. Metrics are displayed on intuitive, easy-to-understand dashboards that allow users to access issues, reports, and maps with a single click. Users can monitor anything from physical and virtual servers or containers to network infrastructure and applications. Zabbix allows users to: • Control their infrastructure by collecting any metric from any source • Detect problems instantly • Get alerted on critical issues • Gain additional insights and extend observability via powerful data visualization • Leverage a single pane of glass for an entire infrastructure • Keep track of KPI's with business service monitoring • Seamlessly deploy Zabbix within any infrastructure • Deploy with just a few clicks, either on-premise or in the cloud • Scale quickly and without limits • Do business with the peace of mind that enterprise-grade security provides Zabbix also offers a full range of professional services, including: • Technical support subscriptions • Zabbix professional training • Migration • Upgrades • Template building • Development • Integration • Consulting • Turnkey solution

Average Rating: 4.3/5.0

Total Reviews: 206

Who Is the Company Behind Zabbix?

  • Seller: Zabbix
  • Company Website:
  • Year Founded: 2005
  • HQ Location: Riga, Latvia
  • Twitter: @zabbix
    9,943 Twitter followers
  • LinkedIn® Page: www.linkedin.com
    170 employees on LinkedIn®

Who Uses This Product?

  • Top Industries: Information Technology and Services, Telecommunications
  • Company Size: 61% Medium, 27% Large

What Do G2 Reviewers Say About Zabbix?

AI-generated summary from verified user reviews

Pros
  • Users appreciate the custom alert capabilities and fast alerts of Zabbix for effective monitoring of infrastructure.
  • Users find Zabbix to have a user-friendly integration process, making monitoring and alerting effortless.
  • Users value Zabbix's monitoring capabilities, effectively managing networks, servers, applications, and more across diverse infrastructures.
  • Users appreciate the monitoring ease of Zabbix, enjoying prompt alerts and intuitive dashboards for effective system management.
  • Users value the real-time monitoring capabilities of Zabbix, providing fast alerts and comprehensive infrastructure oversight.
Cons
  • Users find a steep learning curve when starting with Zabbix, complicating the setup of dashboards and integrations.
  • Users face dashboard limitations that hinder customization and fail to meet expectations, suggesting a need for enhancements.
  • Users highlight data limitations in Zabbix, finding it fails to meet expectations for customizable dashboards and features.
  • Users find the difficult configuration of Zabbix challenging, especially for new joiners and initial setups.
  • Users find the difficult learning curve challenging at first, especially with dashboards and calculations.

What Are Recent G2 Reviews of Zabbix?

What Are G2 Users Discussing About Zabbix?

APIContext

APIContext monitors your most complicated journeys end-to-end to ensure reachability, availability, performance, and contract validation. Create journeys that include APIs, websites, and AI infrastructure and validate from hundreds of points of presence across the globe. Faster time to issue identification, issue resolution, and immediate triage before your users even know something is wrong.

Average Rating: 4.7/5.0

Total Reviews: 3

Who Is the Company Behind APIContext?

Who Uses This Product?

  • Company Size: 50% Large, 25% Medium

What Are Recent G2 Reviews of APIContext?

Tian Lin
TL
Researched and written by Tian Lin
Updated June 12, 2025