Best Network Monitoring Software - Page 4

How Many Network Monitoring Software Products Does G2 Track?

Total Products under this Category: 228

Category Stats (Sep 2026)

  • Average Rating: 4.49/5 (↓0.01 vs Aug 2026) The average rating of products in this category, based on all submitted ratings
  • Top Trending Product: Netcrunch (+1.38%) - Among all products in this category, Netcrunch recorded the largest rating increase compared to last month

Last updated: September 26, 2026

How Does G2 Rank Network Monitoring Software Products?

Why You Can Trust G2's Software Rankings:

  • 30 Analysts and Data Experts
  • 19,900+ Authentic Reviews
  • 228+ Products
  • Unbiased Rankings

G2's software rankings are built on verified user reviews, rigorous moderation, and a consistent research methodology maintained by a team of analysts and data experts. Each product is measured using the same transparent criteria, with no paid placement or vendor influence. While reviews reflect real user experiences, which can be subjective, they offer valuable insight into how software performs in the hands of professionals. Together, these inputs power the G2 Score, a standardized way to compare tools within every category.

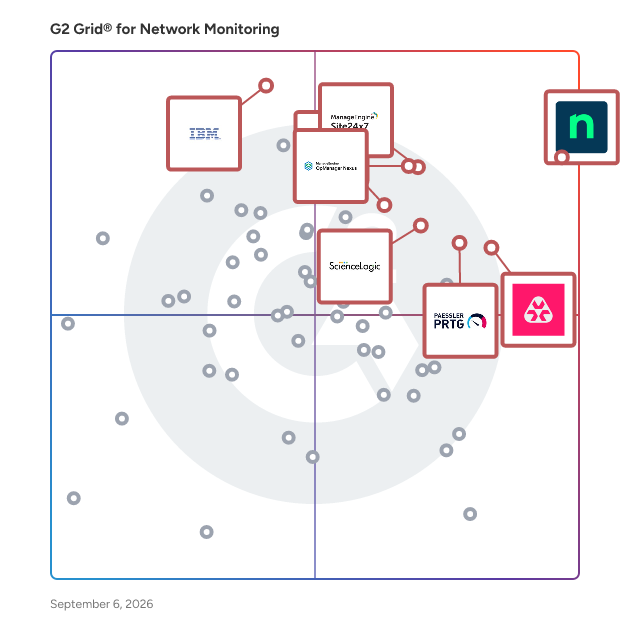
G2 Grid® for Network Monitoring Software

G2 Grid® for Network Monitoring Software plotting products by satisfaction and market presence

Highlighted products: NinjaOne, OpManager Nexus, Site24x7, Remote Monitoring and Management, Paessler PRTG, ScienceLogic AI Platform, IBM SevOne, and TeamViewer.

Underlying data: [Grid® JSON](https://www.g2.com/categories/network-monitoring/grids.json?focus%5B%5D=ninjaone&focus%5B%5D=opmanager-nexus&focus%5B%5D=site24x7&focus%5B%5D=remote-monitoring-and-management&focus%5B%5D=paessler-prtg&focus%5B%5D=sciencelogic-ai-platform&focus%5B%5D=ibm-sevone&focus%5B%5D=teamviewer)

Centreon Infra Monitoring

Centreon is a comprehensive IT monitoring solution designed to help organizations gain full visibility and control over their IT operations. By providing real-time insights into system performance, network health, and application availability, Centreon enables businesses to proactively manage their IT environments, ensuring uninterrupted operations and optimal resource utilization. Targeted primarily at IT departments and operations teams, Centreon serves a diverse range of industries, from small businesses to large enterprises. Its user-friendly interface and customizable dashboards make it accessible for both technical and non-technical users. This versatility allows organizations to tailor the monitoring experience to their specific needs, making it an invaluable tool for maintaining operational efficiency and enhancing service delivery. One of the key use cases for Centreon is its ability to prevent downtime through proactive issue detection. By continuously monitoring critical systems and applications, Centreon alerts IT teams to potential problems before they escalate into significant outages. This proactive approach minimizes disruptions and helps organizations maintain a reliable IT infrastructure, which is essential for meeting business demands and ensuring customer satisfaction. Centreon also emphasizes resource optimization, allowing businesses to maximize efficiency and reduce IT costs. By providing detailed insights into resource utilization, organizations can identify underperforming assets and make informed decisions about capacity planning and resource allocation. This capability enables businesses to streamline their IT operations, ultimately leading to cost savings and improved performance. In addition, Centreon enhances the user experience by delivering consistent, high-quality IT services. With its comprehensive monitoring capabilities, IT teams can ensure that applications and services are running smoothly, providing end-users with the reliable performance they expect. This focus on user experience fosters customer loyalty and supports overall business success by aligning IT services with organizational goals. Centreon distinguishes itself in the IT monitoring category by combining powerful monitoring features with a user-centric approach. Its ability to deliver actionable insights, prevent downtime, optimize resources, and enhance user experience makes it a vital tool for organizations looking to improve their IT operations and achieve business success.

Average Rating: 4.6/5.0

Total Reviews: 89

How Do G2 Users Rate Centreon Infra Monitoring?

  • Has the product been a good partner in doing business?: 8.1/10 (Category avg: 8.8/10)
  • Performance Monitoring: 8.7/10 (Category avg: 8.9/10)
  • Multi-Network Capability: 8.6/10 (Category avg: 8.7/10)
  • Path Analysis: 10.0/10 (Category avg: 8.4/10)

Who Is the Company Behind Centreon Infra Monitoring?

  • Seller: Centreon
  • Company Website:
  • Year Founded: 2005
  • HQ Location: Paris, France
  • Twitter: @Centreon
    697 Twitter followers
  • LinkedIn® Page: www.linkedin.com
    154 employees on LinkedIn®

Who Uses This Product?

  • Who Uses This: Network Engineer
  • Top Industries: Information Technology and Services, Internet
  • Company Size: 63% Medium, 25% Large

What Do G2 Reviewers Say About Centreon Infra Monitoring?

AI-generated summary from verified user reviews

Pros
  • Users appreciate the ease of use of Centreon Infra Monitoring, enjoying its flexibility and organized monitoring experience.
  • Users appreciate the ease of centralized monitoring with Centreon, enjoying a clear view of their entire infrastructure.
  • Users value the centralized monitoring capabilities of Centreon, providing a clear and organized view of their infrastructure.
  • Users value the real-time monitoring capabilities of Centreon, enhancing their ability to oversee diverse infrastructure seamlessly.
  • Users appreciate the flexible integrations of Centreon Infra Monitoring, seamlessly connecting with various tools and devices.
Cons
  • Users find the complex configuration process challenging, especially during setup and integration with other tools.
  • Users find Centreon Infra Monitoring to have a not user-friendly interface, complicating setup and upgrades significantly.
  • Users find the complex setup of Centreon Infra Monitoring time-consuming and challenging, particularly for newcomers.
  • Users find the difficult learning curve of Centreon Infra Monitoring challenging, particularly during setup and upgrades.
  • Users find the learning curve steep, particularly during setup and upgrades, requiring significant technical effort.

What Are Recent G2 Reviews of Centreon Infra Monitoring?

What Are G2 Users Discussing About Centreon Infra Monitoring?

Splunk Observability Cloud

Splunk Observability Cloud is a comprehensive, real-time monitoring and troubleshooting platform designed to provide full-stack visibility across any environment. By integrating application performance monitoring, infrastructure monitoring, and digital experience monitoring, it enables organizations to detect and resolve issues swiftly, ensuring optimal system performance and enhanced user experiences. Built on OpenTelemetry standards, Splunk Observability Cloud offers AI-driven insights and analytics, facilitating proactive management of complex, distributed systems. Key Features and Functionality: - Application Performance Monitoring (APM): Identifies and addresses application issues by combining related data into intuitive visuals, accelerating mean time to resolution (MTTR). - Infrastructure Monitoring: Provides instant visibility and real-time alerts to improve hybrid cloud performance. - Digital Experience Monitoring: Delivers insights into frontend performance through Real User Monitoring and Synthetic Monitoring, ensuring seamless user experiences. - AI-Powered Analytics: Utilizes machine learning-driven features like Service Maps and Trace Analytics to offer guided troubleshooting and faster issue resolution. - OpenTelemetry-Native: Ensures data ownership and control, preventing vendor lock-in and allowing consistent instrumentation across applications. - No Data Sampling: Collects and analyzes 100% of data with NoSample™ tracing, eliminating blind spots. - Log Observer Connect: Correlates logs stored in Splunk Platform with real-time metrics and traces, providing deeper context for software behavior. Primary Value and Problem Solving: Splunk Observability Cloud addresses the challenges of monitoring and managing complex, distributed systems by offering unified visibility and real-time troubleshooting capabilities. It empowers organizations to: - Accelerate Issue Resolution: By correlating metrics, traces, and logs, teams can quickly identify root causes, reducing downtime and improving system reliability. - Enhance User Experiences: Continuous monitoring of digital experiences ensures that performance issues are detected and resolved before impacting end-users. - Optimize Operational Efficiency: AI-driven insights and automated analytics streamline troubleshooting processes, allowing teams to focus on innovation rather than firefighting. - Maintain Data Control: The OpenTelemetry-native approach provides flexibility and prevents vendor lock-in, enabling organizations to adapt and scale their observability practices as needed. By integrating these capabilities, Splunk Observability Cloud enables organizations to maintain high system performance, deliver exceptional user experiences, and drive continuous innovation.

Average Rating: 4.3/5.0

Total Reviews: 55

How Do G2 Users Rate Splunk Observability Cloud?

  • Has the product been a good partner in doing business?: 8.0/10 (Category avg: 8.8/10)

Who Is the Company Behind Splunk Observability Cloud?

  • Seller: Cisco
  • Year Founded: 1984
  • HQ Location: San Jose, CA
  • Twitter: @Cisco
    720,366 Twitter followers
  • LinkedIn® Page: www.linkedin.com
    95,294 employees on LinkedIn®
  • Ownership: NASDAQ:CSCO

Who Uses This Product?

  • Top Industries: Information Technology and Services, Computer Software
  • Company Size: 38% Large, 33% Small

What Do G2 Reviewers Say About Splunk Observability Cloud?

AI-generated summary from verified user reviews

Pros
  • Users value the detailed insights and analytics from Splunk Observability Cloud, enhancing performance and health monitoring of infrastructure.
  • Users find Splunk Observability Cloud to be extremely user-friendly, streamlining tasks and enhancing efficiency in monitoring.
Cons
  • Users find the pricing too expensive, suggesting a need for more economical options to increase accessibility.
  • Users find the pricing issues significant, citing high costs and a lack of training resources for effective use.
  • Users find the steep learning curve of Splunk Observability Cloud challenging, requiring time and prior knowledge to master.
  • Users find the complex setup of Splunk Observability Cloud challenging, making it difficult to effectively utilize the tool.
  • Users find the difficult learning curve of Splunk Observability Cloud challenging, especially for beginners requiring time to adapt.

What Are Recent G2 Reviews of Splunk Observability Cloud?

What Are G2 Users Discussing About Splunk Observability Cloud?

SolarWinds Standard Toolset

SolarWinds Engineer's Toolset is a comprehensive suite of over 60 network management tools designed to assist network engineers in monitoring, diagnosing, and troubleshooting network issues efficiently. This robust collection offers real-time monitoring, network diagnostics, and configuration management capabilities, all accessible through an intuitive interface. Key Features and Functionality: - Real-Time Monitoring and Alerting: Monitor network availability and health in real time, with instant alerts to address potential issues promptly. - Network Diagnostics: Utilize tools like Ping Sweep, DNS Analyzer, and TraceRoute to diagnose and resolve network problems swiftly. - Configuration Management: Manage device configurations with tools such as Config Downloader and Config Compare, ensuring consistency and compliance across the network. - Network Discovery: Automatically discover devices and IP addresses within the network using tools like Port Scanner and Switch Port Mapper. - Integration with SolarWinds Orion Platform: Seamlessly integrate with SolarWinds Network Performance Monitor (NPM) for enhanced troubleshooting and comprehensive network management. Primary Value and User Solutions: Engineer’s Toolset empowers network engineers by providing a centralized suite of tools that streamline network management tasks. By offering real-time insights, automated diagnostics, and configuration management, it reduces the time and effort required to identify and resolve network issues. This leads to improved network performance, minimized downtime, and enhanced operational efficiency, allowing engineers to focus on strategic initiatives rather than routine troubleshooting.

Average Rating: 4.0/5.0

Total Reviews: 27

How Do G2 Users Rate SolarWinds Standard Toolset?

  • Has the product been a good partner in doing business?: 8.0/10 (Category avg: 8.8/10)
  • Performance Monitoring: 8.3/10 (Category avg: 8.9/10)
  • Multi-Network Capability: 8.3/10 (Category avg: 8.7/10)
  • Path Analysis: 6.7/10 (Category avg: 8.4/10)

Who Is the Company Behind SolarWinds Standard Toolset?

  • Seller: SolarWinds Worldwide LLC
  • Year Founded: 1999
  • HQ Location: Austin, TX
  • Twitter: @solarwinds
    19,570 Twitter followers
  • LinkedIn® Page: www.linkedin.com
    2,864 employees on LinkedIn®
  • Ownership: NYSE: SWI

Who Uses This Product?

  • Company Size: 43% Large, 43% Medium

What Do G2 Reviewers Say About SolarWinds Standard Toolset?

AI-generated summary from verified user reviews

Pros
  • Users find the ease of use of SolarWinds Standard Toolset exceptional, requiring no expert skills to manage effectively.
  • Users value the easy deployment of SolarWinds Standard Toolset, making it accessible for all skill levels.
Cons
  • Users note that the product is expensive compared to other similar tools available in the market.

What Are Recent G2 Reviews of SolarWinds Standard Toolset?

What Are G2 Users Discussing About SolarWinds Standard Toolset?

Progress Flowmon Platform

Flowmon is a professional NPMD tool for effective network troubleshooting, performance monitoring, capacity planning, encrypted traffic analysis and cloud monitoring. Instead of just the red/green infrastructure status, it helps NetOps teams to understand user experience (UX) while keeping the amount of data noise and analytical work to a minimum. The Flowmon solution is a part of the Progress product portfolio.

Average Rating: 4.2/5.0

Total Reviews: 24

How Do G2 Users Rate Progress Flowmon Platform?

  • Has the product been a good partner in doing business?: 7.8/10 (Category avg: 8.8/10)
  • Performance Monitoring: 8.5/10 (Category avg: 8.9/10)
  • Multi-Network Capability: 8.3/10 (Category avg: 8.7/10)
  • Path Analysis: 8.1/10 (Category avg: 8.4/10)

Who Is the Company Behind Progress Flowmon Platform?

  • Seller: Progress Software
  • Year Founded: 1981
  • HQ Location: Burlington, MA.
  • Twitter: @ProgressSW
    48,773 Twitter followers
  • LinkedIn® Page: www.linkedin.com
    4,242 employees on LinkedIn®
  • Ownership: NASDAQ:PRGS

Who Uses This Product?

  • Top Industries: Information Technology and Services
  • Company Size: 52% Medium, 24% Large

What Are Recent G2 Reviews of Progress Flowmon Platform?

What Are G2 Users Discussing About Progress Flowmon Platform?

BlueCat LiveAssurance

BlueCat LiveAssurance (formerly BlueCat Infrastructure Assurance, or BCIA) is a proactive observability and automation solution that helps prevent network disruption before it happens. Think of it as a virtual network expert, on duty 24/7 — but its reach now extends beyond DDI: LiveAssurance protects core network services like BlueCat Integrity (including Address Manager and BDDS components), as well as firewalls and load balancers from a wide range of vendors. LiveAssurance works in three stages. First, it continuously measures security, performance, and configuration metrics, cross-referencing them against best-practice benchmarks and internal or external standards. Second, when it detects an issue, it automatically triages and diagnoses the root cause — giving admins context on why the issue is happening, not just that it happened. Third, it delivers instant remediation recommendations, drawing on a knowledge base of certified, production-ready automation steps, so admins know exactly what to do next.

Average Rating: 4.4/5.0

Total Reviews: 13

How Do G2 Users Rate BlueCat LiveAssurance?

  • Has the product been a good partner in doing business?: 8.9/10 (Category avg: 8.8/10)
  • Performance Monitoring: 10.0/10 (Category avg: 8.9/10)
  • Multi-Network Capability: 6.7/10 (Category avg: 8.7/10)
  • Path Analysis: 5.0/10 (Category avg: 8.4/10)

Who Is the Company Behind BlueCat LiveAssurance?

  • Seller: BlueCat
  • Year Founded: 2001
  • HQ Location: Toronto, Ontario
  • Twitter: @BlueCatNetworks
    2,228 Twitter followers
  • LinkedIn® Page: www.linkedin.com
    752 employees on LinkedIn®

Who Uses This Product?

  • Company Size: 57% Large, 29% Medium

What Are Recent G2 Reviews of BlueCat LiveAssurance?

What Are G2 Users Discussing About BlueCat LiveAssurance?

Netreo

Netreo is the most comprehensive IT Operations full stack monitoring and AIOps company. We provide a single source of truth for proactive performance and availability monitoring for large enterprise networks, infrastructure, applications and business services. Our solution is used by: - IT Executives to have full visibility from the business service right down into the infrastructure and network that supports it. - IT Engineering departments as a decision support system for capacity planning, and architecting modern solutions. - IT Operations teams for real time visibility into what is failing in their environment, what bottlenecks exist and who it is affecting. We provide all of these insights for systems and vendor mixes in large heterogeneous and constantly evolving environments. We have an extensive and growing list of supported vendors (over 350 integrations) including network vendors, servers, storage, virtualization, cloud platforms and others. Our platform is also an extensible environment with the ability for our user community to build and share their integrations with others in our customer community.

Average Rating: 4.5/5.0

Total Reviews: 54

How Do G2 Users Rate Netreo?

  • Has the product been a good partner in doing business?: 9.2/10 (Category avg: 8.8/10)
  • Performance Monitoring: 9.0/10 (Category avg: 8.9/10)
  • Multi-Network Capability: 8.8/10 (Category avg: 8.7/10)
  • Path Analysis: 8.3/10 (Category avg: 8.4/10)

Who Is the Company Behind Netreo?

Who Uses This Product?

  • Top Industries: Information Technology and Services, Primary/Secondary Education
  • Company Size: 37% Medium, 34% Large

What Are Recent G2 Reviews of Netreo?

What Are G2 Users Discussing About Netreo?

Nagios Network Analyzer

Nagios Network Analyzer is an enterprise-class network flow monitoring solution that provides organizations with comprehensive insight into network traffic patterns and bandwidth usage. By supporting industry-standard flow data technologies such as NetFlow, sFlow, J-Flow, and IPFIX, it enables in-depth assessment of a network's overall health. The intuitive web interface offers advanced visualizations and customizable dashboards, allowing users to monitor network performance effectively. Integrated with tools like Wireshark, Suricata, and Nmap, Nagios Network Analyzer enhances network security through real-time packet capture, intrusion detection, and network mapping. Its automated alerting system notifies users of abnormal activities or bandwidth anomalies, facilitating prompt issue resolution. Seamless integration with Nagios XI ensures centralized monitoring and reporting, making it a versatile tool for maintaining network reliability and security. Key Features and Functionality: - Comprehensive Flow Data Analysis: Supports NetFlow v5, v7, v9, sFlow, J-Flow, and IPFIX, providing granular visibility into network traffic. - Advanced Visualizations: Offers intuitive graphs and customizable dashboards for real-time monitoring of network performance and bandwidth usage. - Integrated Security Tools: Incorporates Wireshark for packet analysis, Suricata for intrusion detection, and Nmap for network discovery, enhancing threat detection and response capabilities. - Automated Alerting System: Delivers notifications for abnormal network activities or bandwidth thresholds, enabling proactive issue management. - Seamless Nagios XI Integration: Allows centralized monitoring and reporting by integrating with Nagios XI, streamlining network management processes. Primary Value and User Solutions: Nagios Network Analyzer empowers organizations to proactively monitor and analyze network traffic, ensuring optimal performance and security. By providing real-time insights into bandwidth utilization and potential threats, it enables IT teams to detect and address issues before they impact critical business operations. The integration with industry-standard tools and the automated alerting system enhance the efficiency of network management, reducing downtime and improving overall network reliability.

Average Rating: 4.2/5.0

Total Reviews: 30

How Do G2 Users Rate Nagios Network Analyzer?

  • Has the product been a good partner in doing business?: 6.9/10 (Category avg: 8.8/10)
  • Performance Monitoring: 9.4/10 (Category avg: 8.9/10)
  • Multi-Network Capability: 9.2/10 (Category avg: 8.7/10)
  • Path Analysis: 9.0/10 (Category avg: 8.4/10)

Who Is the Company Behind Nagios Network Analyzer?

  • Seller: Nagios
  • Year Founded: 2007
  • HQ Location: Saint Paul, MN
  • Twitter: @nagiosinc
    5,495 Twitter followers
  • LinkedIn® Page: www.linkedin.com
    80 employees on LinkedIn®

Who Uses This Product?

  • Top Industries: Information Technology and Services, Internet
  • Company Size: 60% Medium, 33% Large

What Do G2 Reviewers Say About Nagios Network Analyzer?

AI-generated summary from verified user reviews

Pros
  • Users commend the accurate traffic visualization and dashboard features of Nagios Network Analyzer for effective monitoring.
  • Users appreciate the in-depth traffic analysis and advanced functionalities offered by Nagios Network Analyzer.
  • Users appreciate the ease of use of Nagios Network Analyzer, allowing in-depth traffic analysis and advanced functionalities.
  • Users commend the reliability of Nagios Network Analyzer, noting its accurate traffic visualization and top talker insights.
Cons
  • Users find the complex configuration process challenging, particularly with third-party software integration gaps.
  • Users find setup and configuration complex, with challenges in integrating Nagios Network Analyzer with third-party software.
  • Users experience integration issues, finding the setup complex and third-party software connectivity lacking.

What Are Recent G2 Reviews of Nagios Network Analyzer?

What Are G2 Users Discussing About Nagios Network Analyzer?

NetBrain Next-Gen

NetBrain's no-code automation platform for hybrid network observability empowers organizations to streamline operations by automating three critical workflows: troubleshooting, change management, and assessment. The platform features a high-level summary dashboard for hybrid network observability, providing instant insights into network health. The no-code technology, powered by a digital twin, allows for easy capture, replication, and enforcement of network intents at scale. This innovative approach enhances operational efficiency at scale, reduces downtime, and fortifies cybersecurity, making it an essential tool for modern network operations. Get network-wide and contextualized analysis across your multi-vendor, multi-cloud network Visualize and document the entire hybrid network using dynamic network maps and end-to-end paths Automate network discovery and ensure data accuracy for a single source of truth Auto-discover and decode your network's golden configurations, discover day 1 issues, and automate configuration drift prevention Automate pre- and post-validations for network changes with application performance context understanding Automate collaborative troubleshooting from human to machine For every network troubleshooting idea, create a map, apply automation from your own library, and view live results interactively Prevent configuration drift and human error with continuous network assessment Further information can be found at https://www.netbraintech.com.

Average Rating: 4.4/5.0

Total Reviews: 15

How Do G2 Users Rate NetBrain Next-Gen?

  • Has the product been a good partner in doing business?: 8.6/10 (Category avg: 8.8/10)
  • Performance Monitoring: 9.7/10 (Category avg: 8.9/10)
  • Multi-Network Capability: 9.0/10 (Category avg: 8.7/10)
  • Path Analysis: 9.7/10 (Category avg: 8.4/10)

Who Is the Company Behind NetBrain Next-Gen?

Who Uses This Product?

  • Top Industries: Information Technology and Services
  • Company Size: 41% Medium, 35% Large

What Do G2 Reviewers Say About NetBrain Next-Gen?

AI-generated summary from verified user reviews

Pros
  • Users praise the comprehensive monitoring capabilities of NetBrain, enhancing network troubleshooting and efficiency significantly.
  • Users value the customization options of NetBrain Next-Gen, enhancing flexibility in tailoring the tool to their needs.
  • Users value the ease of use of NetBrain Next-Gen, which streamlines network troubleshooting with automation and visualization.
Cons
  • Users find the overwhelming UI and complex feature set challenging, especially for non-networking staff without training.
  • Users find the steep learning curve challenging, especially for those unfamiliar with networking concepts or advanced features.

What Are Recent G2 Reviews of NetBrain Next-Gen?

What Are G2 Users Discussing About NetBrain Next-Gen?

Virtana Platform

Virtana delivers the industry's deepest hybrid infrastructure observability platform, empowering enterprises to ensure the availability, efficiency, and resiliency of their mission-critical services. Our AI-powered platform unifies visibility across on-premises, cloud, and Kubernetes environments, providing comprehensive real-time insights and intelligent automation. Key differentiators: · AI-driven early warning system and automated root cause analysis · Comprehensive topology discovery and mapping across your entire IT estate · Consolidated alerts with policy-based noise reduction · Natural language infrastructure querying through Virtana Copilot · Vendor-agnostic platform supporting both on-premises and cloud deployments Organizations choose Virtana to: · Reduce mean time to resolution (MTTR) through AI-powered automation · Lower infrastructure costs with intelligent optimization · Improve team productivity by eliminating alert noise · Support demanding AI workloads with deep infrastructure insights · Transform infrastructure from a cost center to a strategic asset Whether you're managing traditional IT, hybrid environments, or advanced AI data centers, Virtana provides the deep observability and intelligent automation needed to drive operational excellence and accelerate digital transformation.

Average Rating: 4.3/5.0

Total Reviews: 35

How Do G2 Users Rate Virtana Platform?

  • Has the product been a good partner in doing business?: 9.0/10 (Category avg: 8.8/10)
  • Performance Monitoring: 6.9/10 (Category avg: 8.9/10)
  • Multi-Network Capability: 6.9/10 (Category avg: 8.7/10)
  • Path Analysis: 6.7/10 (Category avg: 8.4/10)

Who Is the Company Behind Virtana Platform?

  • Seller: Virtana
  • Year Founded: 2008
  • HQ Location: N/A
  • Twitter: @VirtanaCorp
    9,421 Twitter followers
  • LinkedIn® Page: www.linkedin.com
    168 employees on LinkedIn®

Who Uses This Product?

  • Company Size: 53% Large, 26% Medium

What Are Recent G2 Reviews of Virtana Platform?

What Are G2 Users Discussing About Virtana Platform?

NetFlow Analyzer

NetFlow Analyzer utilizes Cisco® NetFlow, IPFIX and compatible netflow-like protocols to help net admins with bandwidth monitoring, deep network traffic investigation, analyses and reporting. By visualizing the traffic by network devices, interfaces, subnets and end users, net admins can better understand bandwidth consumption, traffic trends, applications, host traffic and traffic anomalies. • Monitoring network bandwidth on routers and interfaces; • Monitoring custom traffic on IP subnets and IP subnets groups; • Monitoring end user traffic; • Highlighting traffic structure with top talkers: hosts, services, protocols, conversations, QoS, AS; • Exploring historical data: charts and flow records; • Collecting and analysing Cisco® NetFlow v5 and v9 and standardised IPFIX (exported by devices from Cisco, Juniper, HP and other vendors). This enables companies to optimize their networks and applications, plan network expansion, save time needed for troubleshooting and diagnostics and improve security – in turn considerably lowering company operational costs and increasing network team productivity.

Average Rating: 4.4/5.0

Total Reviews: 10

How Do G2 Users Rate NetFlow Analyzer?

  • Has the product been a good partner in doing business?: 8.7/10 (Category avg: 8.8/10)
  • Performance Monitoring: 8.3/10 (Category avg: 8.9/10)
  • Multi-Network Capability: 7.2/10 (Category avg: 8.7/10)
  • Path Analysis: 7.2/10 (Category avg: 8.4/10)

Who Is the Company Behind NetFlow Analyzer?

  • Seller: NetVizura
  • Year Founded: 2008
  • HQ Location: Belgrade, Serbia
  • LinkedIn® Page: www.linkedin.com
    1 employees on LinkedIn®

Who Uses This Product?

  • Company Size: 50% Medium, 40% Large

What Do G2 Reviewers Say About NetFlow Analyzer?

AI-generated summary from verified user reviews

Pros
  • Users value the all-in-one solution of NetFlow Analyzer, which enhances visibility into network traffic effectively.
  • Users value the reliability of NetFlow Analyzer, gaining excellent visibility into network traffic management.
  • Users value the great visibility of network traffic provided by NetFlow Analyzer, making it essential for network engineers.
  • Users value the great visibility provided by NetFlow Analyzer, enhancing their understanding of network traffic.
Cons
  • Users find the initial setup challenging, although the product performs well once configured with OpManager.
  • Users find the initial setup challenging, but appreciate the integration with OPManager afterward.

What Are Recent G2 Reviews of NetFlow Analyzer?

CANopen

CANopen Magic is a versatile software tool to monitor, analyze, trace, configure, simulate and test CANopen and CANopen FD networks and devices. It contains functions for the entire lifetime of a CANopen network: from development and test to system integration and performance analysis. Use sophisticated trace filtering and node access to monitor, analyze and test all aspects of your network. Simulate nodes that are still under development.

Average Rating: 4.3/5.0

Total Reviews: 12

How Do G2 Users Rate CANopen?

  • Has the product been a good partner in doing business?: 10.0/10 (Category avg: 8.8/10)

Who Is the Company Behind CANopen?

Who Uses This Product?

  • Company Size: 42% Small, 42% Large

What Are Recent G2 Reviews of CANopen?

What Are G2 Users Discussing About CANopen?

Apica

Apica provides agentic-ready infrastructure purpose-built for the AI era. Apica helps enterprises take control of exploding telemetry volumes by providing the pipeline control, metrics foundation, and data readiness that AI agents demand, at up to 40% lower total cost of ownership than legacy observability platforms. Unlike platform-centric solutions that ingest everything indiscriminately and charge at every step, Apica's pipeline-first architecture processes, enriches, and governs telemetry before costly platform ingestion, giving enterprises clean, governed, real-time data without vendor lock-in. Apica Ascent, the only complete telemetry data management product suite purpose-built for agentic AI environments, serves global enterprises across financial services, healthcare, retail, telecommunications, and technology sectors. Recognized as a Visionary in the 2025 Gartner Magic Quadrant for Observability Platforms. Learn more at www.apica.io or visit docs.apica.io.

Average Rating: 4.2/5.0

Total Reviews: 15

How Do G2 Users Rate Apica?

  • Has the product been a good partner in doing business?: 7.5/10 (Category avg: 8.8/10)
  • Performance Monitoring: 6.7/10 (Category avg: 8.9/10)
  • Multi-Network Capability: 8.3/10 (Category avg: 8.7/10)
  • Path Analysis: 5.0/10 (Category avg: 8.4/10)

Who Is the Company Behind Apica?

  • Seller: Apica
  • Year Founded: 2005
  • HQ Location: Stockholm, SE
  • LinkedIn® Page: www.linkedin.com
    83 employees on LinkedIn®

Who Uses This Product?

  • Company Size: 47% Medium, 33% Large

What Do G2 Reviewers Say About Apica?

AI-generated summary from verified user reviews

Pros
  • Users find Apica easy to use, enabling effortless testing with a user-friendly interface for all skill levels.
  • Users value the real-time monitoring capability of Apica, enhancing system performance and decision-making through timely insights.
  • Users value the comprehensive data analysis of Apica, enabling insights into system opportunities and issues effectively.
  • Users find the easy setup of Apica very beneficial for quickly conducting load tests without complex configurations.
  • Users value the efficient issue detection features of Apica, enabling proactive management of system performance and health.
Cons
  • Users find Circonus' limited features frustrating during trials, wishing for broader access to explore its full capabilities.
  • Users note the limited features during the trial, suggesting a broader selection for better evaluation is needed.
  • Users find the complex setup of Apica challenging, requiring significant time to customize and train effectively.
  • Users note the high pricing of Apica, which may be challenging for smaller firms with limited budgets.
  • Users find difficult customization in Apica, requiring time to adjust it for specific needs before production use.

What Are Recent G2 Reviews of Apica?

What Are G2 Users Discussing About Apica?

BhaiFi Networks

BhaiFi empowers businesses to forge meaningful connections with their customers through Guest WiFi. By harnessing AI technology, we make network security and compliance effortless, democratizing cybersecurity for businesses of all sizes. Our solutions transform WiFi into a powerful tool for growth - delivering actionable insights, simplifying operations, and allowing you to focus on what truly matters: growing your business and delighting your customers.

Average Rating: 4.2/5.0

Total Reviews: 21

How Do G2 Users Rate BhaiFi Networks?

  • Has the product been a good partner in doing business?: 10.0/10 (Category avg: 8.8/10)
  • Performance Monitoring: 9.6/10 (Category avg: 8.9/10)
  • Multi-Network Capability: 8.8/10 (Category avg: 8.7/10)
  • Path Analysis: 8.8/10 (Category avg: 8.4/10)

Who Is the Company Behind BhaiFi Networks?

  • Seller: BhaiFi
  • Year Founded: 2017
  • HQ Location: Ankit Verma
  • Twitter: @bhaifi
    69 Twitter followers
  • LinkedIn® Page: www.linkedin.com
    24 employees on LinkedIn®
  • Ownership: Ankit Verma

Who Uses This Product?

  • Company Size: 64% Small, 23% Medium

What Are Recent G2 Reviews of BhaiFi Networks?

Netdata

Netdata is an AI-driven real-time observability platform that monitors systems, containers, applications, and infrastructure across servers, cloud environments, Kubernetes clusters, and IoT devices. With zero-configuration deployment, Netdata installs instantly, automatically discovers metrics, builds dashboards, and begins monitoring without setup. Netdata AI serves as an intelligent on-call assistant, automatically investigating alerts, correlating anomalies across thousands of metrics, identifying root causes, and explaining incidents with clear, actionable recommendations. By transforming raw telemetry into AI-guided insights, Netdata helps engineering teams move from alert to resolution in minutes instead of hours. The platform collects per-second metrics through 800+ integrations across operating systems, containers, databases, applications, OpenMetrics exporters, StatsD, and logs. Its distributed architecture processes data at the edge, enabling high-resolution monitoring and visibility into short-lived performance issues that traditional monitoring tools often miss. Netdata is available as a scalable SaaS platform with Netdata Cloud or as a private deployment within your own infrastructure, supporting on-prem, private cloud, and air-gapped environments while delivering automated dashboards, ML-based anomaly detection, and real-time troubleshooting.

Average Rating: 4.6/5.0

Total Reviews: 51

How Do G2 Users Rate Netdata?

  • Has the product been a good partner in doing business?: 9.4/10 (Category avg: 8.8/10)
  • Performance Monitoring: 9.6/10 (Category avg: 8.9/10)
  • Multi-Network Capability: 9.3/10 (Category avg: 8.7/10)
  • Path Analysis: 8.9/10 (Category avg: 8.4/10)

Who Is the Company Behind Netdata?

  • Seller: Netdata
  • Year Founded: 2018
  • HQ Location: San Francisco, US
  • Twitter: @netdatahq
    4,040 Twitter followers
  • LinkedIn® Page: www.linkedin.com
    79 employees on LinkedIn®

Who Uses This Product?

  • Top Industries: Information Technology and Services, Computer Software
  • Company Size: 44% Small, 43% Medium

What Do G2 Reviewers Say About Netdata?

AI-generated summary from verified user reviews

Pros
  • Users highlight the ease of use of Netdata, praising its quick setup and intuitive dashboard for monitoring.
  • Users praise the easy setup of Netdata, experiencing quick implementation and immediate access to detailed metrics.
  • Users praise the ease of setup and detailed real-time monitoring provided by Netdata, enabling efficient system management.
  • Users value the real-time monitoring of Netdata, appreciating its detail and immediacy for swift decision-making.
  • Users find the easy installation and user-friendly dashboard of Netdata to be highly beneficial for monitoring systems.
Cons
  • Users note missing APM features and limited documentation, which affect usability and long-term data retention.
  • Users find the insufficient documentation on best practices limits their ability to fully optimize Netdata's capabilities.
  • Users note the limited compatibility with Windows and lack of integrations, impacting their monitoring experience.
  • Users find the limited functionality of Netdata frustrating, especially with scalability and third-party dependencies affecting performance.
  • Users highlight resource limitations in Netdata, struggling with data volume and scalability challenges on their systems.

What Are Recent G2 Reviews of Netdata?

OpenNMS Platform

OpenNMS provides a highly reliable, scalable and comprehensive fault, performance and traffic monitoring solution that easily integrates with business applications and workflows to monitor and visualize everything in a network. The OpenNMS platform monitors some of the largest networks in existence, covering the healthcare, technology, finance, government, education, retail and industrial sectors, many with tens of thousands of networked devices. OpenNMS users include five of the top twenty companies on the Fortune 100, as well as multiple large and multi-state health providers and one of the largest electronic medical record providers in the United States.

Average Rating: 4.1/5.0

Total Reviews: 9

How Do G2 Users Rate OpenNMS Platform?

  • Has the product been a good partner in doing business?: 7.5/10 (Category avg: 8.8/10)
  • Performance Monitoring: 9.0/10 (Category avg: 8.9/10)
  • Multi-Network Capability: 8.3/10 (Category avg: 8.7/10)
  • Path Analysis: 7.8/10 (Category avg: 8.4/10)

Who Is the Company Behind OpenNMS Platform?

  • Seller: OpenNMS
  • Year Founded: 2004
  • HQ Location: Morrisville , North Carolina
  • Twitter: @opennms
    1,442 Twitter followers
  • LinkedIn® Page: www.linkedin.com
    16 employees on LinkedIn®

Who Uses This Product?

  • Company Size: 45% Small, 27% Medium

What Are Recent G2 Reviews of OpenNMS Platform?

Tian Lin
TL
Researched and written by Tian Lin
Updated April 1, 2025