Best Financial Analysis Software - Page 2

How Many Financial Analysis Software Products Does G2 Track?

Total Products under this Category: 208

Category Stats (Aug 2026)

  • Average Rating: 4.53/5 (↓0.01 vs Jul 2026) The average rating of products in this category, based on all submitted ratings
  • Top Trending Product: Nominal (+1.01%) - Among all products in this category, Nominal recorded the largest rating increase compared to last month

Last updated: August 07, 2026

How Does G2 Rank Financial Analysis Software Products?

Why You Can Trust G2's Software Rankings:

  • 30 Analysts and Data Experts
  • 8,800+ Authentic Reviews
  • 208+ Products
  • Unbiased Rankings

G2's software rankings are built on verified user reviews, rigorous moderation, and a consistent research methodology maintained by a team of analysts and data experts. Each product is measured using the same transparent criteria, with no paid placement or vendor influence. While reviews reflect real user experiences, which can be subjective, they offer valuable insight into how software performs in the hands of professionals. Together, these inputs power the G2 Score, a standardized way to compare tools within every category.

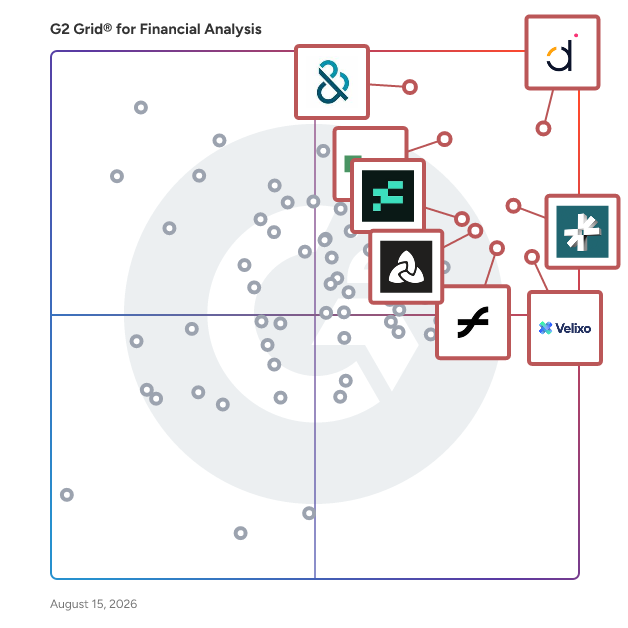
G2 Grid® for Financial Analysis Software

G2 Grid® for Financial Analysis Software plotting products by satisfaction and market presence

Highlighted products: Datarails, D&B Finance Analytics Credit Intelligence, Vena, DualEntry, Velixo, LiveFlow, Aleph, and Fathom.

Underlying data: [Grid® JSON](https://www.g2.com/categories/financial-analysis/grids.json?focus%5B%5D=datarails&focus%5B%5D=d-b-finance-analytics-credit-intelligence&focus%5B%5D=vena&focus%5B%5D=dualentry&focus%5B%5D=velixo&focus%5B%5D=liveflow&focus%5B%5D=getaleph&focus%5B%5D=fathom)

Sponsored

Aleph

Aleph is an AI-native Financial Planning and Analysis (FP&A) platform designed to enhance real-time data access and automation for finance teams. This innovative solution streamlines the way finance professionals manage, consolidate, and analyze data across various systems, making it an essential tool for organizations looking to improve their financial operations. The platform is equipped with over 150 data connectors and bi-directional spreadsheet integrations, enabling finance teams to maintain full control over their data processes. Users can seamlessly work with data from multiple sources using familiar tools such as Excel, Google Sheets, and web-based dashboards. This flexibility caters to a wide range of users, from small businesses to large enterprises, ensuring that finance teams can adapt the platform to their specific needs and workflows. Aleph's no-code tools significantly reduce the time spent on repetitive tasks, eliminating up to 90% of the time-consuming and error-prone busywork typically associated with financial reporting and analysis. By automating these processes, finance teams can redirect their focus towards more strategic initiatives, such as forecasting, budgeting, and performance analysis. This shift not only enhances productivity but also empowers finance professionals to provide deeper insights and make informed decisions that drive business growth. Key features of Aleph include its robust data integration capabilities, user-friendly interface, and powerful analytics tools. The platform's ability to consolidate data from various sources ensures that finance teams have access to accurate and up-to-date information, which is crucial for effective decision-making. Additionally, the intuitive design allows users to create customized reports and dashboards without requiring extensive technical expertise, further enhancing the platform's accessibility. Aleph stands out in the FP&A category by combining advanced AI technology with a user-centric approach, making it a valuable asset for organizations seeking to optimize their financial processes. With hundreds of businesses already relying on Aleph for faster reporting and better insights, the platform continues to demonstrate its effectiveness in transforming the way finance teams operate, ultimately leading to improved decision-making and enhanced organizational performance.

Visit website

Joiin

Smarter Financial Reporting & Consolidation Across Leading Accounting Platforms and Spreadsheets Joiin is a financial reporting and consolidation platform built for businesses and accountants that need fast, accurate, and scalable reporting across single entities and complex multi-entity groups. By connecting to platforms like QuickBooks, Xero, Sage, and more, Joiin replaces spreadsheet-heavy processes with structured, automated reporting. Finance teams can move from delayed, manual workflows to real-time, decision-ready insight. Smarter Financial Reporting Automate management reports, dashboards, and board packs in one platform. Standardise reporting across entities and systems, reduce manual effort, and reuse reporting structures every cycle. Multi-Entity Consolidation, Built for Scale Consolidate multiple entities, currencies, and charts of accounts with precision. Handle intercompany eliminations, multi-currency reporting, and complex group structures without the need for an ERP. Board-Ready Report Packs Create professional, branded report packs with custom layouts, visuals, and automated delivery. Tailor reports for leadership teams, investors, lenders, or clients. AI-Powered Insight and Agents (Joiin Intelligence) Go beyond static reporting with AI-driven analysis. Surface key trends, variances, and performance signals automatically, and generate commentary directly within your reports using Joiin Intelligence. Connect Claude, GPT and leading AI platforms with Joiin's MCP. Live Dashboards & Drill-Down Track performance in real time with live dashboards and KPIs. Drill down from consolidated results to underlying transactions across entities and data sources. Flexible Integrations & Data Access Connect to QuickBooks, Xero, Sage, spreadsheets, and more. Extend reporting into Excel, Power BI, and other tools using Joiin Connect (API) and integrations like Zapier. Transparent, Scalable Pricing All features included on every plan. Unlimited users, no reporting limits, and pricing that scales with your organisation. Security & Governance Enterprise-grade security with encrypted connections, role-based access, audit trails, and strict data controls, ensuring reliable, governed reporting.

Average Rating: 4.7/5.0

Total Reviews: 85

How Do G2 Users Rate Joiin?

  • Custom Reports: 8.7/10 (Category avg: 8.7/10)
  • Report Types: 8.8/10 (Category avg: 8.8/10)
  • Has the product been a good partner in doing business?: 9.5/10 (Category avg: 9.2/10)
  • Custom KPIs: 7.8/10 (Category avg: 8.6/10)

Who Is the Company Behind Joiin?

  • Seller: Joiin
  • Company Website:
  • Year Founded: 2018
  • HQ Location: Exeter, UK
  • Twitter: @joiinreporting
    199 Twitter followers
  • LinkedIn® Page: www.linkedin.com
    15 employees on LinkedIn®

Who Uses This Product?

  • Who Uses This: CFO, Finance Director
  • Top Industries: Accounting, Computer Software
  • Company Size: 62% Small, 35% Medium

What Do G2 Reviewers Say About Joiin?

AI-generated summary from verified user reviews

Pros
  • Users find Joiin to be highly easy to use, facilitating quick financial reporting and intuitive setup processes.
  • Users praise the efficient consolidated reporting of Joiin, appreciating its speed and simplicity across multiple entities and currencies.
  • Users value the reporting efficiency of Joiin, enabling quick and reliable consolidated reports across multiple entities.
  • Users value the responsive customer support of Joiin, ensuring continuous improvement and effective assistance with their needs.
  • Users value the effortless report creation in Joiin, streamlining their consolidation process and saving time.
Cons
  • Users find reporting functionality inefficient, often needing additional adjustments after exports for proper presentation.
  • Users face reporting issues with Joiin, often needing to export data for better formatting and presentation.
  • Users find that the limited reporting capabilities of Joiin require additional steps to finalize management accounts effectively.
  • Users note the missing features in Joiin, such as lack of report titles and sorting options, limiting usability.
  • Users note formatting issues with reports and exports, necessitating additional cleanup before sharing and using effectively.

What Are Recent G2 Reviews of Joiin?

What Are G2 Users Discussing About Joiin?

Spreadsheet Server by insightsoftware

Spreadsheet Server is a centralized reporting and automation solution that connects to an ERP database to pull live information into the native spreadsheet environment. Using a pre-configured add-in for Microsoft Excel and compatible for integration with a myriad of popular ERP systems, Spreadsheet Server eliminates any re-keying or repeated downloading of business data. Users are empowered to not only create reports in a familiar workspace, they can also drill-down substantially into live ERP details without specialist IT knowledge. Blending GL and non-GL data into a single worksheet, Spreadsheet Server's QueryExchange component provides an online repository of pre-configured queries that can be grouped together using the built-in SmartPak feature. In addition, the integrated QueryDesigner promises a user-friendly facility for non-technical users to formulate, design and maintain custom relational database queries. Both these custom queries and those selected pre-configured formulas can be combined to work seamlessly within a single spreadsheet. Spreadsheet Server also aids the sharing of reports by bringing popular workflow operations into Excel, via the Distribution Manager. Here, users can perform printing actions, copying commands and even compose emails with attachments when scheduling a more automated distribution workflow.

Average Rating: 4.4/5.0

Total Reviews: 79

How Do G2 Users Rate Spreadsheet Server by insightsoftware?

  • Custom Reports: 9.3/10 (Category avg: 8.7/10)
  • Report Types: 8.3/10 (Category avg: 8.8/10)
  • Has the product been a good partner in doing business?: 9.4/10 (Category avg: 9.2/10)
  • Custom KPIs: 8.3/10 (Category avg: 8.6/10)

Who Is the Company Behind Spreadsheet Server by insightsoftware?

  • Seller: insightsoftware
  • Year Founded: 2018
  • HQ Location: Raleigh, North Carolina
  • Twitter: @insightsoftware
    801 Twitter followers
  • LinkedIn® Page: www.linkedin.com
    2,266 employees on LinkedIn®

Who Uses This Product?

  • Top Industries: Construction, Accounting
  • Company Size: 105% Medium, 28% Large

What Do G2 Reviewers Say About Spreadsheet Server by insightsoftware?

AI-generated summary from verified user reviews

Pros
  • Users find Spreadsheet Server's ease of use impressive, facilitating quick setup and efficient report generation in Excel.
  • Users appreciate the efficient financial reporting capabilities of Spreadsheet Server, enhancing decision-making through accurate, automated reports.
  • Users appreciate the report creation capabilities of Spreadsheet Server, benefiting from automated and customizable reporting features.
  • Users value the exceptional reporting quality of Spreadsheet Server, delivering accurate insights seamlessly integrated with Excel.
  • Users value the quick and knowledgeable customer support that enhances their experience with Spreadsheet Server.
Cons
  • Users find the slow performance frustrating when opening files, though it can be improved by adjusting settings.
  • Users face integration issues when using legacy ERP databases, requiring custom SQL that diminishes product effectiveness.
  • Users find the limited customization of Spreadsheet Server restrictive, especially with non-standard ERP accounting databases.
  • Users experience performance issues like delays after switching to the cloud, but they have adapted over time.
  • Users experience delays with Project Delays after transitioning to the cloud-based Spreadsheet Server, but have adapted over time.

What Are Recent G2 Reviews of Spreadsheet Server by insightsoftware?

Jet Reports

Fast, Flexible Financial and Business Reporting Inside of Excel. No need to worry about where your data is – Jet Reports takes care of finding and accessing the data you need for reporting. Built-in ERP Smarts empower users to access the data they need and create their own reports, without technical skills. Shrink Reporting Cycles and Effort. Eliminate manual data dumps and speed up reporting cycles by enabling business users to build refreshable reports using easy-to-configure, pre-built templates, or by creating a custom report in minutes. Create accurate charts, graphs, and other visuals that combine the most current data from multiple applications in just a few clicks. Use time savings to focus more on analysis to uncover new insights to improve business performance. Remove IT Dependency and Enable Self-Service Reporting. Eliminate rigid IT reporting projects and delays while reports move from development, test, and then production (often taking weeks): Custom Data Entity Packs for financial reporting mean no need to find a power user or IT expert to help you build . No hard coding or programming skills required, freeing your team to explore data and create or modify reports on their own. Drill Down into Data to Quickly Find and Fix Errors. Always have the answers. Drill into transactional level data directly from Excel. Access and run reports from anywhere on the web with the Jet Hub.

Average Rating: 4.6/5.0

Total Reviews: 23

How Do G2 Users Rate Jet Reports?

  • Custom Reports: 9.6/10 (Category avg: 8.7/10)
  • Report Types: 9.2/10 (Category avg: 8.8/10)
  • Has the product been a good partner in doing business?: 9.7/10 (Category avg: 9.2/10)
  • Custom KPIs: 9.0/10 (Category avg: 8.6/10)

Who Is the Company Behind Jet Reports?

  • Seller: insightsoftware
  • Year Founded: 2018
  • HQ Location: Raleigh, North Carolina
  • Twitter: @insightsoftware
    801 Twitter followers
  • LinkedIn® Page: www.linkedin.com
    2,266 employees on LinkedIn®

Who Uses This Product?

  • Company Size: 65% Medium, 26% Small

What Do G2 Reviewers Say About Jet Reports?

AI-generated summary from verified user reviews

Pros
  • Users praise the intuitive Excel interface of Jet Reports, making financial reporting quick and easy for all skill levels.
  • Users praise the seamless integration with Microsoft Dynamics, making report generation efficient and streamlined.
  • Users praise the reporting efficiency of Jet Reports, highlighting quick, flexible financial reports with real-time data access.
  • Users find the ease of learning Jet Reports intuitive, allowing quick report creation even for beginners.
  • Users value the flexibility in report creation with Jet Reports, enabling customized and efficient financial reporting.
Cons
  • Users find the learning curve steep, requiring significant time investment for maximum benefit from Jet Reports.
  • Users find the learning difficulty significant, requiring time and training to maximize Jet Reports' potential.
  • Users face a steep learning curve with Jet Reports, requiring time and training to maximize its benefits.
  • Users often face performance issues with Jet Reports, experiencing slow report generation and sometimes needing to restart sessions.
  • Users face slow performance with Jet Reports, often forcing them to kill sessions and reload due to delays.

What Are Recent G2 Reviews of Jet Reports?

Cube

Cube is the financial intelligence platform built for the AI-era. We supercharge planning, accelerate analysis, and unify data to unlock the insights that drive better decisions—while giving FP&A teams the freedom to work seamlessly in Excel, Google Sheets, the web, or chat. Cube is the smartest way to work in the tools you love. With native Excel and Google Sheets integrations, Slack and Teams apps, and an AI-powered collaboration suite, Cube helps finance work faster, align better, and guide plans without changing how they work. Founded in New York City by a 3x CFO, Cube now supports thousands of finance professionals across industries including manufacturing, retail, healthcare, education, and more. The platform combines flexibility and scalability in a modern planning environment that’s easy to adopt and powerful to grow with. Cube connects your spreadsheets and source systems to powerful planning, modeling, and analytics without the need for code or consultants. Teams use Cube to operate faster, run what-if scenarios instantly, and deliver real-time insights that help business partners make quick, confident decisions. With Cube, finance teams can: *Get AI-generated business insights * Automate manual tasks * Eliminate version control issues * Collaborate across teams and tools all while working in the spreadsheet and communication apps they already love.

Average Rating: 4.5/5.0

Total Reviews: 144

How Do G2 Users Rate Cube?

  • Custom Reports: 8.6/10 (Category avg: 8.7/10)
  • Report Types: 8.3/10 (Category avg: 8.8/10)
  • Has the product been a good partner in doing business?: 9.3/10 (Category avg: 9.2/10)
  • Custom KPIs: 7.5/10 (Category avg: 8.6/10)

Who Is the Company Behind Cube?

  • Seller: Cube
  • Company Website:
  • Year Founded: 2018
  • HQ Location: New York
  • LinkedIn® Page: www.linkedin.com
    152 employees on LinkedIn®

Who Uses This Product?

  • Who Uses This: Finance Manager
  • Top Industries: Information Technology and Services, Computer Software
  • Company Size: 81% Medium, 16% Small

What Do G2 Reviewers Say About Cube?

AI-generated summary from verified user reviews

Pros
  • Users find Cube to be intuitive and easy to use, allowing for fast implementation and efficient functionality.
  • Users praise the excellent customer support of Cube, highlighting their responsiveness and dedication to user success.
  • Users appreciate the flexibility of Cube, enabling seamless integration and intuitive customization for improved FP&A processes.
  • Users love Cube for its seamless integrations, enhancing efficiency and streamlining financial processes effectively.
  • Users value the customizable dashboards in Cube, allowing quick access to KPIs and in-depth analysis.
Cons
  • Users find the complexity of data transfer with Cube challenging due to its predefined custom dimensions.
  • Users feel the customization options are limited, impacting their ability to fully utilize Cube's capabilities.
  • Users find the dashboard limitations restrictive, desiring enhanced customization and visualization options for better functionality.
  • Users find data transfer complexities with Cube's predefined dimensions challenging, hindering seamless implementation and efficiency.
  • Users face data management issues with Cube, particularly difficulties in data transfer and limited custom dimensions.

What Are Recent G2 Reviews of Cube?

What Are G2 Users Discussing About Cube?

Parallel

Parallel is financial planning software built for early-stage startups. Connect your accounting and Parallel automatically builds a live financial model — so you can track runway and burn, forecast revenue, plan hires, and see the impact of every decision, without building or maintaining a spreadsheet.

Average Rating: 4.9/5.0

Total Reviews: 30

How Do G2 Users Rate Parallel?

  • Custom Reports: 8.6/10 (Category avg: 8.7/10)
  • Report Types: 9.0/10 (Category avg: 8.8/10)
  • Has the product been a good partner in doing business?: 10.0/10 (Category avg: 9.2/10)
  • Custom KPIs: 9.4/10 (Category avg: 8.6/10)

Who Is the Company Behind Parallel?

  • Seller: Parallel
  • Company Website:
  • Year Founded: 2023
  • HQ Location: Lehi, US
  • LinkedIn® Page: www.linkedin.com
    9 employees on LinkedIn®

Who Uses This Product?

  • Who Uses This: CEO
  • Top Industries: Computer Software
  • Company Size: 83% Small, 7% Medium

What Do G2 Reviewers Say About Parallel?

AI-generated summary from verified user reviews

Pros
  • Users appreciate the forecasting capabilities of Parallel, empowering confident decision-making and optimizing spend for growth.
  • Users value the fantastic customer support from Parallel, assisting with budgets, forecasts, and financial reporting effectively.
  • Users appreciate the ease of use of Parallel, allowing non-technical founders to efficiently manage finances and forecasts.
  • Users value the efficiency of Parallel, enabling quick decision-making and simplifying financial modeling for their startups.
  • Users highlight the easy setup of Parallel, enabling quick onboarding and efficient financial planning in hours.
Cons
  • Users report occasional software bugs, though many have experienced improved stability over time with Parallel.
  • Users faced download issues with financials, but appreciated the team's quick response to feedback.
  • Users face a learning curve with Parallel due to finance concepts, but support mitigates challenges effectively.
  • Users experience a limited visualization of financial data in Parallel, making initial understanding challenging without prior expertise.
  • Users desire more features from Parallel to enhance its functionality as a complete accounting system.

What Are Recent G2 Reviews of Parallel?

Global Database Risk Intelligence

When it comes to making informed business decisions, the integrity and comprehensiveness of your data sources matter. Global Database presents its Business Credit Reports - an unparalleled tool designed to offer businesses a comprehensive insight into the financial stability and creditworthiness of companies worldwide. Key Features: Comprehensive Financial Data: Gain access to detailed financial histories, including income statements, balance sheets, cash flow statements, and key financial ratios. Credit Risk Insights: Evaluate potential risks with our credit scores and ratings, allowing you to make well-informed decisions, minimize bad debts, and optimize credit terms. Global Coverage: Our database covers businesses from numerous sectors and countries, ensuring you have a global perspective regardless of where you operate. Real-time Updates: Stay ahead of the curve. Our reports are updated in real-time, ensuring that you have the most recent data at your fingertips. User-friendly Interface: Access information seamlessly with our intuitive interface, making it easier for businesses of all sizes to gather insights and analytics. Advanced Analytics: Beyond raw data, benefit from in-depth analytics that help in identifying trends, growth rates, and predicting future financial health.

Average Rating: 4.7/5.0

Total Reviews: 39

How Do G2 Users Rate Global Database Risk Intelligence?

  • Custom Reports: 10.0/10 (Category avg: 8.7/10)
  • Report Types: 10.0/10 (Category avg: 8.8/10)
  • Has the product been a good partner in doing business?: 10.0/10 (Category avg: 9.2/10)
  • Custom KPIs: 10.0/10 (Category avg: 8.6/10)

Who Is the Company Behind Global Database Risk Intelligence?

Who Uses This Product?

  • Top Industries: Information Technology and Services, Transportation/Trucking/Railroad
  • Company Size: 108% Small, 49% Medium

What Do G2 Reviewers Say About Global Database Risk Intelligence?

AI-generated summary from verified user reviews

Pros
  • Users appreciate the ease of use of Global Database Risk Intelligence, benefiting from intuitive dashboards and quick data access.
  • Users value the seamless integrations of Global Database, enhancing data reliability and streamlining reporting processes.
  • Users value the intuitive and seamless dashboards of Global Database Risk Intelligence for easy risk assessment and integration.
  • Users value the comprehensive insights of Global Database Risk Intelligence, benefiting from detailed historical data and intuitive dashboards.
  • Users appreciate the easy-to-navigate dashboards of Global Database Risk Intelligence, enhancing clarity in metrics and reports.
Cons
  • Users note a lack of customization options in reports, limiting their ability to tailor data for different departments.
  • Users experience slow performance during peak times, with reports loading slowly and filters being tricky initially.
  • Users notice a lack of customization options for reports, leading to some challenges in tailoring financial presentations.
  • Users experience slow loading times, especially with detailed reports and advanced filters, affecting efficiency.
  • Users experience complex setup times, particularly during initial customization and integration, but enjoy smooth operation afterward.

What Are Recent G2 Reviews of Global Database Risk Intelligence?

Infor F9

Infor F9 is a robust financial reporting and analysis solution that seamlessly integrates with Microsoft Excel, enabling organizations to dynamically link their general ledger data for real-time insights. This user-friendly add-in allows finance professionals to create dynamic, reusable reports swiftly, eliminating the need for manual data entry and exports. By leveraging the familiar Excel environment, F9 enhances reporting speed and accuracy, providing stakeholders with timely information to support strategic decision-making. Key Features and Functionality: - Real-Time General Ledger Access: F9 provides live connections to over 150 general ledger and ERP systems, ensuring reports always reflect the most current data. - Automated Reporting Processes: The solution automates manual tasks by directly linking GL data to Excel, significantly reducing report-building time and minimizing errors. - Excel-Based Interface: As an Excel add-in, F9 allows users to apply all native Excel functionalities to their reports, facilitating a quick learning curve and ease of use. - Minimal IT Involvement: F9's straightforward implementation, often completed in as little as 20 minutes, requires minimal IT assistance, allowing finance teams to maintain control over their reporting processes. - Flexible Data Connectivity: The software supports data consolidation from various sources, including on-premises databases and cloud storage, without the need for complex coding. Primary Value and User Benefits: Infor F9 addresses the common challenges of financial reporting by providing a direct, real-time link between an organization's general ledger and Excel. This integration eliminates the need for manual data transfers, reducing the risk of errors and saving valuable time. Finance teams can focus more on analyzing data and strategic planning rather than on the mechanics of report generation. The familiar Excel interface ensures a smooth user experience, while the solution's flexibility and scalability make it suitable for companies of all sizes and industries. By streamlining the reporting process, F9 empowers organizations to make informed decisions based on accurate and up-to-date financial information.

Average Rating: 3.4/5.0

Total Reviews: 11

How Do G2 Users Rate Infor F9?

  • Custom Reports: 7.6/10 (Category avg: 8.7/10)
  • Report Types: 6.9/10 (Category avg: 8.8/10)
  • Has the product been a good partner in doing business?: 8.0/10 (Category avg: 9.2/10)
  • Custom KPIs: 8.1/10 (Category avg: 8.6/10)

Who Is the Company Behind Infor F9?

  • Seller: Infor
  • Year Founded: 2002
  • HQ Location: New York
  • Twitter: @Infor
    18,472 Twitter followers
  • LinkedIn® Page: www.linkedin.com
    22,257 employees on LinkedIn®
  • Phone: 800-260-2640

Who Uses This Product?

  • Company Size: 55% Medium, 36% Small

What Do G2 Reviewers Say About Infor F9?

AI-generated summary from verified user reviews

Pros
  • Users appreciate the collaboration capabilities of Infor F9, enabling seamless teamwork and flexibility from any location.
  • Users appreciate the customization options of Infor F9, enhancing flexibility for remote teamwork and detailed reporting.
  • Users value the reporting efficiency of Infor F9, benefiting from detailed tools that track progress effectively.
Cons
  • Users face a steep learning curve initially, which requires time for training before achieving smooth operation.

What Are Recent G2 Reviews of Infor F9?

What Are G2 Users Discussing About Infor F9?

Jedox

Jedox is the world’s most adaptable planning and performance management platform that empowers organizations to deliver plans that outperform expectations. Over 2,900 organizations in 140 countries trust Jedox to model any scenario, integrate data from any source and simplify cross-organizational plans across all business systems. Jedox enables a culture of decisiveness and confidence so teams can plan for opportunities, react quickly to changes, and uncover what they didn’t know was possible. ​ ​

Average Rating: 4.3/5.0

Total Reviews: 158

How Do G2 Users Rate Jedox?

  • Custom Reports: 8.7/10 (Category avg: 8.7/10)
  • Report Types: 8.7/10 (Category avg: 8.8/10)
  • Has the product been a good partner in doing business?: 8.5/10 (Category avg: 9.2/10)
  • Custom KPIs: 8.5/10 (Category avg: 8.6/10)

Who Is the Company Behind Jedox?

  • Seller: Jedox
  • Company Website:
  • Year Founded: 2002
  • HQ Location: Freiburg, Germany
  • Twitter: @Jedox
    1,673 Twitter followers
  • LinkedIn® Page: www.linkedin.com
    400 employees on LinkedIn®

Who Uses This Product?

  • Who Uses This: Controller
  • Top Industries: Information Technology and Services, Accounting
  • Company Size: 51% Medium, 28% Small

What Do G2 Reviewers Say About Jedox?

AI-generated summary from verified user reviews

Pros
  • Users admire the ease of use of Jedox, noting its intuitive interface and smooth onboarding process.
  • Users value the seamless budgeting management in Jedox, integrating various operations and enhancing data relationships.
  • Users value Jedox for its flexibility, enabling fast implementation and smooth integration with existing systems.
  • Users value Jedox for its effective forecasting capabilities, enhancing planning and streamlining reporting processes significantly.
  • Users value the robust integrations of Jedox, seamlessly connecting data from multiple systems for enhanced planning.
Cons
  • Users find the complex modeling process challenging, especially with large datasets and a less intuitive interface.
  • Users struggle with the learning curve of Jedox, finding it challenging and time-consuming to master the platform.
  • Users find the complexity of model building in Jedox challenging, requiring extensive training and technical expertise.
  • Users find that learning Jedox can be difficult, requiring extensive training and technical expertise for effective use.
  • Users find slow loading times with Jedox, especially for complex reports and opening forms, affecting productivity.

What Are Recent G2 Reviews of Jedox?

What Are G2 Users Discussing About Jedox?

Bluecopa

Most enterprise finance stacks are a fragmented collection of point solutions — AR, AP, reconciliation, and close all managed in separate tools that don't talk to each other. Bluecopa is a unified, AI-native finance operations platform that connects Order-to-Cash, Procure-to-Pay, and Record-to-Report in one system. Powered by SamyxAI, the platform automates cash application, collections, deduction management, AP workflows, reconciliation, and financial close — so enterprise finance teams stay accurate, audit-ready, and fast at scale. Bluecopa integrates with 200+ ERP and business systems, is deployed on GCP, and is SOC 2 Type 2 and ISO 27001 certified. Finance leaders at Flipkart, Diversey, Purplle, Yatra, Porter, and Curefoods run on Bluecopa.

Average Rating: 4.8/5.0

Total Reviews: 26

How Do G2 Users Rate Bluecopa?

  • Custom Reports: 9.2/10 (Category avg: 8.7/10)
  • Report Types: 9.5/10 (Category avg: 8.8/10)
  • Has the product been a good partner in doing business?: 9.8/10 (Category avg: 9.2/10)
  • Custom KPIs: 8.9/10 (Category avg: 8.6/10)

Who Is the Company Behind Bluecopa?

  • Seller: Bluecopa
  • Year Founded: 2021
  • HQ Location: Hyderabad, IN
  • LinkedIn® Page: www.linkedin.com
    145 employees on LinkedIn®

Who Uses This Product?

  • Top Industries: Computer Software, Information Technology and Services
  • Company Size: 42% Large, 38% Small

What Do G2 Reviewers Say About Bluecopa?

AI-generated summary from verified user reviews

Pros
  • Users appreciate the time-saving capabilities of Bluecopa, streamlining finance operations and enhancing overall productivity.
  • Users value the automation capabilities of Bluecopa, enhancing reconciliation efforts and streamlining workflows seamlessly.
  • Users praise the excellent customer support of Bluecopa, appreciating the hands-on approach and timely assistance.
  • Users appreciate the ease of use of Bluecopa for tracking tasks and enhancing collaboration effortlessly.
  • Users value the enhanced collaboration with Bluecopa, streamlining operations across all finance teams in one platform.
Cons
  • Users find the slow performance of Bluecopa frustrating, as tasks can take time to appear and system responsiveness issues arise.
  • Users experience a challenging learning curve with Bluecopa, requiring time to become familiar with the software.
  • Users find Bluecopa's limited functionality inadequate for large enterprises, particularly in intercompany management and workflow automation.
  • Users experience glitches and slowness in Bluecopa, sometimes requiring assistance from helpful support.
  • Users find the dashboard issues frustrating, citing a need for improved innovation and more diverse reporting options.

What Are Recent G2 Reviews of Bluecopa?

Celonis

Celonis makes processes work — for people, companies, and the planet. Powered by process mining and AI, the Celonis Process Intelligence Platform integrates process data and business context to create a living digital twin of business operations. We enable thousands of companies worldwide to understand how their business actually runs and, together with their partners, build intelligent solutions that transform and continuously improve the way they operate — unlocking billions in value. Celonis is headquartered in Munich, Germany, and New York City, USA, with more than 20 offices worldwide. © 2026 Celonis SE. All rights reserved. Celonis and the Celonis “droplet” logo are trademarks or registered trademarks of Celonis SE in Germany and other jurisdictions. All other product and company names are trademarks or registered trademarks of their respective owners.

Average Rating: 4.5/5.0

Total Reviews: 287

How Do G2 Users Rate Celonis?

  • Custom Reports: 8.5/10 (Category avg: 8.7/10)
  • Report Types: 8.3/10 (Category avg: 8.8/10)
  • Has the product been a good partner in doing business?: 8.8/10 (Category avg: 9.2/10)
  • Custom KPIs: 8.9/10 (Category avg: 8.6/10)

Who Is the Company Behind Celonis?

  • Seller: Celonis
  • Company Website:
  • Year Founded: 2011
  • HQ Location: New York
  • Twitter: @Celonis
    17,449 Twitter followers
  • LinkedIn® Page: www.linkedin.com
    3,848 employees on LinkedIn®

Who Uses This Product?

  • Who Uses This: Senior Consultant, Analyst
  • Top Industries: Information Technology and Services, Oil & Energy
  • Company Size: 63% Large, 20% Small

What Do G2 Reviewers Say About Celonis?

AI-generated summary from verified user reviews

Pros
  • Users value the user-friendly interface of Celonis, making complex data easily accessible for all team members.
  • Users value the efficiency of real-time insights from Celonis, facilitating swift identification of process improvements.
  • Users value the exceptional visibility Celonis provides into business processes, enabling quick identification of inefficiencies and improvements.
  • Users appreciate the user-friendly interface of Celonis, enjoying smooth navigation and powerful insights for decision-making.
  • Users value the user-friendly environment of Celonis, making it accessible for everyone while delivering powerful analysis features.
Cons
  • Users find the learning curve steep, necessitating considerable training and technical effort for effective use of Celonis.
  • Users find the complexity of initial setup and navigation in Celonis to be overwhelming for beginners.
  • Users express concerns about missing features, as new capabilities often require additional licensing and support is slow.
  • Users note limited features in Celonis, particularly in the filter bar and Copilot functionalities, hindering usability.
  • Users experience slow performance with occasional processing delays and minor bugs impacting the overall efficiency.

What Are Recent G2 Reviews of Celonis?

What Are G2 Users Discussing About Celonis?

Budgyt

Budgyt is database-driven budgeting software that replaces Excel budgets entirely - eliminating formula errors, version control chaos, and the career-ending risk of broken budgets in board meetings. Unlike platforms built on top of Excel that perpetuate formula risks, Budgyt uses a pure database foundation where two plus two always equals four. No #REF errors. No broken rollups. No more frantically hunting through hidden worksheets while your board watches. Purpose-built for finance teams with board accountability. Whether you're a nonprofit managing grant allocation across multiple programs, a professional services firm tracking practice profitability, or a growing business with complex department structures, Budgyt solves the collaboration and control problems Excel can't. Why 800+ organizations and 6,000 users have trusted Budgyt: Unbreakable formulas. Database-driven calculations mean your budget never breaks. Your team contributes safely without touching your master budget. No more "did I break something?" panic or weekend formula archaeology. Complete audit trail. Click any number to see exactly how it was calculated. From summary to transaction detail in two clicks. No more "let me get back to you" moments that kill credibility in board meetings. True collaboration. Unlimited users included (no per-seat fees). Department heads and program managers contribute directly while you maintain complete control. Granular permissions protect sensitive data like payroll while enabling transparency. Implementation in days. Deep API integrations with several accounting platforms (QuickBooks, Xero, NetSuite, Sage Intacct, Microsoft Business Central) automatically map your chart of accounts, departments, and dimensions. Start budgeting immediately. Recognized by G2 as Users Most Likely to Recommend, Easiest to Do Business With, and Easiest Admin. Starting at $399/month with unlimited users included. Budget with confidence. Present without fear.

Average Rating: 4.8/5.0

Total Reviews: 107

How Do G2 Users Rate Budgyt?

  • Custom Reports: 8.5/10 (Category avg: 8.7/10)
  • Report Types: 8.9/10 (Category avg: 8.8/10)
  • Has the product been a good partner in doing business?: 9.7/10 (Category avg: 9.2/10)
  • Custom KPIs: 8.1/10 (Category avg: 8.6/10)

Who Is the Company Behind Budgyt?

  • Seller: Budgyt
  • Company Website:
  • Year Founded: 2013
  • HQ Location: New York, NY
  • Twitter: @budgyt
    115 Twitter followers
  • LinkedIn® Page: www.linkedin.com
    14 employees on LinkedIn®

Who Uses This Product?

  • Who Uses This: Controller, CFO
  • Top Industries: Non-Profit Organization Management, Computer Software
  • Company Size: 61% Medium, 36% Small

What Do G2 Reviewers Say About Budgyt?

AI-generated summary from verified user reviews

Pros
  • Users commend Budgyt for its ease of use, enabling seamless data uploads and straightforward presentations for efficient management.
  • Users praise Budgyt for its affordable pricing and user-friendly interface, enhancing budget management for non-profits.
  • Users praise Budgyt for its responsive customer support, which is attentive and available around the clock.
  • Users love the easy budgeting process with Budgyt, appreciating its multiple layers and excellent support.
  • Users appreciate the budgeting efficiency of Budgyt, which simplifies processes and improves visibility across multiple locations.
Cons
  • Users face integration issues with Budgyt, particularly in managing multiple companies and lacking full automation capabilities.
  • Users find Budgyt expensive, particularly with high initial setup costs that may not align with its value.
  • Users find the inefficient reporting in Budgyt lacking in presentation and customization for non-financial audiences.
  • Users find a learning difficulty with Budgyt, especially those unfamiliar with accounting practices, complicating usage.
  • Users face limitations in integration capabilities with Budgyt, particularly when managing multiple entities effectively.

What Are Recent G2 Reviews of Budgyt?

What Are G2 Users Discussing About Budgyt?

Abacum

Abacum is an AI-native Financial Planning and Analysis (FP&A) platform designed to enhance business performance through clarity, speed, and impactful decision-making. This innovative solution provides users with instant access to essential operational and financial key performance indicators (KPIs) all in one centralized location. With just a single click, users can automate management reporting, forecast revenue, plan headcount, budget operational expenditures (OPEX), and run multiple scenarios, all seamlessly integrated within the Abacum environment. Targeted primarily at mid-market companies, Abacum caters to finance teams seeking a robust yet user-friendly solution for their planning and analysis needs. The platform stands out by combining intuitive workflows with enterprise-grade flexibility, allowing users to create collaborative plans, analyze performance in real time, and share valuable insights that drive business progress. Its ability to integrate with over 700 systems, including ERP, CRM, HRIS, and data warehouses, ensures that all data is automatically synced, cleaned, structured, and consistently up to date, thus eliminating the need for manual data handling. One of the key features of Abacum is its multi-dimensional modeling engine, which empowers finance teams to conduct complex analyses and scenario planning with ease. This capability, coupled with collaborative workflows, facilitates seamless business partnering across various functions within an organization. As a result, finance teams can plan and report up to 75% faster, significantly improving efficiency and allowing them to focus on strategic initiatives rather than time-consuming manual processes. Abacum is designed to support fast-growing companies and industry leaders, including names such as Strava, Dish Networks, JG Wentworth, BetterUp, Factorial, Kajabi, Abridge, and Aiven. By providing a scalable FP&A solution that balances power with simplicity, Abacum enables organizations to navigate the complexities of financial planning and analysis confidently.

Average Rating: 4.7/5.0

Total Reviews: 151

How Do G2 Users Rate Abacum?

  • Custom Reports: 9.3/10 (Category avg: 8.7/10)
  • Report Types: 9.1/10 (Category avg: 8.8/10)
  • Has the product been a good partner in doing business?: 9.5/10 (Category avg: 9.2/10)
  • Custom KPIs: 9.4/10 (Category avg: 8.6/10)

Who Is the Company Behind Abacum?

  • Seller: Abacum
  • Company Website:
  • Year Founded: 2020
  • HQ Location: New York, US
  • Twitter: @Abacum_ai
  • LinkedIn® Page: www.linkedin.com
    151 employees on LinkedIn®

Who Uses This Product?

  • Who Uses This: CFO, Head of Finance
  • Top Industries: Computer Software, Financial Services
  • Company Size: 88% Medium, 6% Small

What Do G2 Reviewers Say About Abacum?

AI-generated summary from verified user reviews

Pros
  • Users commend the ease of use of Abacum, enhancing flexibility and efficiency in reporting and analysis.
  • Users commend the incredible support team at Abacum for their quick responses and helpful assistance.
  • Users value the time-saving features of Abacum, enabling swift financial planning and streamlined collaborative efforts.
  • Users highlight the efficiency of Abacum, significantly reducing reporting time and enhancing analytical flexibility.
  • Users praise Abacum's powerful features that enhance financial planning with real-time forecasting, integrations, and user-friendly collaboration.
Cons
  • Users face a steep learning curve with Abacum, making the initial setup challenging for newcomers.
  • Users find the complex setup challenging, with a steep learning curve and potential performance issues during initial configuration.
  • Users face a steep learning curve during initial setup, requiring training to efficiently navigate the platform.
  • Users find the steep learning curve challenging, requiring careful navigation during initial setup and data migration.
  • Users find the difficult setup process time-consuming and complex, requiring focused effort to navigate effectively.

What Are Recent G2 Reviews of Abacum?

What Are G2 Users Discussing About Abacum?

Phocas Software

Phocas Software delivers cloud-based business intelligence (BI) and financial planning and analysis (FP&A) solutions for mid-market businesses in wholesale distribution, manufacturing, and retail. Phocas delivers an intuitive, accessible platform that simplifies data analysis and financial planning, empowering organizations to make confident, data-driven decisions. Seamlessly integrating with ERP systems and any other source, Phocas consolidates data into a centralized platform. Unlocking the potential of ERP data and delivering improvements at every business level. Its BI core enables users to explore data, spot trends, and find opportunities. FP&A tools support dynamic financial reporting, flexible budgeting, performance tracking and accurate forecasts. Plus, Phocas offers automated rebate management. Phocas Analytics A BI tool that connects businesses around one central data source. It’s fast, secure and designed to be self-serve for everyone. Up-to-date data is easy to access and explore empowering people to understand and improve the business at any level – by branch, division, sales, product, customer. • Data consolidation: ERP + other data sources automatically consolidated into a centralized platform • AI natural language: query data using Phocas AI and get instant answers • Drill down: Explore data from high-level overviews to transactional detail • Enhanced analysis: Flexible pivot tables enable custom data analysis • Ad hoc reporting: Build custom reports and dashboards in minutes and with ease • Visualizations & dashboards: Transform live data into custom dashboards, charts, graphs and sparklines Phocas Financial Statements Designed to help businesses easily and accurately report on their financial health and performance. ERP numbers are transformed into dynamic profit and loss (income statement), balance sheet and cashflow statements. Empowering users to quickly explore data in detail and to proactively solve problems. • Customize: Easily adjust statements to suit cross-functional teams • Fast: speed up month-end with automated financial data consolidation and reporting • Live actuals: work with reliable, up-to-date actuals with formulas and ratios baked into the tool • Drill down: slice, dice and drill down to transaction-level detail • Side-by-side analysis: compare statements across different periods, branches, divisions • User-based access: secure visibility and direction for end business users Phocas Budgets & Forecasts Consolidates planning across the business in one place – financial budgets, sales forecasts, headcount, demand planning. As easy to use as a spreadsheet, just faster and custom-built. • Automated: budgets and forecasts are populated with live ERP data so actuals are always reliable • Flexible: adapts to growing business needs; handles increased complexity, detailed planning • Easy tracking: use live actuals to regularly track performance, compare to budgets, quickly reforecast • Collaborative: assignment, submission and approval processes make cross-functional input quick and stress-free • Versatile: facilitates driver-based, multi-level, 3-statement budgeting, unlimited scenario planning Phocas Rebates Automated payable and receivable rebate management that improves accuracy and delivers more profitable outcomes. A self-serve tool that makes it easy to identify trends, spot near misses, and assess overall performance. With real-time updates, users can quickly optimize product offers, pricing, and purchasing decisions to align with emerging opportunities. Enabling businesses to maximize profitability and strengthen partnerships.

Average Rating: 4.6/5.0

Total Reviews: 189

How Do G2 Users Rate Phocas Software?

  • Custom Reports: 8.9/10 (Category avg: 8.7/10)
  • Report Types: 8.9/10 (Category avg: 8.8/10)
  • Has the product been a good partner in doing business?: 9.0/10 (Category avg: 9.2/10)
  • Custom KPIs: 9.0/10 (Category avg: 8.6/10)

Who Is the Company Behind Phocas Software?

  • Seller: Phocas Software
  • Company Website:
  • Year Founded: 1999
  • HQ Location: Sydney, AU
  • LinkedIn® Page: www.linkedin.com
    331 employees on LinkedIn®

Who Uses This Product?

  • Top Industries: Wholesale, Electrical/Electronic Manufacturing
  • Company Size: 66% Medium, 22% Small

What Do G2 Reviewers Say About Phocas Software?

AI-generated summary from verified user reviews

Pros
  • Users appreciate the ease of use of Phocas Software, enabling straightforward data interpretation and effective decision-making.
  • Users praise Phocas Software for its intuitive capabilities that simplify data analysis and enhance decision-making.
  • Users value fast and clear data analysis in Phocas Software, facilitating informed decision-making with ease.
  • Users value the easy report creation in Phocas Software, enabling quick, defensible insights for decision-making.
  • Users appreciate the reporting efficiency of Phocas Software, enabling quick, credible insights for informed decision-making.
Cons
  • Users find feature improvements necessary for Phocas Software, particularly in budgeting and user experience at scale.
  • Users note that improvements are needed in data handling, budgeting, and user experience for better efficiency.
  • Users report missing features in Phocas Software, impacting operational efficiency and user experience in complex environments.
  • Users express frustration over missing functionality like real-time data access and limited contract-level intelligence in Phocas Software.
  • Users report encountering bugs and date format issues that complicate setup and lead to time-consuming troubleshooting.

What Are Recent G2 Reviews of Phocas Software?

What Are G2 Users Discussing About Phocas Software?

Upmetrics

Upmetrics is a business plan software revolutionizing business planning with AI, helping entrepreneurs and small business owners find success in their business planning processes and growth strategies. Writing a business plan is easier than ever with Upmetrics AI Assistant! It can help you generate text, rewrite content, shorten or expand it, and also allows you to adjust the tone. The tool simplifies writing a business plan with step-by-step guidance, 400+ sample business plans, and automated financials. Using Upmetrics to create a polished and comprehensive business plan will attract investors and encourage them to invest in your idea. Planning to expand your business? Forecast financials, prepare a budget, and make confident financial decisions with Upmetrics. Upmetrics is used by over 110K+ entrepreneurs worldwide to plan their businesses and collaborate with remote teams, working on creating growth strategies. That’s not it—the software makes it easier to keep track of your projects and customize your plans, so you spend less time planning and more focusing on your primary business objectives.

Average Rating: 4.7/5.0

Total Reviews: 29

How Do G2 Users Rate Upmetrics?

  • Custom Reports: 9.3/10 (Category avg: 8.7/10)
  • Report Types: 10.0/10 (Category avg: 8.8/10)
  • Has the product been a good partner in doing business?: 10.0/10 (Category avg: 9.2/10)
  • Custom KPIs: 9.7/10 (Category avg: 8.6/10)

Who Is the Company Behind Upmetrics?

  • Seller: Upmetrics
  • Year Founded: 2019
  • HQ Location: 1301 N Broadway STE 32302 Los Angeles, CA 90012
  • Twitter: @upmetrics
    186 Twitter followers
  • LinkedIn® Page: www.linkedin.com
    35 employees on LinkedIn®

Who Uses This Product?

  • Top Industries: Computer Software
  • Company Size: 86% Small, 14% Medium

What Do G2 Reviewers Say About Upmetrics?

AI-generated summary from verified user reviews

Pros
  • Users value Upmetrics for its time-saving features, streamlining business planning and enabling focus on core activities.
  • Users value the incredible support team of Upmetrics, noting their quick and effective assistance.
  • Users find Upmetrics to be extremely user-friendly, simplifying the business planning process and maintaining organization effortlessly.
  • Users appreciate how Upmetrics offers a powerful AI business plan generator that simplifies goal organization and financial projections.
  • Users value the financial management features of Upmetrics, which streamline projections and keep goals organized.
Cons
  • Users desire more business templates and customization options to enhance their experience with Upmetrics.
  • Users express concerns over affordability issues, as valuable features like AI Assistant are only available to premium users.
  • Users express a desire for improved integration with Quickbooks to enhance financial data handling and forecasting accuracy.
  • Users find the limited integration with accounting software a significant drawback, hindering seamless financial management.
  • Users desire more templates and improved documentation to enhance their overall experience with Upmetrics.

What Are Recent G2 Reviews of Upmetrics?

What Are G2 Users Discussing About Upmetrics?

Clockwork.ai

The clarity a CFO brings, for companies without one. Clockwork is AI FP&A for QuickBooks and Xero businesses. Get cash flow forecasts, scenarios, and live dashboards built from your QuickBooks, Xero, or Excel data in minutes, not weeks. Meet Mira, your AI FP&A analyst. She runs your forecasts, builds scenarios, plans headcount, and explains why your numbers look the way they do — doing the work of a three-person FP&A team at a fraction of the cost, and she never clocks out. Trusted by 3,000+ businesses.

Average Rating: 4.9/5.0

Total Reviews: 46

How Do G2 Users Rate Clockwork.ai?

  • Custom Reports: 9.7/10 (Category avg: 8.7/10)
  • Report Types: 9.7/10 (Category avg: 8.8/10)
  • Has the product been a good partner in doing business?: 9.9/10 (Category avg: 9.2/10)
  • Custom KPIs: 9.7/10 (Category avg: 8.6/10)

Who Is the Company Behind Clockwork.ai?

  • Seller: Clockwork
  • Company Website:
  • Year Founded: 2018
  • HQ Location: Chicago, US
  • Twitter: @Clockwork_AI
    118 Twitter followers
  • LinkedIn® Page: www.linkedin.com
    13 employees on LinkedIn®

Who Uses This Product?

  • Top Industries: Accounting
  • Company Size: 91% Small, 9% Medium

What Do G2 Reviewers Say About Clockwork.ai?

AI-generated summary from verified user reviews

Pros
  • Users rave about the exceptional customer support from Clockwork.ai, making implementation and ongoing use seamless and effective.
  • Users praise the ease of implementation with Clockwork.ai, highlighting its user-friendly design and exceptional support.
  • Users love the intuitive integration and customization capabilities of Clockwork.ai, making financial modeling effortless and efficient.
  • Users find Clockwork.ai's customizability exceptional, allowing tailored solutions without extensive effort or wasted time.
  • Users love the easy customization capabilities of Clockwork.ai, enhancing their business models effortlessly and efficiently.
Cons
  • Users note some performance issues with Clockwork.ai, particularly regarding loading and update times, though it's generally acceptable.
  • Users find that Clockwork.ai can be slow to load at times, impacting the overall user experience.
  • Users experience slow performance with Clockwork.ai, leading to delays in loading times during use.
  • Users note that the update issues cause slight delays, but consider them manageable given the data being processed.

What Are Recent G2 Reviews of Clockwork.ai?

Nathan Calabrese
NC
Researched and written by Nathan Calabrese
Updated October 3, 2024