Best GIS Software

How Many GIS Software Products Does G2 Track?

Total Products under this Category: 353

Category Stats (Aug 2026)

  • Average Rating: 4.28/5 The average rating of products in this category, based on all submitted ratings
  • Top Trending Product: Octave Alto SDKs (Luciad) (+3.41%) - Among all products in this category, Octave Alto SDKs (Luciad) recorded the largest rating increase compared to last month

Last updated: August 06, 2026

How Does G2 Rank GIS Software Products?

Why You Can Trust G2's Software Rankings:

  • 30 Analysts and Data Experts
  • 8,000+ Authentic Reviews
  • 353+ Products
  • Unbiased Rankings

G2's software rankings are built on verified user reviews, rigorous moderation, and a consistent research methodology maintained by a team of analysts and data experts. Each product is measured using the same transparent criteria, with no paid placement or vendor influence. While reviews reflect real user experiences, which can be subjective, they offer valuable insight into how software performs in the hands of professionals. Together, these inputs power the G2 Score, a standardized way to compare tools within every category.

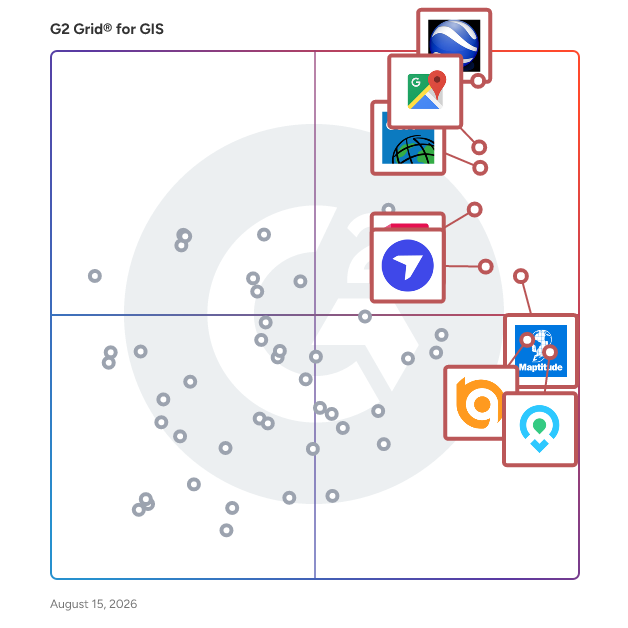
G2 Grid® for GIS Software

G2 Grid® for GIS Software plotting products by satisfaction and market presence

Highlighted products: Google Earth Pro, Google Maps Platform, Esri ArcGIS, AutoCAD, Maptitude, DroneDeploy, Mapme, and BatchGeo.

Underlying data: [Grid® JSON](https://www.g2.com/categories/gis/grids.json?focus%5B%5D=google-earth-pro&focus%5B%5D=google-maps-platform&focus%5B%5D=esri-arcgis&focus%5B%5D=autocad&focus%5B%5D=maptitude&focus%5B%5D=dronedeploy&focus%5B%5D=mapme&focus%5B%5D=batchgeo)

Sponsored

Smarty

Smarty offers global address verification, address validation, and geocoding via API, bulk upload, and a collection of 3rd party integrations that transform how organizations handle address data. With real-time address autocomplete, correction, standardization, and validation, it guarantees the accuracy and reliability of addresses. Smarty's US rooftop geocoding, reverse geocoding, and property data APIs help you enrich and hone your address data. These powerful APIs have far-reaching benefits, from improving the efficiency of your marketing campaigns to enhancing data analysis and operational processes.

Visit website

Google Earth Pro

Google Earth Pro is a comprehensive desktop application that offers an immersive 3D representation of the Earth's surface, combining high-resolution satellite imagery, aerial photography, and geographic information system (GIS) data. Designed for professionals and enthusiasts alike, it provides advanced tools for geographic analysis, visualization, and presentation. Users can explore diverse terrains, urban landscapes, and historical imagery, making it a versatile platform for various applications. Key Features and Functionality: - High-Resolution Printing: Export and print map images up to 4800x3200 pixels, suitable for detailed reports and presentations. - Historical Imagery Viewer: Access archived satellite and aerial images to analyze changes over time, such as urban development or environmental shifts. - GIS Data Import Support: Import various spatial data formats, including ESRI Shapefiles, for comprehensive geographic analysis. - Movie Creation: Record and export guided tours or area walkthroughs as video files, enhancing presentations and storytelling. - Advanced Measurement Tools: Measure 3D buildings, calculate areas of polygons or circles, and assess distances with precision. Primary Value and User Solutions: Google Earth Pro empowers users to conduct in-depth geographic analyses without the need for expensive GIS software. Its advanced features facilitate tasks such as site selection, environmental monitoring, urban planning, and educational projects. By providing access to high-resolution imagery and robust analytical tools, it enables users to visualize and interpret spatial data effectively, supporting informed decision-making and comprehensive presentations.

Average Rating: 4.6/5.0

Total Reviews: 373

How Do G2 Users Rate Google Earth Pro?

  • Data Capture: 8.8/10 (Category avg: 8.6/10)
  • Data Visualization: 8.9/10 (Category avg: 8.6/10)
  • Ease of Use: 8.9/10 (Category avg: 8.4/10)
  • Spatial Analysis: 8.5/10 (Category avg: 8.4/10)

Who Is the Company Behind Google Earth Pro?

  • Seller: Google
  • Year Founded: 1998
  • HQ Location: Mountain View, CA
  • Twitter: @google
    31,899,995 Twitter followers
  • LinkedIn® Page: www.linkedin.com
    341,888 employees on LinkedIn®
  • Ownership: NASDAQ:GOOG

Who Uses This Product?

  • Who Uses This: Project Manager, Project Engineer
  • Top Industries: Civil Engineering, Construction
  • Company Size: 42% Medium, 42% Small

What Do G2 Reviewers Say About Google Earth Pro?

AI-generated summary from verified user reviews

Pros
  • Users value the 3D visualization features of Google Earth Pro for effective sewer line design and drone scouting.
  • Users commend Google Earth Pro for its detailed geospatial analysis capabilities, enhancing exploration and business insights.
  • Users value the address validation feature in Google Earth Pro for its accuracy in locating places effortlessly.
  • Users value the customization options in Google Earth Pro for tailored analyses suited to their business needs.
  • Users find the ease of use in Google Earth Pro beneficial for sewer line design and ground level visualization.
Cons
  • Users express frustration over the non user-friendly interface, especially when trying to manage language settings in Google Earth Pro.
  • Users find the lack of cloud synchronization inconvenient for sharing saved places and pins in Google Earth Pro.
  • Users face image quality issues and organization challenges, leading to frustration in navigating Google Earth Pro effectively.
  • Users are frustrated with the licensing issues that prevent easy switching to English-only place names on Google Earth Pro.
  • Users find Google Earth Pro's performance sluggish and outdated, particularly on older hardware systems, affecting usability.

What Are Recent G2 Reviews of Google Earth Pro?

What Are G2 Users Discussing About Google Earth Pro?

Google Maps Platform

Google Maps Platform is a comprehensive suite of APIs and SDKs that enables developers to integrate dynamic, real-world mapping and location-based services into their applications. Leveraging Google's extensive geospatial data, it offers tools for creating interactive maps, providing accurate routing, and delivering detailed place information, thereby enhancing user engagement and functionality. Key Features and Functionality: - 3D Maps: Developers can create immersive, photorealistic 3D maps, offering users a more engaging and realistic navigation experience. - Aerial View: Provides pre-rendered, 3D cinematic videos of points of interest and their surroundings, enriching applications with dynamic visual content. - Dynamic Maps: Allows customization and real-time styling of interactive maps across all devices and platforms, ensuring a consistent and personalized user interface. - Dynamic Street View: Embeds 360° panoramic imagery, enabling users to explore locations virtually with real-world visuals. - Elevation Data: Offers access to elevation information for specific locations, useful for applications requiring topographical context. - Map Tiles: Enables the design of unique interfaces and interactions tailored to specific brand and design requirements, enhancing visual appeal and usability. - Maps Embed: Facilitates the addition of interactive maps or Street View panoramas to websites with simple HTTP requests, simplifying integration processes. - Photorealistic 3D Tiles: Provides access to a 3D mesh model of the real world, allowing the creation of cinematic experiences using preferred rendering tools. - Static Maps and Street View: Allows embedding of static map images or Street View panoramas into web pages without the need for JavaScript, streamlining content inclusion. - Street View Tiles: Utilizes street-level images and tile metadata to create immersive experiences, enhancing user interaction with real-world visuals. Primary Value and Solutions Provided: Google Maps Platform empowers developers to build applications that offer users accurate, real-time, and interactive mapping experiences. By integrating these tools, businesses can enhance user engagement, improve navigation and location-based services, and provide detailed geospatial insights. This platform is particularly beneficial for industries such as logistics, travel, real estate, and retail, where precise location information and mapping are crucial for operational efficiency and customer satisfaction.

Average Rating: 4.7/5.0

Total Reviews: 58

How Do G2 Users Rate Google Maps Platform?

  • Data Capture: 9.1/10 (Category avg: 8.6/10)
  • Data Visualization: 9.3/10 (Category avg: 8.6/10)
  • Ease of Use: 9.4/10 (Category avg: 8.4/10)
  • Spatial Analysis: 9.0/10 (Category avg: 8.4/10)

Who Is the Company Behind Google Maps Platform?

  • Seller: Google
  • Year Founded: 1998
  • HQ Location: Mountain View, CA
  • Twitter: @google
    31,899,995 Twitter followers
  • LinkedIn® Page: www.linkedin.com
    341,888 employees on LinkedIn®
  • Ownership: NASDAQ:GOOG

Who Uses This Product?

  • Top Industries: Information Technology and Services, Computer Software
  • Company Size: 55% Small, 32% Medium

What Do G2 Reviewers Say About Google Maps Platform?

AI-generated summary from verified user reviews

Pros
  • Users appreciate the ease of use of Google Maps Platform, seamlessly integrating with other apps for smooth navigation.
  • Users value the accuracy and reliability of Google Maps Platform, enhancing operational efficiency and user experience significantly.
  • Users love the navigation ease of Google Maps Platform, appreciating its accuracy and real-time traffic updates for seamless travel.
  • Users value the real-time location tracking of Google Maps, enhancing navigation and reducing travel time effectively.
  • Users appreciate the accuracy and reliability of Google Maps Platform, enhancing navigation and location-based experiences.
Cons
  • Users experience mapping issues with inaccurate details and confusing pricing, leading to frustrating navigation challenges.
  • Users often experience inaccurate geolocation issues, leading to wrong turns and misplaced addresses on Google Maps.
  • Users often face accuracy issues with Google Maps, including outdated Street View data and incorrect navigation routes.
  • Users express concerns over the high costs and complexity of the Google Maps Platform, especially at high usage volumes.
  • Users find the high cost of Google Maps Platform challenging, especially with heavy usage and complex feature implementation.

What Are Recent G2 Reviews of Google Maps Platform?

What Are G2 Users Discussing About Google Maps Platform?

Esri ArcGIS

ArcGIS is a comprehensive suite of mapping and location intelligence tools and capabilities. ArcGIS can be deployed on local machines (ArcGIS Pro), on your remote or on-premises servers (ArcGIS Enterprise), or as SaaS hosted by Esri (ArcGIS Online). ArcGIS includes focused apps to deliver complete solutions for your business or organization. Along with software, Esri provides a comprehensive collection of data and content to geo-enrich your own data. ArcGIS also provides rich software development tools for you to configure and create your own mapping and location intelligence products.

Average Rating: 4.5/5.0

Total Reviews: 516

How Do G2 Users Rate Esri ArcGIS?

  • Data Capture: 9.0/10 (Category avg: 8.6/10)
  • Data Visualization: 9.1/10 (Category avg: 8.6/10)
  • Ease of Use: 7.3/10 (Category avg: 8.4/10)
  • Spatial Analysis: 9.2/10 (Category avg: 8.4/10)

Who Is the Company Behind Esri ArcGIS?

  • Seller: Esri
  • Year Founded: 1969
  • HQ Location: Redlands, CA
  • Twitter: @Esri
    188,738 Twitter followers
  • LinkedIn® Page: www.linkedin.com
    7,311 employees on LinkedIn®

Who Uses This Product?

  • Who Uses This: GIS Analyst, GIS Specialist
  • Top Industries: Government Administration, Environmental Services
  • Company Size: 39% Medium, 32% Large

What Do G2 Reviewers Say About Esri ArcGIS?

AI-generated summary from verified user reviews

Pros
  • Users find Esri ArcGIS to be user-friendly, making it easy to navigate and effective for geospatial tasks.
  • Users value the high-quality 3D visualization of ArcGIS, enhancing accuracy and decision-making in various applications.
  • Users highlight the advanced data visualization capabilities of Esri ArcGIS Pro, enhancing clarity and usability in analysis.
  • Users find Esri ArcGIS highly user-friendly, appreciating its ease of learning and effective analytical tools.
  • Users value the user-friendly visualization tools in Esri ArcGIS Pro, enhancing clarity and ease of geospatial analysis.
Cons
  • Users struggle with stability and integration issues in ArcGIS, hindering workflow and data management efficiency.
  • Users find the high cost of Esri ArcGIS a barrier, especially for small businesses and learners.
  • Users face integration issues with ArcGIS, causing disruptions and complicating file management with third-party tools like OneDrive.
  • Users find the learning curve challenging, often needing extra training to effectively use Esri ArcGIS.
  • Users find it hard to learn and suggest that additional training opportunities could improve their experience with ArcGIS.

What Are Recent G2 Reviews of Esri ArcGIS?

What Are G2 Users Discussing About Esri ArcGIS?

AutoCAD

Redefine how you create with Autodesk® AutoCAD®. Autodesk AI empowers you to reimagine your creative process in AutoCAD, delivering advanced automation and meaningful performance enhancements that help you design faster and work smarter. Intelligent features reduce repetitive tasks and surface actionable insights, so you can spend more time creating with precision and confidence. Use natural, conversational interactions to ask questions, check standards unique to your team, and quickly validate designs against established workflows. Securely managed data supports informed decision making and helps turn ideas into high quality results more efficiently. A truly collaborative design experience brings teams together through Forma Data Management. Purpose built cloud storage makes it easy to save, manage, and access project files while supporting collaborative design processes. Multiple users can add markups to a single drawing on desktop or web with Multi-user Markup, improving transparency and reducing errors. Checkout transforms collaborative drafting by allowing contributors to work on specific geometry, submit edits for review, and merge changes smoothly by eliminating manual collation and file conflicts. Your data and intellectual property remain secure and governed, giving you confidence across every stage of design. Optimize productivity with seven specialized toolsets, including Electrical, Mechanical, and Plant 3D. Automate routine tasks with AutoLISP, tailor workflows to your discipline, and extend AutoCAD through APIs and thousands of apps on the Autodesk App Store.

Average Rating: 4.4/5.0

Total Reviews: 1,841

How Do G2 Users Rate AutoCAD?

  • Data Capture: 8.6/10 (Category avg: 8.6/10)
  • Data Visualization: 8.8/10 (Category avg: 8.6/10)
  • Ease of Use: 8.3/10 (Category avg: 8.4/10)
  • Spatial Analysis: 8.5/10 (Category avg: 8.4/10)

Who Is the Company Behind AutoCAD?

  • Seller: Autodesk
  • Company Website:
  • Year Founded: 1982
  • HQ Location: San Francisco
  • Twitter: @autodesk
    273,215 Twitter followers
  • LinkedIn® Page: www.linkedin.com
    15,352 employees on LinkedIn®

Who Uses This Product?

  • Who Uses This: Architect, Designer
  • Top Industries: Architecture & Planning, Civil Engineering
  • Company Size: 46% Small, 34% Medium

What Do G2 Reviewers Say About AutoCAD?

AI-generated summary from verified user reviews

Pros
  • Users find AutoCAD's ease of use essential for drafting and designing, enhancing both productivity and precision.
  • Users value the ease of drafting in AutoCAD, enabling efficient 2D and 3D designs for various projects.
  • Users value the precision and professional standards of AutoCAD, enhancing their drafting and design experiences significantly.
  • Users appreciate the precision and reliability of AutoCAD for both 2D drafting and basic 3D design projects.
  • Users value AutoCAD for its detailed engineering drawings, which enhance precision and professional standards in design work.
Cons
  • Users find the high subscription cost of AutoCAD burdensome, especially for students and small businesses.
  • Users highlight the steep learning curve of AutoCAD, making it challenging for beginners to learn quickly.
  • Users express frustration over the high cost of AutoCAD licenses, complicating access for individuals and small businesses.
  • Users find the difficult learning curve of AutoCAD overwhelming, especially due to numerous complex commands for beginners.
  • Users report that AutoCAD has high hardware requirements, causing slow performance and leading to lost work on complex projects.

What Are Recent G2 Reviews of AutoCAD?

What Are G2 Users Discussing About AutoCAD?

Maptitude

Maptitude is the best mapping software and GIS, on both desktop and online/SaaS/Cloud, to: • Optimize sales territories, vehicle routes, and site locations • Visualize, analyze, and present mission-critical data • Maximize profits, time, and resources Maptitude GIS and mapping software gives you the tools, maps, and data you need to analyze and understand how geography affects you and your organization. Maptitude is the most capable, and least expensive, full-featured mapping software available. With Maptitude you can create maps and map images from spreadsheets and you can see external data on the map from a variety of sources including Google Maps KML/KMZ files. Designed for data visualization and geographic analysis, Maptitude comes with a comprehensive library of maps and GIS data for your country. What Can You Do with Maptitude Mapping Software Features? • Optimize sales territories, districts, service areas, vehicle routes, and site locations • Map customer locations, visualize sales performance, and identify over- and under-served areas • Reveal hidden geographic patterns, trends, data density, and hotspots from spreadsheets and databases • Visualize and analyze population, income, and other demographic data • Plan efficient travel routes with advanced proximity, navigation, and travel time tools • Customize every aspect of your maps including symbols, themes, layers, annotations, and 3D graphics to tailor both appearance and functionality to your specific needs • Customize maps with flexible color schemes, layers, and annotations to highlight mission-critical data • Connect to corporate databases, add your own data, and answer geographic questions impacting operations • Find growth opportunities by spotting patterns you can't see in tables • Create, edit, and manage interactive maps with zoom, pan, filter, query, and layer toggle features for dynamic exploration and improved decision-making • Create, edit, and manage interactive, shareable maps for better decision-making

Average Rating: 4.7/5.0

Total Reviews: 149

How Do G2 Users Rate Maptitude?

  • Data Capture: 9.6/10 (Category avg: 8.6/10)
  • Data Visualization: 9.6/10 (Category avg: 8.6/10)
  • Ease of Use: 8.2/10 (Category avg: 8.4/10)
  • Spatial Analysis: 9.3/10 (Category avg: 8.4/10)

Who Is the Company Behind Maptitude?

  • Seller: Caliper
  • Company Website:
  • Year Founded: 1983
  • HQ Location: Newton, MA
  • Twitter: @Maptitude
    1,195 Twitter followers
  • LinkedIn® Page: www.linkedin.com
    41 employees on LinkedIn®

Who Uses This Product?

  • Who Uses This: President, Owner
  • Top Industries: Hospital & Health Care, Higher Education
  • Company Size: 54% Small, 26% Large

What Do G2 Reviewers Say About Maptitude?

AI-generated summary from verified user reviews

Pros
  • Users benefit from Maptitude's extensive feature set, including robust spatial analytics and demographic tools for diverse projects.
  • Users value the ease of use of Maptitude, appreciating its quick learning curve and straightforward analytical tools.
  • Users appreciate the clear data visualization in Maptitude, enabling informed decisions and compelling storytelling through mapping.
  • Users value the high data accuracy of Maptitude, enhancing their logistical and analytical project effectiveness.
  • Users value the powerful GIS analysis tools in Maptitude, greatly enhancing logistics and diverse project capabilities.
Cons
  • Users express frustration with limited accessibility for Maptitude, particularly regarding installation and sharing options.
  • Users find Maptitude expensive due to extra costs for sharing options and annual license requirements for updated data.
  • Users find the limited sharing options and lack of a "reassign" feature restricts their mapping experience in Maptitude.
  • Users find the learning curve challenging, especially for beginners, but online training helps ease the transition.
  • Users find the learning curve challenging, especially for newbies, but training resources can help improve understanding.

What Are Recent G2 Reviews of Maptitude?

What Are G2 Users Discussing About Maptitude?

DroneDeploy

DroneDeploy powers field teams with robotics and AI. As the only platform that combines robotic automation, AI agents and truly unified reality capture, DroneDeploy allows critical industries to operate with speed and confidence. From construction and energy to agriculture, the world’s largest companies use DroneDeploy to simplify field operations, improve safety and make smarter decisions, faster. By combining aerial drones, 360 and fixed cameras, ground robots and proprietary AI, we’re bringing the power of automation and visual intelligence to all stakeholders, from the field to the boardroom.

Average Rating: 4.6/5.0

Total Reviews: 110

How Do G2 Users Rate DroneDeploy?

  • Ease of Use: 8.8/10 (Category avg: 8.4/10)

Who Is the Company Behind DroneDeploy?

  • Seller: DroneDeploy
  • Year Founded: 2013
  • HQ Location: San Francisco, US
  • Twitter: @DroneDeploy
    34,433 Twitter followers
  • LinkedIn® Page: www.linkedin.com
    386 employees on LinkedIn®

Who Uses This Product?

  • Who Uses This: Project Engineer
  • Top Industries: Construction, Architecture & Planning
  • Company Size: 44% Small, 39% Medium

What Do G2 Reviewers Say About DroneDeploy?

AI-generated summary from verified user reviews

Pros
  • Users commend the ease of use of DroneDeploy for flight management and intuitive collaboration features.
  • Users value the user-friendly interface and exceptional customer service of DroneDeploy, enhancing their mapping experience.
  • Users value the responsive customer support from DroneDeploy, consistently receiving expert assistance for their inquiries and issues.
  • Users value the user-friendly interface of DroneDeploy, which simplifies flight planning and enhances project efficiency.
  • Users find DroneDeploy to have intuitive flight management and excellent collaboration features, enhancing their mapping experience.
Cons
  • Users find DroneDeploy expensive, with confusing pricing plans and concerns about affordability for continued use.
  • Users express frustration over missing features like efficient GCP handling and access to basic tools without an account.
  • Users express frustration over the slow processing times with DroneDeploy, impacting efficiency in project workflows.
  • Users experience upload issues with slow processing and limitations on flight planning during trials, complicating their projects.
  • Users find 3D integration issues frustrating, especially with mobile compatibility and limited export settings affecting functionality.

What Are Recent G2 Reviews of DroneDeploy?

What Are G2 Users Discussing About DroneDeploy?

Mapme

Mapme is an interactive map-building platform that empowers organizations to transform location-based information into engaging, visual experiences - without writing a single line of code. Designed for teams that want to communicate data, stories, places, and programs with clarity, Mapme offers a seamless way to build customizable maps, embed multimedia, visualize datasets, and publish digital experiences that inform, inspire, and drive action. With Mapme, users can create dynamic maps for tourism, real estate, government, education, community initiatives, events, foundations, and more. From showcasing local businesses and development projects to displaying property listings, university campuses, or cultural landmarks - every map is intuitive to build, beautiful to navigate, and accessible across devices. The platform supports photos, videos, custom branding, geo-layers, categories, filters, routing, 3D buildings, and advanced search capabilities, allowing audiences to explore locations in depth. Map editors can collaborate in real time, manage updates effortlessly, and integrate data from spreadsheets, CRMs, or GIS tools. Embedding maps on websites or sharing them as standalone experiences takes seconds, making Mapme a scalable solution for campaign rollouts, stakeholder communication, and public storytelling. Organizations choose Mapme for its balance of simplicity and power. What traditionally required GIS expertise or custom development can now be achieved visually - with the flexibility to grow from small single-map use cases to large multi-map environments. Whether you are mapping 50 local nonprofits or 50,000 global assets, Mapme ensures performance, clarity, and a premium user experience. Trusted by marketing teams, city planners, real estate groups, tourism boards, and digital experience leaders worldwide, Mapme turns static data into living information. It helps organizations increase engagement, improve transparency, strengthen community participation, and showcase impact at a glance. In a world where customers expect clarity, interactivity, and ease of use, Mapme offers a modern way to visualize location intelligence and bring stories to life - beautifully and at scale.

Average Rating: 4.6/5.0

Total Reviews: 39

How Do G2 Users Rate Mapme?

  • Data Capture: 8.7/10 (Category avg: 8.6/10)
  • Data Visualization: 9.5/10 (Category avg: 8.6/10)
  • Ease of Use: 9.3/10 (Category avg: 8.4/10)
  • Spatial Analysis: 8.3/10 (Category avg: 8.4/10)

Who Is the Company Behind Mapme?

  • Seller: Mapme
  • Year Founded: 2014
  • HQ Location: N/A
  • Twitter: @mapme
    57 Twitter followers
  • LinkedIn® Page: www.linkedin.com
    13 employees on LinkedIn®

Who Uses This Product?

  • Company Size: 63% Small, 30% Medium

What Do G2 Reviewers Say About Mapme?

AI-generated summary from verified user reviews

Pros
  • Users appreciate the ease of use of Mapme, benefiting from its intuitive interface and excellent support.
  • Users commend the excellent customer support from MapMe, highlighting the team's availability and responsiveness.
  • Users appreciate the variety of customization options in MapMe, enabling tailored maps that suit their organization's needs.
  • Users commend MapMe for its easy implementation, offering a smooth setup and seamless user experience.
  • Users appreciate the easy integration of Mapme, ensuring content fits seamlessly across various platforms with minimal effort.
Cons
  • Users find the learning curve challenging due to extensive customization options, despite an intuitive interface.
  • Users find the learning difficulty in editing the base map frustrating, particularly with outdated landmarks.
  • Users desire greater customization options for the "directions" tool to enhance their navigation experience.
  • Users note the offline issues with Mapme, but generally find data accessibility sufficient to mitigate concerns.
  • Users find the outdated information in Mapme's base map frustrating and challenging to update or edit.

What Are Recent G2 Reviews of Mapme?

What Are G2 Users Discussing About Mapme?

BatchGeo

BatchGeo is the easiest way to get your list of addresses on a map. Since 2006 BatchGeo has hosted millions of maps for Fortune 50 companies, non-profits, and individuals. The idea behind BatchGeo is most geographic data is stored in some sort of spreadsheet, list, or simple table (ex: Excel, CSV, Google Spreadsheets, etc.) So its optimized for those formats, making it super easy to drag in or copy/paste your tabular data into a map. Once your data is mapped the real fun begins. Your data points are spread out on an easy to navigate Google Map. Data can be color coded by groups or ranges, or even heat mapped. If routing is what you are interested in, BatchGeo can give you optimized routes for up to 23 points at a time. This ensures you don't waste time when visiting your customers. Finally, if you want to share your map it's easy to do. You can choose if your map is to be secured (password protected) or generally available to the public. BatchGeo can even be used for a store locator for your website.

Average Rating: 4.7/5.0

Total Reviews: 998

How Do G2 Users Rate BatchGeo?

  • Data Capture: 8.8/10 (Category avg: 8.6/10)
  • Data Visualization: 8.8/10 (Category avg: 8.6/10)
  • Ease of Use: 9.1/10 (Category avg: 8.4/10)
  • Spatial Analysis: 8.8/10 (Category avg: 8.4/10)

Who Is the Company Behind BatchGeo?

  • Seller: BatchGeo
  • HQ Location: VANCOUVER, Washington
  • Twitter: @batchgeo
    552 Twitter followers
  • LinkedIn® Page: www.linkedin.com
    1 employees on LinkedIn®

Who Uses This Product?

  • Who Uses This: Manager, Analyst
  • Top Industries: Real Estate, Marketing and Advertising
  • Company Size: 59% Small, 27% Medium

What Do G2 Reviewers Say About BatchGeo?

AI-generated summary from verified user reviews

Pros
  • Users love the ease of use of BatchGeo, effortlessly transforming data into interactive maps without technical skills.
  • Users love easy sharing of maps, seamlessly integrating and embedding visual insights across multiple platforms.
  • Users value the easy mapping feature of BatchGeo, enjoying fast, shareable, and colorful geographic insights from spreadsheets.
  • Users love the easy-to-use location services of BatchGeo, simplifying data visualization and enhancing geographic insights.
  • Users appreciate the variety of mapping tools in BatchGeo, facilitating effective location comparison and data presentation.
Cons
  • Users find feature limitations in BatchGeo, noting restrictions on customization, data records, and frequency of use.
  • Users find the High Cost of BatchGeo prohibitive for small businesses, limiting access to essential features.
  • Users find BatchGeo to have limited customization options, which may not satisfy advanced mapping needs.
  • Users find the manual input requirement cumbersome due to data re-uploading after each update, limiting efficiency.
  • Users find the update issues with BatchGeo cumbersome due to the need for re-uploading data frequently.

What Are Recent G2 Reviews of BatchGeo?

What Are G2 Users Discussing About BatchGeo?

ArcGIS Pro

ArcGIS Pro is Esri’s powerful, single desktop GIS application. Technologically ahead of everything else on the market, ArcGIS Pro supports data visualization, advanced analysis and authoritative data maintenance in both 2D and 3D. ArcGIS Pro is tightly coupled with the ArcGIS platform supporting data sharing across ArcGIS Online and ArcGIS Enterprise through Web GIS.

Average Rating: 4.3/5.0

Total Reviews: 173

How Do G2 Users Rate ArcGIS Pro?

  • Data Capture: 8.5/10 (Category avg: 8.6/10)
  • Data Visualization: 9.1/10 (Category avg: 8.6/10)
  • Ease of Use: 7.6/10 (Category avg: 8.4/10)
  • Spatial Analysis: 9.0/10 (Category avg: 8.4/10)

Who Is the Company Behind ArcGIS Pro?

  • Seller: Esri
  • Year Founded: 1969
  • HQ Location: Redlands, CA
  • Twitter: @Esri
    188,738 Twitter followers
  • LinkedIn® Page: www.linkedin.com
    7,311 employees on LinkedIn®

Who Uses This Product?

  • Who Uses This: GIS Analyst, GIS Specialist
  • Top Industries: Government Administration, Environmental Services
  • Company Size: 37% Medium, 36% Large

What Do G2 Reviewers Say About ArcGIS Pro?

AI-generated summary from verified user reviews

Pros
  • Users appreciate the user-friendly design of ArcGIS Pro, facilitating complex geospatial tasks with ease.
  • Users highlight the superior 3D visualization capabilities of ArcGIS Pro, enhancing their geospatial analysis experience.
  • Users value the user-friendly design of ArcGIS Pro, significantly enhancing their efficiency with its Ribbon Interface.
  • Users appreciate the powerful tools of ArcGIS Pro, enhancing their capacity for advanced mapping and analysis.
  • Users value the extensive tool variety in ArcGIS Pro, enhancing their geospatial analysis and visualization capabilities.
Cons
  • Users find the high cost of ArcGIS Pro licensing to be a significant drawback despite its robust capabilities.
  • Users experience connectivity issues due to heavy hardware requirements and reliance on cloud services.
  • Users struggle with the heavy hardware requirements of ArcGIS Pro, which makes it less accessible for some.
  • Users find the licensing costs expensive, especially with many essential features needing additional payments or credits.
  • Users find the steep learning curve of ArcGIS Pro challenging, particularly due to its complex interface for beginners.

What Are Recent G2 Reviews of ArcGIS Pro?

What Are G2 Users Discussing About ArcGIS Pro?

Octave Alto SDKs (Luciad)

Octave is a global technology leader focused on turning geospatial and operational data into actionable intelligence. With decades of experience in high‑performance visualization, spatial analytics, and mission‑critical system integration, Octave supports organizations worldwide in building, operating, and safeguarding complex real‑world systems. Its global footprint and long‑standing technical heritage enable modern, scalable solutions that evolve alongside today’s fast‑moving data and hardware ecosystems. The Octave Alto SDKs (formerly the Luciad Portfolio) provide a comprehensive suite of developer toolkits for building high‑performance geospatial applications across desktop, web, and embedded environments. Alto Server enables secure data management and on‑the‑fly fusion of large spatial datasets; Alto Lightspeed delivers advanced 2D/3D/4D visualization and analytics for complex, time‑dynamic environments; Alto Browser offers lightweight, high‑performance geospatial web visualization; and Alto Universal gives developers a cross‑platform graphics engine with native C++ and C# APIs for demanding visualization workloads. Together, they offer support for rich geospatial formats, real‑time data handling, styling, analytics, and precision rendering. The Octave Alto SDKs empower developers to turn massive, complex geospatial datasets into fast, interactive applications that support real‑time decision‑making. By providing optimized engines, open APIs, and ready‑to‑use geospatial capabilities, the SDKs drastically reduce development time, eliminate integration bottlenecks, and ensure reliable performance in mission‑critical environments. Whether used for defense command systems, mobility solutions, public safety operations, utilities, or digital twin platforms, the Alto SDKs give teams the speed, flexibility, and accuracy they need to build modern geospatial experiences with confidence.

Average Rating: 4.2/5.0

Total Reviews: 26

How Do G2 Users Rate Octave Alto SDKs (Luciad)?

  • Data Capture: 9.6/10 (Category avg: 8.6/10)
  • Data Visualization: 9.5/10 (Category avg: 8.6/10)
  • Ease of Use: 7.9/10 (Category avg: 8.4/10)
  • Spatial Analysis: 9.7/10 (Category avg: 8.4/10)

Who Is the Company Behind Octave Alto SDKs (Luciad)?

  • Seller: Octave
  • Company Website:
  • HQ Location: Madison, US
  • LinkedIn® Page: www.linkedin.com
    3,001 employees on LinkedIn®

Who Uses This Product?

  • Top Industries: Computer Software
  • Company Size: 34% Medium, 34% Large

What Do G2 Reviewers Say About Octave Alto SDKs (Luciad)?

AI-generated summary from verified user reviews

Pros
  • Users value the fast performance of Octave Alto SDKs, enabling real-time mapping and effective project deployment.
  • Users admire the high-performance rendering and effective visualization capabilities of Octave Alto SDKs for large datasets.
  • Users commend the high data accuracy of Octave Alto SDKs, enhancing their project deployment and visualization experiences.
  • Users value the high-performance mapping of Octave Alto SDKs, enabling real-time scenarios with minimal lag.
  • Users praise the high performance rendering of Octave Alto SDKs, especially for visualizing large datasets effectively.
Cons
  • Users find the high cost and licensing lack transparency, making it less beginner-friendly for simple projects.
  • Users find that for basic mapping needs, Luciad's feature limitations can make the setup unnecessarily complex and heavy.
  • Users find the lack of transparency and beginner-friendliness in pricing and licensing to be a major drawback.
  • Users find the licensing issues of Octave Alto SDKs problematic, citing transparency and beginner-friendliness as concerns.
  • Users find the mapping concerns of Octave Alto SDKs excessive for simple visualization tasks, impacting usability.

What Are Recent G2 Reviews of Octave Alto SDKs (Luciad)?

Badger Maps

Your field sales tool kit to sell more– Badger Maps is the top rated mobile app for B2B reps in the field and a total territory management for your entire field team. With Badger, outside sales & field service reps get a mobile app (available on both iPhone and Android) that cuts drive time, improves data collection, and increases sales. Activities that were once a time sink like customer mapping, route planning, scheduling, data collection, and reporting are all made easy with Badger’s mobile mapping app. Paired with a suite of territory management tools that includes performance dashboards and a robust territory mapping interface, Badger Maps will enhance the workflows of everyone on your field team with features like: Route Planner & Mobile Sales Mapping - Fit 2 more meetings into each day by optimizing routes with up to 120 stops. - Visualize all your Accounts, Contacts, Leads, and Opportunities on an interactive map on your phone. - Filter and colorize accounts by custom metrics like priority status or last order date to instantly spot your best opportunities as you plan your day. - Plan and save all your routes in advance so you never fly blind on the road. Scheduling & Reminders - Sync routes to your calendar with the touch of the button. - Get alerts for follow-ups or nearby accounts that need attention. Mobile Lead Generation - Find new, qualified leads near your route– great for downtime on the road! Data Collection & A Mobile CRM Front-End - Take notes, capture photos, and keep all your customer information up to date from your phone. - Automatically sync all your data with the leading CRMs including Salesforce, HubSpot, Zoho, Microsoft Dynamics, NetSuite, Pipedrive, monday.com, Veeva, Insightly, SugarCRM, and more. - Map and access all your CRM data in the field. See the relationship between different data types so you’re never left fumbling for the information you need to serve your customers. Reporting & Mileage Tracking - Get automated reports summarizing your routes and customer activity. - Generate mileage tracking reports that make submitting your expenses easy. Territory Mapping & Management - See all your reps’ data represented in performance dashboards and customizable charts & graphs. - Use territory alignment software to automatically balance and optimize your territories. - Automate lead routing to assign new leads to the right territory instantly- no manual work needed! - Create competitions and incentivize your reps with dynamic leaderboards. - Uncover insights with territory mapping tools like heat maps, bubble maps, thematic maps & more. Get a free 14-day trial, integrated with your CRM. With optimized routes, Badger pays for itself with just the savings on gas!

Average Rating: 4.7/5.0

Total Reviews: 334

How Do G2 Users Rate Badger Maps?

  • Data Capture: 10.0/10 (Category avg: 8.6/10)
  • Data Visualization: 8.9/10 (Category avg: 8.6/10)
  • Ease of Use: 9.2/10 (Category avg: 8.4/10)
  • Spatial Analysis: 8.3/10 (Category avg: 8.4/10)

Who Is the Company Behind Badger Maps?

  • Seller: Badger Maps, Inc
  • Company Website:
  • Year Founded: 2012
  • HQ Location: San Francisco, California
  • Twitter: @BadgerMaps
    2,095 Twitter followers
  • LinkedIn® Page: www.linkedin.com
    75 employees on LinkedIn®

Who Uses This Product?

  • Who Uses This: Territory Manager, Owner
  • Top Industries: Medical Devices, Wholesale
  • Company Size: 63% Small, 24% Medium

What Do G2 Reviewers Say About Badger Maps?

AI-generated summary from verified user reviews

Pros
  • Users love the ease of use of Badger Maps, appreciating its smooth setup and intuitive features for efficiency.
  • Users appreciate the visual mapping feature of Badger Maps, enhancing organization and productivity in planning daily routes.
  • Users value the route optimization feature of Badger Maps, enhancing efficiency and streamlining their daily tasks.
  • Users value the route planning features of Badger Maps, enhancing efficiency and ease in managing client visits.
  • Users appreciate the responsive and helpful customer support from Badger Maps, enhancing their overall mapping experience.
Cons
  • Users experience routing issues with Badger Maps, leading to backtracking and inefficiencies in navigation.
  • Users experience issues with navigation accuracy and limited search capabilities in Badger Maps, affecting their efficiency.
  • Users find the pricing to be high compared to its features, especially for limited usage scenarios.
  • Users suggest that improvement in sync and functionality between mobile and online versions is needed for better efficiency.
  • Users feel the route optimizer overlooks appointment times, leading to inefficiencies and limits on account management features.

What Are Recent G2 Reviews of Badger Maps?

What Are G2 Users Discussing About Badger Maps?

Octave Imagine

Octave Imagine is an all‑in‑one geospatial software platform designed to help users understand and work with complex imagery, maps, and 3D data without needing multiple separate tools. While many competing products require users to jump between different applications for image processing, analysis, visualization, and modeling, Octave Imagine brings all these capabilities together in a single, integrated environment. This gives it a clear advantage in the marketplace, as its competitors typically only cover part of the workflow. What makes Octave Imagine stand out is its wide range of capabilities—from image classification and change detection to 3D modeling and advanced spatial analysis. Its automation features help users save significant time by reducing repetitive manual tasks, and its seamless integration with other Octave products creates a connected, efficient workflow that few alternatives can match. Users also benefit from an active community and strong support team, making it easier to learn, troubleshoot, and grow their expertise. By consolidating essential tools into one platform, Octave Imagine removes complexity and makes it easier to handle large datasets without sacrificing performance. Its precise processing tools ensure reliable results, helping users make better, faster decisions—especially for time‑sensitive projects. Automated workflows streamline everyday tasks, boosting productivity and reducing bottlenecks. The platform scales naturally as projects become more complex, serving analysts, scientists, engineers, planners, and many other professionals across industries. Ultimately, Octave Imagine helps organizations turn raw geospatial data into meaningful insight. It improves the quality of their work, speeds up their processes, and provides a clearer understanding of real‑world situations. With its unique combination of capability, automation, accuracy, and interoperability, Octave Imagine establishes itself as a leader in the geospatial market and a tool that genuinely transforms how users work.

Average Rating: 4.2/5.0

Total Reviews: 43

How Do G2 Users Rate Octave Imagine?

  • Data Capture: 9.2/10 (Category avg: 8.6/10)
  • Data Visualization: 9.0/10 (Category avg: 8.6/10)
  • Ease of Use: 7.4/10 (Category avg: 8.4/10)
  • Spatial Analysis: 9.7/10 (Category avg: 8.4/10)

Who Is the Company Behind Octave Imagine?

  • Seller: Octave
  • Company Website:
  • HQ Location: Madison, US
  • LinkedIn® Page: www.linkedin.com
    3,001 employees on LinkedIn®

Who Uses This Product?

  • Top Industries: Research, Environmental Services
  • Company Size: 57% Small, 24% Medium

What Do G2 Reviewers Say About Octave Imagine?

AI-generated summary from verified user reviews

Pros
  • Users praise the ease of use of Octave Imagine, highlighting its intuitive interface and smooth experience.
  • Users value the advanced remote sensing functionality of Octave Imagine, essential for serious raster processing and analysis.
  • Users value the powerful tools of Octave Imagine, enhancing productivity and precision in remote sensing tasks.
Cons
  • Users experience accuracy issues with Octave Imagine, impacting reliability and efficiency in their tasks.
  • Users find the lack of developer mode integration limiting, despite the tools being effective and powerful.
  • Users struggle with a steep learning curve, finding the interface complex and overwhelming for beginners.

What Are Recent G2 Reviews of Octave Imagine?

What Are G2 Users Discussing About Octave Imagine?

Fulcrum

Fulcrum is a field-first SaaS platform designed to transform how organizations manage field operations management for mission-critical operations. Built specifically for the challenges of field teams, Fulcrum automates workflows, captures real-time location data, and integrates seamlessly with GIS and other systems to ensure a continuous, accurate flow of information before, during, and after inspections. With Fulcrum, organizations centralize their field operations on a single platform, standardizing field data collection and driving productivity gains. From utilities to construction, Fulcrum supports diverse industries by offering customizable workflows that adapt to evolving field conditions. Non-technical users can quickly build field apps, while enterprise clients enjoy advanced scalability to manage even the most complex processes. Fulcrum’s AI-powered tools extend the platform beyond standard field operations management. Audio FastFill automatically populates forms using information captured from voice input, photos, and text, reducing manual entry in the field. Insights transforms field data into instant charts, graphs, and maps by answering plain-language questions in seconds. Teams can also deploy custom AI models to support specialized workflows such as anomaly detection or vegetation management. Next, Fulcrum will introduce AI-driven photo recognition, followed by intelligent, in-the-moment guidance designed to assist field crews as they work. Thousands of organizations worldwide rely on Fulcrum to improve data accuracy, reduce operational inefficiencies, and drive digital transformation. By eliminating time-consuming manual processes, Fulcrum helps field teams work faster, smarter, and with greater confidence. Whether capturing inspection results, monitoring assets, or ensuring compliance, Fulcrum delivers the clarity and control needed to make better decisions in real time.

Average Rating: 4.6/5.0

Total Reviews: 245

How Do G2 Users Rate Fulcrum?

  • Data Capture: 8.9/10 (Category avg: 8.6/10)
  • Data Visualization: 8.0/10 (Category avg: 8.6/10)
  • Ease of Use: 9.1/10 (Category avg: 8.4/10)
  • Spatial Analysis: 10.0/10 (Category avg: 8.4/10)

Who Is the Company Behind Fulcrum?

  • Seller: Fulcrum
  • Company Website:
  • Year Founded: 2011
  • HQ Location: San Francisco, California, United States
  • Twitter: @fulcrumapp
    2,743 Twitter followers
  • LinkedIn® Page: www.linkedin.com
    160 employees on LinkedIn®

Who Uses This Product?

  • Who Uses This: Project Manager
  • Top Industries: Environmental Services, Utilities
  • Company Size: 52% Small, 29% Medium

What Do G2 Reviewers Say About Fulcrum?

AI-generated summary from verified user reviews

Pros
  • Users find Fulcrum to be easy to use, allowing for quick and efficient completion of tasks.
  • Users appreciate the user-friendly design of Fulcrum, which simplifies app creation and enhances field operations.
  • Users appreciate the easy setup of Fulcrum, making their data collection and workflow management seamless and efficient.
  • Users praise Fulcrum's excellent customer support and technical assistance, enhancing their experience and productivity.
  • Users love the endless customization options of Fulcrum, enabling tailored apps that fit their unique business needs.
Cons
  • Users face editing issues after syncing data in Fulcrum, limiting their ability to make necessary corrections.
  • Users find the limited features of Fulcrum hinder their ability to create complex forms and reports efficiently.
  • Users find the user interface challenging and struggle with complex report customization despite a no-code promise.
  • Users find limited functionality in Fulcrum, struggling to create complex forms with tailored data aggregation.
  • Users find the form complexity in Fulcrum challenging, especially when customizing reports without coding knowledge.

What Are Recent G2 Reviews of Fulcrum?

What Are G2 Users Discussing About Fulcrum?

QGIS

QGIS is a free and open-source Geographic Information System (GIS) that enables users to visualize, edit, analyze, and publish geospatial information across various platforms, including Windows, macOS, and Linux. Designed to be accessible to both beginners and professionals, QGIS offers a comprehensive suite of tools for creating, managing, and sharing spatial data. Key Features and Functionality: - Map Creation and Design: QGIS provides an extensive set of cartographic design options, allowing users to craft detailed and aesthetically pleasing maps suitable for desktop, mobile, cloud, and print media. - Layer Editing: Users can create and edit points, lines, polygons, and meshes with precision, utilizing advanced construction tools that support curves, CAD-like functionalities, and a wide range of geometry transformations. - Data Processing and Analysis: The software includes a comprehensive array of analysis tools, enabling users to uncover insights from their data. It supports automated analysis workflows through visual combinations of tools, facilitating reproducible processes. - Data Sharing and Interoperability: QGIS supports various data sources and formats, ensuring seamless data integration. It adheres to industry standards, allowing users to explore, utilize, and create web services, and extends its capabilities to cloud and mobile platforms for broader accessibility. Primary Value and User Solutions: QGIS empowers users by providing robust spatial visualization and decision-making tools without the constraints of proprietary software. Its open-source nature ensures continuous development and community-driven enhancements, making it a cost-effective solution for organizations and individuals requiring advanced GIS capabilities. By supporting a wide range of data formats and offering extensive customization through plugins, QGIS addresses the diverse needs of its users, facilitating efficient data management, analysis, and dissemination.

Average Rating: 4.5/5.0

Total Reviews: 147

How Do G2 Users Rate QGIS?

  • Data Capture: 9.1/10 (Category avg: 8.6/10)
  • Data Visualization: 8.8/10 (Category avg: 8.6/10)
  • Ease of Use: 8.1/10 (Category avg: 8.4/10)
  • Spatial Analysis: 8.9/10 (Category avg: 8.4/10)

Who Is the Company Behind QGIS?

  • Seller: QGIS
  • Year Founded: 2016
  • HQ Location: Linkoping, Ostergotland
  • Twitter: @qgis
    63,324 Twitter followers
  • LinkedIn® Page: www.linkedin.com
    7 employees on LinkedIn®

Who Uses This Product?

  • Top Industries: Civil Engineering, Information Technology and Services
  • Company Size: 45% Small, 28% Large

What Do G2 Reviewers Say About QGIS?

AI-generated summary from verified user reviews

Pros
  • Users value the customization options in QGIS, allowing tailored solutions for various skill levels and needs.
  • Users value the user-friendly interface of QGIS, appreciating its accessibility and ease of use for all skill levels.
  • Users praise the excellent service of QGIS, enjoying a supportive community and accessible resources for all skill levels.
  • Users commend the powerful geospatial capabilities of QGIS, enjoying its flexibility and extensive plugin support.
  • Users value the free access of QGIS, enabling diverse users to utilize advanced GIS tools without cost.
Cons
  • Users report stability issues with QGIS, especially when handling large datasets, affecting performance and reliability.
  • Users find feature limitations in QGIS, particularly in usability and support for advanced operations, impacting overall experience.
  • Users often face a steeper learning curve with QGIS, particularly in mastering advanced features and tools.
  • Users often experience slow loading times in QGIS, especially with large datasets or high-resolution layers.
  • Users report accuracy issues in QGIS due to occasional bugs and inconsistencies in plugin quality affecting results.

What Are Recent G2 Reviews of QGIS?

What Are G2 Users Discussing About QGIS?

Mergin Maps

Mergin Maps is a field data collection tool built on the free and open-source QGIS which allows you to collect, store and synchronise your data with your team. It removes the pain of writing down paper notes, georeferencing photos and transcribing GPS coordinates. With Mergin Maps, you can get your QGIS projects into the mobile app, collect data and synchronise it back on the server. Setting up your project with Mergin Maps only takes a few minutes. First, create your survey project in QGIS, then connect it to Mergin Maps with a plugin and synchronise it with the mobile app to start collecting in the field. The data you capture in the field survey is shown on a map and can be exported to a wide variety of formats including CSV, Microsoft Excel, ESRI Shapefile, Mapinfo, GeoPackage, PostGIS, AutoCAD DXF, and KML. Mergin Maps allows you to do live position tracking, fill out survey forms and capture and edit points, lines or polygons. You can also connect external GPS/GNSS devices via Bluetooth for high-precision surveying. Map layers look the same as in QGIS desktop so you can set your layer symbology how you want it on the desktop and it will appear that way on your mobile device. Mergin Maps supports offline field data capture for situations where a data connection is unavailable. It can be configured to use either offline or web-based background maps and contextual layers. Perks of the Mergin Maps sync system: - No need for cables to get your data on/off your device - Share projects with others for collaborative working, even offline - Updates from different surveyors are intelligently merged - Push data back from the field in real time - Version history and cloud-based backup - Fine-grained access control - Record metadata such as EXIF, GPS and external GNSS device information - Sync with your PostGIS datasets and external media storage such as S3 and MinIO Supported field types for forms are: - Text (single or multi-line) - Numeric (plain, with +/- buttons or with slider) - Date / time (with calendar picker) - Photo - Checkbox (yes/no values) - Drop-down with predefined values - Drop-down with values from another table

Average Rating: 4.7/5.0

Total Reviews: 34

How Do G2 Users Rate Mergin Maps?

  • Data Capture: 9.2/10 (Category avg: 8.6/10)
  • Data Visualization: 7.6/10 (Category avg: 8.6/10)
  • Ease of Use: 8.8/10 (Category avg: 8.4/10)
  • Spatial Analysis: 7.7/10 (Category avg: 8.4/10)

Who Is the Company Behind Mergin Maps?

Who Uses This Product?

  • Top Industries: Environmental Services
  • Company Size: 71% Small, 29% Medium

What Do G2 Reviewers Say About Mergin Maps?

AI-generated summary from verified user reviews

Pros
  • Users find Mergin Maps exceptionally easy to use, with seamless integration and smooth setup enhancing their experience.
  • Users find Mergin Maps to be incredibly user-friendly, making GIS accessible for both students and community projects.
  • Users value the easy integration with QGIS, enhancing data collection and user experience in community projects.
  • Users highlight the ease of use and integration of Mergin Maps, enhancing their mapping experiences in educational projects.
  • Users commend the responsive and helpful customer support from Mergin Maps, enhancing their overall experience.
Cons
  • Users note integration issues due to Mergin Maps' popularity, necessitating additional training and compatibility improvements.
  • Users find the learning curve steep due to limited familiarity and complex DB sync setup, necessitating extra training.
  • Users find the DB sync setup overly complex, requiring an API for easier cloud data access and automation.
  • Users experience data loss concerns, compounded by slow support response times in urgent situations.
  • Users face storage limitations on the free plan, which can hinder the use of larger datasets in Mergin Maps.

What Are Recent G2 Reviews of Mergin Maps?

Daniel Rivera
DR
Researched and written by Daniel Rivera
Updated March 4, 2025

Learn More About GIS Software

What is GIS Software?

Geographic information systems, better known as GIS software, are tools that capture, analyze, and display geospatial data to make 2D or 3D maps. These tools act as asset management platforms for the geographic data they capture, meaning GIS technology has the ability to understand patterns and improve operations in land-based operations. 

A GIS is a technology rooted in geographic information science that allows users to dig into geospatial data. The first step in this mapping technology is capturing data. These data types include cartographic, photographic, and digital data to provide a complete picture. GIS programs require both hardware and software, such as the desktop needed to display information.

Cartographic data is already in map form and includes information such as the location of rivers, roads, valleys, hills, and more. Data from photographic interpretation analyzes aerial shots of a site. Digital data is collected from satellites that show land use.

All varieties of data can be inputted into GIS mapping tools through data capture. As long as it has been digitized, it can be inputted into a GIS program. Once that data has been inputted, GIS technology can transform it into a map.

Who Uses GIS software?

GIS tools power location-based services. This technology is prevalent in a number of other professions:

GIS SpecialistA GIS specialist is an expert in geographic information systems. They analyze the spatial data stored in the geodatabases within these tools to solve problems related to a specific site or area. For example, a GIS specialist can assess the geospatial data of a region to determine the best escape route and then have the responsibility of mapping out an estimate time needed during a natural disaster. These specialists can create maps of certain areas using GIS technology and use that information to perform duties such as locating special features within a landscape.

A GIS specialist can be a full-time career, as a person in this role can act as a consultant to organizations who can benefit from the data extracted from GIS software. While the majority of this work can be conducted remotely from a computer, GIS specialists are sometimes required to visit a site in order to compare the landscape to the data in the GIS system. Those seeking this career path can obtain a GIS certificate from an accredited program; many universities offer GIS degrees as well.

Urban PlannerAn urban planner develops procedures and programs for the use of land. The outcomes are typically mapping out plans to build communities, accommodate growth, revamp local physical facilities, and more. For example, an urban planner might approve plans for a new school to ensure it meets the needs of a growing population. As a community grows and changes, urban planners are there to help manage economic, social, and environmental changes that may arise. Urban planners can be utilized for communities of any size—small towns, large cities, and entire counties.

A great deal of data is needed for an urban planner to make an informed decision. They must stay up-to-date on zoning codes, environment regulations, and legal issues. Urban planners must also stay attuned to the landscape in their area and can utilize GIS technology to analyze and manipulate data. GIS software can be used to overlay a land map with population density indicators, which could show the best use for a piece of land. While an urban planner likely needs to perform site visits, they may also utilize a desktop GIS to analyze this data from their own office.

Environmental ScientistAn environmental scientist assesses the health and stability of a given landscape. This includes a great deal of fieldwork tests and surveys to gather geospatial data, like soil, water, and air samples. The data collected is then analyzed for negative indicators, such as pollution. An environmental scientist’s findings can be collected into an official report that may be presented to policymakers or other organizations concerned about environmental issues.

Environmental scientists rely heavily on GIS applications to succeed in their work. These tools capture the geographic information necessary to effectively map out the health of a physical area. This mapping technology has the ability to capture data from all aspects of a landscape—aerial, water, land—and then display as a variety of different maps. These solutions can also map changes in a specific area, which is hugely beneficial to an environmental scientist as it can fuel a course of action or anticipate future land conditions.

Public Health ProfessionalsPublic health professionals are dedicated to protecting and improving the health of communities. Those in this field are focused more on preventing disease and injury rather than treating it. Public health intersects with a number of more specific fields to improve the health of the community. Epidemiology tracks the distribution and severity of diseases, along with how to prevent them from spreading. Biostatistics applies statistical and mathematical methods to the analysis of public health issues.

Environmental health is concerned with the quality of food supply, water and air pollution, and disease prevention. This is where GIS tools come into play. The use of a GIS and the spatial data it captures can help public health professionals come to decisions as well as predict outcomes. For example, public health officials can use GIS technology to map out potential risk from a contaminated water source. A desktop GIS program can also display information such as drug usage in a certain area.

Law EnforcementLaw enforcement officers can track crime trends within GIS software using crime mapping, which maps, visualizes, and analyzes crime incident patterns within their jurisdictions. These crime hot spots can be identified through the usage of GIS programs. Crime analysts can use a desktop GIS to overlay data sets such as census demographics. With this information, police officers are able to identify physical locations and potentially understand the underlying cause of crime in a certain area. GIS mapping software can also be useful for allocating police officers during emergency situations.

Why Use GIS software?

GIS software is vital for creating maps, but that is not the only application for this technology. These tools capture data that can be utilized by small, mid-sized or enterprise businesses in many fields.

A GIS helps users make more informed decisions. When working with a physical location, you need to understand every aspect of it—air, land, water, surrounding area, and more. A GIS captures this array of data, detailing various aspects of a landscape, and stores it all within one platform. Visualizing this data aids in identifying areas of opportunity and potential issues, such as the best route for an evacuation during an impending hurricane.

The geospatial data stored within these platforms even helps provide answers about things other than the physical landscape itself. Demographics of the surrounding population, social, real-world business problems, and political information can be gathered using a GIS. Features such as overlaying and data visualization connect the dots and create relationships between seemingly unconnected qualities, such populations with geographic features. For example, if a business needs to open up a new storefront, GIS software can be used to find a site of land near a highly populated area. Data can then be manipulated to account for inevitable population change in the surrounding area.

GIS software is specifically designed to visualize data. Reading and understanding statistics and data can be incredibly challenging. Data visualization is a key component of GIS technology, which means that the inputted data will be presented in a clear and comprehensive manner. Using a GIS solution, you can layer your datasets into one image and find the connections between each dataset. Bringing this data to life also allows you to view it from a different perspective, which can provide a fresh insight on a potential problem needing to be solved. You can create multiple maps within GIS platforms, which enables you to track and visualize the change in a certain area over time.

GIS technology can assist in conserving natural resources. GIS software has the ability to manage and maintain agricultural, water, and forest resources. These tools easily manage data on forest conditions as well. The geographic distribution of water resources can be analyzed through GIS technology. These two resources are also connected—as tree cover tends to decrease stormwater runoff.

GIS software allows for better geographic information record keeping. Many organizations are required to maintain thorough geographic records, such government and environmental science agencies. GIS systems are at the foundation of creating policies such as zoning laws, population censuses, and land ownership. Record keeping is vital when creating and upholding these laws, and GIS technology can store the geographic information necessary.

GIS technology can also track the spread of infectious diseases. On top of mapping trends in geographic features, GIS technology is used to follow trends that relate to the spread of disease. Users can leverage desktop GIS solutions to compare geography with other relevant variables and predict where an infectious disease might spread next. This data enables on-the-ground personnel to quickly work to save lives of local residents.

GIS software helps automate previously tedious geographic tasks. Before this technology, gathering data needed for any land, environment, map, pipeline, or city planning could be incredibly time consuming, due to the fact that one platform was unable to capture and store data from various sources. In addition, each data sample was collected and stored individually. However, GIS programs act as a repository for this data and convert it into the correct format, if necessary. GIS technology then takes this one step further and allows users to also design, update, and edit in the same platform where their geographic data is stored. These solutions also provide analysis tools, which gives organizations more time to focus on other urgent and critical tasks.

Governments can use GIS software to plan more cost-effective communities. Governments rely on thorough planning when it comes to building and expanding their communities. However, government organizations, especially smaller municipal ones, can face difficulty when it comes to the economy. Expanding a community while sources are diminishing gets expensive. GIS technology provides a way for government organizations to expand their communities in the most cost-efficient ways possible, as the data provided by GIS software allows them to make more informed choices about decisions such as land usage and locations of physical facilities. Governments can utilize a free GIS solution to continue to drive costs down.

Districts can create more efficient schools with GIS technology. A common issue within communities is needing to redistrict school boundaries as the local population ebbs and flows. GIS programs capture and store addresses for all students at the school. Using feature-based proximity tools, you can manipulate the borders of these zones and a GIS relates the student counts by grade of this proposed boundary. Even after school district zones have been nailed down, these programs can continue to benefit schools. School administrators use GIS technology to analyze the distance students walk to school. If a student lives a certain distance away, GIS tools continue to analyze the data to determine which students are eligible to take school buses. As schools may not a lot of budget dedicated to non-essential technology, they can utilize a free GIS platform for these tasks.

Planning for for natural disasters can be done using GIS technology. One of the main uses of this software is protecting the environment. The flip side of that is protecting citizens from potential dangers of their local environment. GIS tools help with risk management by assessing which areas are at risk for natural or man-made disasters. Communities can then take this data and develop preventive measures. And when natural disasters are unavoidable, GIS technology can still help. These tools aid in the planning of emergency evacuation routes and help estimate the damage from floods. In addition, GIS helps local governments document the needs for federal disaster relief funds.
GIS Software Features

While specific features may vary across different GIS solutions, the following features are typically found in geographic information systems:

Data Capture – This is simply the act of inputting data into a GIS. Relevant data can be grabbed from a number of sources. The software should be able to convert your data to a raster or vector file that will be compatible with your tool.

Remote Sensing Integration – Remote sensing is making measurements of a specific location on the earth through airplanes or satellites. These sensors have the ability to collect data in the form of images. As part of its data capture functionality, remote sensed imagery should easily integrate with a GIS.

Data Warehouse – GIS software stores the data on geographical features and their characteristics. It uses that data to publish maps. Just as GIS solutions capture data in multiple formats, said data is stored in multiple formats as well. Map city data can be stored as points, road data formatted as lines, boundaries as areas, and so on. Storing this information is what allows a GIS to identify features located in a map.

Buffer Zone Querying – Buffer zone querying is the ability to select a point on a map and display any given data within a certain radius. These buffers are used to show an area of influence around a location. For example, a buffer can be used to section off a radius around a school to plan for the transportation of students who live farther away. Some GIS tools may refer to buffer zone querying by other names, such as feature-based proximity tools.

Editing Data – The features of the landscapes you study change, which means your data will change as well. A GIS will enable you to keep up with these changes by allowing you to edit your data. Specific revision features and processes will vary in each tool, but they should all offer the ability to edit your data.

Data Visualization – The data visualization component of a GIS is what brings your data to life, in either a 2D or 3D format. A GIS displays the data you input as an easy-to-read map right on your desktop. This function may allow for additional features, such as adding pop-ups, charts, and infographics to maps.

Geocoding – This feature assigns locations to the addresses you need to keep track of so they may be placed as points on a map. It can be thought of as a interactive digital version of putting a pin on a location on a physical map. Some tools may refer to this feature as address-matching.

Spatial Analysis – Spatial analysis is at the core of publishing a map, and may be one of the key features of a GIS. This ability allows users to dig into their data and make informed decisions, predict patterns, and more. 

Overlaying – Overlaying makes it possible to visualize many different forms of data in one image. This function superimposes multiple datasets into one image to identify the relationships between them. Most GIS software provides overlaying capabilities for both vector and raster data.

Publishing Maps – Creating maps is the end goal of GIS software. All of these features, such as overlaying and data editing, contribute to the creation of a map. Once your data is set, you can simply print the map out on a corresponding printer. Some GIS tools may run one final analysis of your data before printing the final map.

Potential Issues with GIS Software

With its wide range of capabilities and applications, GIS technology offers a plethora of benefits. But that does not mean this software does not come without its challenges.

While the data captured and stored in GIS platforms is incredibly beneficial to users, integrating with traditional maps is extremely complex. It can prove difficult to integrate a traditional map with GIS technology. It may not be possible to grab meaningful geospatial information from a GIS, as many only store and analyze the data collected from the platform itself. Reach out to the GIS vendor you select to determine if this integration is possible.

GIS software is expensive. These tools are hugely beneficial to users, as it collects a massive amount of data from various points. It can cost a lot to gather, input, and connect all of this data. Corresponding hardware, along with potentially needing to hire an expert in GIS, continues to drive those expenses up. While they may have some limited features, budget-conscious users can leverage a free GIS for their business.

Data management can be difficult. It’s great that GIS technology allows users to capture and store large amounts of data, but someone has to comb through all that information. Because there is so much data, this could lead to data generalization, which means you may be at risk for losing information. Large amounts of data also require massive storage space, which increases the cost and manpower required to run your GIS.