Best Enterprise Monitoring Software - Page 3

How Many Enterprise Monitoring Software Products Does G2 Track?

Total Products under this Category: 91

Category Stats (Sep 2026)

  • Average Rating: 4.49/5 The average rating of products in this category, based on all submitted ratings
  • Top Trending Product: Honeycomb (+0.33%) - Among all products in this category, Honeycomb recorded the largest rating increase compared to last month

Last updated: September 29, 2026

How Does G2 Rank Enterprise Monitoring Software Products?

Why You Can Trust G2's Software Rankings:

  • 30 Analysts and Data Experts
  • 8,800+ Authentic Reviews
  • 91+ Products
  • Unbiased Rankings

G2's software rankings are built on verified user reviews, rigorous moderation, and a consistent research methodology maintained by a team of analysts and data experts. Each product is measured using the same transparent criteria, with no paid placement or vendor influence. While reviews reflect real user experiences, which can be subjective, they offer valuable insight into how software performs in the hands of professionals. Together, these inputs power the G2 Score, a standardized way to compare tools within every category.

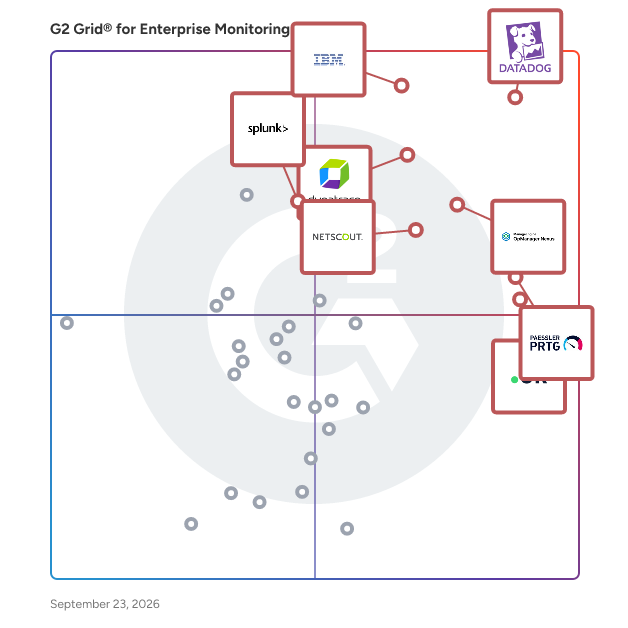
G2 Grid® for Enterprise Monitoring Software

G2 Grid® for Enterprise Monitoring Software plotting products by satisfaction and market presence

Highlighted products: Datadog, IBM Instana, Dynatrace, OpManager Nexus, Paessler PRTG, UptimeRobot, NETSCOUT Network & Application Observability, and Splunk Enterprise.

Underlying data: [Grid® JSON](https://www.g2.com/categories/enterprise-monitoring/grids.json?focus%5B%5D=datadog&focus%5B%5D=ibm-instana&focus%5B%5D=dynatrace&focus%5B%5D=opmanager-nexus&focus%5B%5D=paessler-prtg&focus%5B%5D=uptimerobot&focus%5B%5D=netscout-network-application-observability&focus%5B%5D=splunk-enterprise)

Atatus

Atatus is an AI-SRE driven observability platform built to help teams monitor, understand, and improve the performance, reliability, and security of modern systems. It brings together application performance, APIs, infrastructure, databases, network activity, logs, and user experience into a single, unified platform, enabling teams to gain real-time visibility and context across their entire stack. Trusted by teams across industries, Atatus enables engineering, DevOps, SRE, and security teams to detect anomalies early, investigate issues with correlated insights, and resolve incidents faster. By combining full-stack observability with API intelligence, database and network monitoring, security log analysis, and AI-driven signal correlation, Atatus helps reduce mean time to resolution (MTTR), improve system reliability, strengthen security posture, and deliver better user experiences while maintaining visibility into critical business operations.

Average Rating: 4.7/5.0

Total Reviews: 95

How Do G2 Users Rate Atatus?

  • Has the product been a good partner in doing business?: 9.4/10 (Category avg: 8.8/10)

Who Is the Company Behind Atatus?

  • Seller: Atatus
  • Year Founded: 2014
  • HQ Location: Chennai, TamilNadu
  • Twitter: @atatusapp
    93 Twitter followers
  • LinkedIn® Page: www.linkedin.com
    64 employees on LinkedIn®

Who Uses This Product?

  • Who Uses This: CEO, CTO
  • Top Industries: Computer Software, Information Technology and Services
  • Company Size: 72% Small, 23% Medium

What Do G2 Reviewers Say About Atatus?

AI-generated summary from verified user reviews

Pros
  • Users highlight the fantastic customer support of Atatus, making it easy to resolve issues and enhance experience.
  • Users value the big-picture analytics of Atatus, enhancing their ability to monitor and optimize application performance effectively.
  • Users find Atatus to be easy to use, facilitating efficient navigation and excellent customer support.
  • Users find Atatus incredibly easy to set up, thanks to its intuitive interface and seamless integration.
  • Users value the efficiency of Atatus, enabling quick setup, insightful metrics, and proactive issue resolution.
Cons
  • Users find a lack of detailed information in Atatus documentation, leading to potential setup challenges.

What Are Recent G2 Reviews of Atatus?

What Are G2 Users Discussing About Atatus?

Netreo

Netreo is the most comprehensive IT Operations full stack monitoring and AIOps company. We provide a single source of truth for proactive performance and availability monitoring for large enterprise networks, infrastructure, applications and business services. Our solution is used by: - IT Executives to have full visibility from the business service right down into the infrastructure and network that supports it. - IT Engineering departments as a decision support system for capacity planning, and architecting modern solutions. - IT Operations teams for real time visibility into what is failing in their environment, what bottlenecks exist and who it is affecting. We provide all of these insights for systems and vendor mixes in large heterogeneous and constantly evolving environments. We have an extensive and growing list of supported vendors (over 350 integrations) including network vendors, servers, storage, virtualization, cloud platforms and others. Our platform is also an extensible environment with the ability for our user community to build and share their integrations with others in our customer community.

Average Rating: 4.5/5.0

Total Reviews: 54

How Do G2 Users Rate Netreo?

  • Has the product been a good partner in doing business?: 9.2/10 (Category avg: 8.8/10)
  • Dashboards and Visualization: 8.6/10 (Category avg: 8.8/10)
  • Observability: 8.9/10 (Category avg: 9.0/10)
  • Single Pane of Glass: 9.1/10 (Category avg: 8.8/10)

Who Is the Company Behind Netreo?

Who Uses This Product?

  • Top Industries: Information Technology and Services, Primary/Secondary Education
  • Company Size: 37% Medium, 34% Large

What Are Recent G2 Reviews of Netreo?

What Are G2 Users Discussing About Netreo?

OpenText Operations Bridge (OpsBridge)

Micro Focus is now part of OpenText! OpenText™ Operations Bridge (OpsBridge) automatically monitors and analyzes the health and performance of Hybrid IT resources across any device, operating system, database, application, or service on all data types. With industry-leading AIOps capabilities, including event consolidation engines and noise reduction technology, it uniquely integrates end-to-end service awareness with rule and machine learning-based event correlation capabilities. Problems identified using a Vertica big data lake and machine learning, for example, to identify significant logs, can be manually or automatically remediated with flexible runbook automation and orchestration. These capabilities also apply to over 200 integrations with third-party tools and technology stacks. Executive stakeholders gain actionable insight on any device that has a browser with tailored dashboards showing vital status, business, and IT KPIs. Hybrid Cloud Monitoring for the Digital Enterprise Hybrid IT has quickly become the new normal, and IT operations teams are expected to offer both cloud and on-premises infrastructure options, whichever best meets the needs of the application or service. IT operations teams must adapt to new technologies, adopt new cloud vendors and other services chosen by the business, and monitor new applications and application releases with increasing frequency. OpenText™ OpsBridge exploits all AIOps capabilities to consolidate and analyze all your data. It reduces event volumes, isolates root-cause, and provides chatbots for ChatOps. It includes automation to remediate problems quickly while reducing human error with over 8000 provided runbook – or you can build your own. Deliver What the Business Needs When It Needs It Designed to deliver real business value, OpenText™ OpsBridge integrates all your tools and automates manual tasks. It focuses operations teams on the business services and users being impacted by automatically identifying root cause faster than ever before possible. Built-in AIOps intelligent analytics drives historical analysis, applying machine learning and 50+ patented algorithms to logs, events, metrics, and topology, which is so much more powerful than search alone. Key Benefits - Increased effectiveness (time, money, resources) of tools and services - Reduced effort and time to process service requests and resolve problems - Confidence from the lines of business in IT’s ability to deliver consistent, compliant services - Business needs and strategy that are on time and budget, and in stronger collaboration with IT - Reduced business risk, better service price performance, and accelerated time-to-market for new services Key Features - Automated Hybrid IT Discovery and Monitoring: Discovery and monitoring consolidates and exploits all your data types (events, metrics, logs, and topology) within a dynamically updated and accurate model. It shows the impact of incidents, ensuring no new service goes overlooked with dynamic top-down and bottoms-up service modeling and with monitoring automation. Aggregate all our your Hybrid IT resources into a single view with 200+ technology integrations. OpsBridge solution templates and management packs provide in-depth domain-specific monitoring, including infrastructure, databases, Microsoft environments, SAP environments, middleware, cloud, big data, application platforms, automation, load balancers, and web servers. The data is integrated into collect once store one technology (COSO), a containerized common data collection and storage for real-time streaming data ingestion and processing. - Consolidate Data and Reduce Noise: IT experts advise that the application of common data ingestion and algorithmic Big Data driven analytics to all your data is the key to improving service excellence. OpsBridge includes analytics and incorporates 50+ patents for high-speed, high-volume data analysis. Automated log, metric, and event analysis, plus anomaly detection, proactively alerts operators to abnormal activity and uncovers the most relevant insights from hundreds of millions of records to help your team better prioritize. With “time machine” replay, which correlates disparate data over any time range and in relation to topology graphs, users can visualize with ease when the problem started and find the offending resource. To enhance your control of virtualized resources and dynamically changing workloads, OpsBridge proposes optimized recipes for your resources. These recipes give you the ability to visualize resources, forecast their allocation impact, and master costs to set the right level of service. - Automated AIOps: OpsBridge incorporates all 11 AIOps capabilities, from agent-based intelligence and real-time performance analytics to multi-mode stream-based and topology-based correlation of event streams over time and across dependencies. - Robotize Processes and Remediation: With more than 8,000 runbooks to choose from, including hundreds of out-of-the-box integrations to popular IT Service Management tools, OpsBridge simplifies and accelerates the automation of tasks such as remedial actions, notifications, and recovery procedures. Orchestration of complex and conditional execution and rollback provides the means to strengthen compliance, remove manual errors, and develop IT Process Automation (ITPA) to slash costs and drive compliance, releasing rare resources for more critical business priorities. Adapting to changing circumstances is a core requirement for an agile organization. That’s the DevOps methodology, and OpsBridge supports it with: > A dynamically updating model that reflects the deployment of new application and infrastructure instances, automatically activating the required monitoring. > Robotized features for ChatOps-based collaboration across teams and tools such as Sitescope, OpsBridge Reporter and Operations Orchestration > Automated tasks capture and share vital production information to the extended teams, as well as activating alternative configurations to keep your business on track. - Analyze Application Health: OpsBridge provides probes dispersed across the world to measure service quality, control SLAs, and application health. That data is also fed to COSO, processed by the AIOps based analytics, and shown in reports and dashboards. - Customize Dashboards and Reporting: The Business Value Dashboard (BVD) can exploit all the status and KPI data at your disposal to provide a TV-like, live channel of business and IT news that the BVD “paints” onto any device with a browser. BVD software can display online information—such as internet news feeds, live programs, and streaming videos—in views developed using popular office tools. BVD can consume historical data stored in COSO, preprocessing, and analyzing that data before being displayed for reporting. OpsBridge Performance Engine and BVD provide highly scalable, real-time performance collection, analysis, and graphing for hundreds of metrics and consume data from COSO. You can build and combine different metrics and IT status information into powerful dashboards you can quickly tailor into domain-specific or contextually-specific dashboard mashups. Supported Technologies Management Packs are domain-specific add-ons to OpsBridge that provide pre-programmed intelligence for that domain, domain-specific reports, and correlation rules. Full details are available here: https://www.microfocus.com/media/data-sheet/operations_bridge_ds.pdf - Infrastructure AIX CentOS Cluster Debian HPE-UX HyperV IBM LPAR KVM Oracle Enterprise Linux RedHat Solaris Solaris Zone SUSE Ubuntu VMware vSphere Windows XEN - Databases Cassandra Couchbase Apache CouchDB Informix Marklogic Microsoft SQL Server MongoDB MySQL Oracle Database Oracle RAC PostgreSQL Riak SAP Sybase ASE - Microsoft Environments Microsoft Active Directory Microsoft Azure Microsoft Exchange Server Microsoft IIS Microsoft SharePoint Server Microsoft Skype for Business - SAP Environments SAP SAP HANA - Middleware Apache ActiveMQ Apache Kafka Apache Tomcat Apache Web Server Glassfish IBM WebSphere Application Server iPlanet JBoss Memcached Oracle Weblogic Application Server Rabbit MQ Redis Varnish - Cloud Amazon Services (EC2, EBS, ECS, Dynamo DB, Beanstalk Services, AWS Service Status, RDS, ASG, ELB, SQS, RedShift, KMS, S3, AWS Billing, AWS Service Health Dashboards) Microsoft Azure (Azure Data Factory, Azure Data Lake, Virtual Machines, Azure SQL, Storage Account, Azure App Service Plan, Azure Web Apps, Azure Active Directory Discovery, Activity Logs, Windows Activity Logs hosted on the Azure environment, Azure Load Balancer, Multi-instance support for Storage account service) Google Cloud Platform OpenStack Kubernetes - Big Data Apache Falcon Apache Flume Apache Oozie Apache Spark Apache Storm Apache Zookeeper Hadoop (Apache, Cloudera distributions) HBase Micro Focus Vertica Database Solr - Application Platforms Docker (certified) Node.js - Automation Chef Jenkins - Generic BIND DHCP File Change Monitor FTP server Generic SMTP JMX Microsoft .NET OpenSSH Perfmon SNMP - Load Balancer HAProxy Nginx - Partner IBM AS/400 IBM DB2 IBM Mainframe - Web Server gUnicorn HTTP Lighttpd - Others Github Postfix - Integrations are connectors to other tools that bring in their data for display and analysis: Ambari AppDynamics Aternity BMC Impact Manager BMC Remedy CA Spectrum Cherwell ITSM CollectD DynaTrace APM (Compuware) Dynatrace Data Center RUM (Do IT WiSE) Dynatrace Data Center RUM (J9) Dynatrace Synthetics (Do IT Wise) ExtraHop Networks Helion Monasca HEP OneView HPE Systems Insight Manager IBM NetCool IBM Tivoli (J9) OpenText™ APM OpenText™ AppPulse Active / Mobile OpenText™ ArcSight Logger / ESM OpenText™ AppManager OpenText™ Network Node Manager i (NNMi) OpenText™ Operations Manager for UNIX OpenText™ Operations Manager for Windows OpenText™ Service Manager OpenText™ Universal CMDB Microsoft SCOM Nagios New Relic Nutanix Oracle Enterprise Manager Propel Service Exchange RemedyForce / Salesforce SAP Solution Manager Service Anywhere ServiceNow (AppLink) ServiceNow (Do IT WiSE) Solarwinds Network Performance Monitor Solarwinds Server and Application Monitor Splunk VMWare vCenter Operations Manager VMware vRealize Operations (VROPS) xMatters Zabbix Zenoss

Average Rating: 4.0/5.0

Total Reviews: 16

How Do G2 Users Rate OpenText Operations Bridge (OpsBridge)?
  • Has the product been a good partner in doing business?: 8.0/10 (Category avg: 8.8/10)
  • Dashboards and Visualization: 10.0/10 (Category avg: 8.8/10)
  • Observability: 10.0/10 (Category avg: 9.0/10)
  • Single Pane of Glass: 10.0/10 (Category avg: 8.8/10)

Who Is the Company Behind OpenText Operations Bridge (OpsBridge)?

  • Seller: OpenText
  • Year Founded: 1991
  • HQ Location: Waterloo, ON
  • Twitter: @OpenText
    21,565 Twitter followers
  • LinkedIn® Page: www.linkedin.com
    22,835 employees on LinkedIn®
  • Ownership: NASDAQ:OTEX

Who Uses This Product?

  • Top Industries: Information Technology and Services, Retail
  • Company Size: 106% Large, 3% Medium

What Do G2 Reviewers Say About OpenText Operations Bridge (OpsBridge)?

AI-generated summary from verified user reviews

Pros
  • Users value the powerful infrastructure monitoring capabilities of OpenText OpsBridge for efficient system management.
  • Users commend the powerful infrastructure monitoring capabilities of OpenText OpsBridge, enhancing overall operational oversight.
  • Users appreciate the monitoring ease of OpenText OpsBridge, which simplifies the management of their infrastructure effectively.
  • Users value the powerful infrastructure monitoring capabilities of OpenText OpsBridge, enhancing their operational efficiency.
Cons
  • Users face significant delay issues with OpsBridge, as support tickets often remain unresolved for extended periods.
  • Users are frustrated by delays in support, as unresolved tickets linger for weeks without adequate assistance.
  • Users report frustrating logging issues with unresolved tickets, leading to wasted time and diminished support effectiveness.
  • Users report a poor support team that often leaves tickets unresolved for extended periods, frustrating the overall experience.
  • Users are frustrated with the poor customer support, as unresolved issues linger and response times are unacceptable.

What Are Recent G2 Reviews of OpenText Operations Bridge (OpsBridge)?

What Are G2 Users Discussing About OpenText Operations Bridge (OpsBridge)?

AI can help you find the answers. G2 helps you trust them.

Connect G2 to Claude or ChatGPT for answers grounded in G2's trusted reviews, comparisons, and pricing from real user insights.

How it works

Icinga Infrastructure Monitoring

Icinga is an open source monitoring platform for enterprise infrastructure and services. Organizations use Icinga to monitor servers, networks, cloud infrastructure, Kubernetes environments, applications, databases, VMware, and Windows systems across distributed and heterogeneous IT environments. Developed in Germany, Icinga is used by global enterprises, public institutions, service providers, and mid-sized companies that require flexible and scalable monitoring without vendor lock-in. The free and open source Icinga core already delivers comprehensive monitoring capabilities for infrastructure and services. Organizations can build and operate fully featured monitoring environments without licensing barriers while keeping full control over their monitoring data, workflows, and integrations. Icinga is designed for complex environments where standard monitoring approaches often reach their limits. Its distributed architecture supports everything from smaller deployments to large multi-site infrastructures with thousands of monitored systems and services. High availability and workload distribution help maintain operational resilience in critical environments. The platform integrates naturally into existing IT operations and DevOps ecosystems. Open APIs, Infrastructure as Code practices, and automation capabilities support standardized and scalable monitoring workflows. Icinga Director enables centralized configuration management and automated synchronization with external sources such as CMDBs, inventory systems, and cloud platforms. Monitoring data from different technologies and environments is consolidated into a unified operational view. Teams can combine health checks, metrics, and logs to troubleshoot incidents faster, analyze trends, and improve capacity planning. Dashboards, reporting, and business process views help operations teams and service owners focus on the information that matters most. Icinga supports integrations with tools such as PagerDuty, Opsgenie, Slack, Grafana, Prometheus, and many other operational platforms. Thousands of plugins and extensions allow organizations to adapt monitoring to their own infrastructure and operational requirements. Optional enterprise subscriptions provide professional support, long-term maintenance, and selected enterprise features such as Dependency Views and advanced team management capabilities. Organizations use Icinga to build scalable, vendor-independent monitoring strategies for modern infrastructure while maintaining flexibility across on-premises, cloud-native, and hybrid environments.

Average Rating: 4.4/5.0

Total Reviews: 22

How Do G2 Users Rate Icinga Infrastructure Monitoring?

  • Has the product been a good partner in doing business?: 8.3/10 (Category avg: 8.8/10)

Who Is the Company Behind Icinga Infrastructure Monitoring?

  • Seller: Icinga
  • Year Founded: 2018
  • HQ Location: Nuremberg, Bavaria
  • LinkedIn® Page: www.linkedin.com
    14 employees on LinkedIn®

Who Uses This Product?

  • Top Industries: Information Technology and Services
  • Company Size: 55% Large, 36% Medium

What Are Recent G2 Reviews of Icinga Infrastructure Monitoring?

Helios

Helios is a dev-first observability platform that helps Dev and Ops teams shorten the time to find and fix issues in distributed applications. Built on OpenTelemetry, Helios provides traces and correlates them with logs and metrics, enabling end-to-end app visibility and faster troubleshooting.

Average Rating: 4.9/5.0

Total Reviews: 12

How Do G2 Users Rate Helios?

  • Has the product been a good partner in doing business?: 10.0/10 (Category avg: 8.8/10)
  • Dashboards and Visualization: 9.3/10 (Category avg: 8.8/10)
  • Observability: 9.4/10 (Category avg: 9.0/10)
  • Single Pane of Glass: 8.8/10 (Category avg: 8.8/10)

Who Is the Company Behind Helios?

  • Seller: Helios
  • Year Founded: 2021
  • HQ Location: Tel Aviv, Tel Aviv
  • Twitter: @GetHelios
    67 Twitter followers
  • LinkedIn® Page: www.linkedin.com
    55 employees on LinkedIn®

Who Uses This Product?

  • Company Size: 50% Small, 25% Medium

What Are Recent G2 Reviews of Helios?

System Center Operations Manager

At Microsoft, our mission is to empower every person and every organization on the planet to achieve more. Our mission is grounded in both the world in which we live and the future we strive to create

Average Rating: 4.3/5.0

Total Reviews: 9

How Do G2 Users Rate System Center Operations Manager?

  • Has the product been a good partner in doing business?: 7.9/10 (Category avg: 8.8/10)

Who Is the Company Behind System Center Operations Manager?

  • Seller: Microsoft
  • Year Founded: 1975
  • HQ Location: Redmond, Washington
  • Twitter: @microsoft
    13,091,739 Twitter followers
  • LinkedIn® Page: www.linkedin.com
    232,750 employees on LinkedIn®
  • Ownership: MSFT

Who Uses This Product?

  • Company Size: 80% Large, 10% Medium

What Are Recent G2 Reviews of System Center Operations Manager?

What Are G2 Users Discussing About System Center Operations Manager?

Virtana Platform

Virtana delivers the industry's deepest hybrid infrastructure observability platform, empowering enterprises to ensure the availability, efficiency, and resiliency of their mission-critical services. Our AI-powered platform unifies visibility across on-premises, cloud, and Kubernetes environments, providing comprehensive real-time insights and intelligent automation. Key differentiators: · AI-driven early warning system and automated root cause analysis · Comprehensive topology discovery and mapping across your entire IT estate · Consolidated alerts with policy-based noise reduction · Natural language infrastructure querying through Virtana Copilot · Vendor-agnostic platform supporting both on-premises and cloud deployments Organizations choose Virtana to: · Reduce mean time to resolution (MTTR) through AI-powered automation · Lower infrastructure costs with intelligent optimization · Improve team productivity by eliminating alert noise · Support demanding AI workloads with deep infrastructure insights · Transform infrastructure from a cost center to a strategic asset Whether you're managing traditional IT, hybrid environments, or advanced AI data centers, Virtana provides the deep observability and intelligent automation needed to drive operational excellence and accelerate digital transformation.

Average Rating: 4.3/5.0

Total Reviews: 35

How Do G2 Users Rate Virtana Platform?

  • Has the product been a good partner in doing business?: 9.0/10 (Category avg: 8.8/10)
  • Dashboards and Visualization: 10.0/10 (Category avg: 8.8/10)
  • Observability: 10.0/10 (Category avg: 9.0/10)
  • Single Pane of Glass: 10.0/10 (Category avg: 8.8/10)

Who Is the Company Behind Virtana Platform?

  • Seller: Virtana
  • Year Founded: 2008
  • HQ Location: N/A
  • Twitter: @VirtanaCorp
    9,421 Twitter followers
  • LinkedIn® Page: www.linkedin.com
    168 employees on LinkedIn®

Who Uses This Product?

  • Company Size: 53% Large, 26% Medium

What Are Recent G2 Reviews of Virtana Platform?

What Are G2 Users Discussing About Virtana Platform?

EasyVista Service Manager

EasyVista Service Manager is a proven ITSM solution with the sophistication to support the most complex ITIL requirements but with the simplicity, agility, and mobility required to make ITSM easy to use and easy to deliver. Reduce ITSM costs by up to 50% with codeless configuration, smart automation, and out-of-the-box ITIL processes. Get the enterprise features you need to run IT like a business, including multilingual support, IT Asset and Financial Management, and advanced reporting analytics.

Average Rating: 4.0/5.0

Total Reviews: 97

How Do G2 Users Rate EasyVista Service Manager?

  • Has the product been a good partner in doing business?: 8.2/10 (Category avg: 8.8/10)
  • Dashboards and Visualization: 10.0/10 (Category avg: 8.8/10)
  • Observability: 10.0/10 (Category avg: 9.0/10)
  • Single Pane of Glass: 10.0/10 (Category avg: 8.8/10)

Who Is the Company Behind EasyVista Service Manager?

  • Seller: EasyVista
  • Year Founded: 1988
  • HQ Location: Noisy-le-Grand
  • Twitter: @EasyVista
    1,283 Twitter followers
  • LinkedIn® Page: www.linkedin.com
    368 employees on LinkedIn®
  • Ownership: EPA: ALEZV

Who Uses This Product?

  • Top Industries: Information Technology and Services, Higher Education
  • Company Size: 61% Large, 30% Medium

What Do G2 Reviewers Say About EasyVista Service Manager?

AI-generated summary from verified user reviews

Pros
  • Users value the ease of integration with EasyVista Service Manager, appreciating its flexibility and user-friendly implementation.
  • Users highlight the ease of use in EasyVista Service Manager, making implementation and daily tasks straightforward.
  • Users value the flexibility of EasyVista Service Manager, enabling tailored solutions to meet diverse business needs.
  • Users value the fast and easy implementation of EasyVista Service Manager, enhancing overall user experience and satisfaction.
  • Users value the excellent customer support of EasyVista Service Manager, enhancing their overall experience with the tool.
Cons
  • Users find the complex configuration requires initial consultancy support for a proper setup before effective use.
  • Users find the interface cumbersome at times, particularly when navigating certain development-related processes.
  • Users find the limited reporting capabilities of EasyVista Service Manager inadequate, often needing external tools for analytics.
  • Users find the complex setup of EasyVista requires initial consultancy, complicating the start of their experience.
  • Users struggle with the confusing interface, finding it difficult to navigate and manage various features effectively.

What Are Recent G2 Reviews of EasyVista Service Manager?

What Are G2 Users Discussing About EasyVista Service Manager?

Chronosphere

Chronosphere is the only observability platform that puts you back in control by taming rampant data growth and cloud-native complexity, delivering increased business confidence. Chronosphere is an efficient, reliable and flexible SaaS solution, built for scaling cloud-native engineering organizations. Teams at startups to well-known global brands in the Fortune 500 around the world trust Chronosphere to help them operate scalable, highly available, and resilient applications. The Chronosphere platform can ingest metrics and distributed trace data in a variety of open source formats, allowing you to leverage existing observability investments for greater speed and flexibility.

Average Rating: 4.5/5.0

Total Reviews: 20

How Do G2 Users Rate Chronosphere?

  • Has the product been a good partner in doing business?: 9.8/10 (Category avg: 8.8/10)
  • Dashboards and Visualization: 10.0/10 (Category avg: 8.8/10)
  • Observability: 10.0/10 (Category avg: 9.0/10)

Who Is the Company Behind Chronosphere?

  • Seller: Palo Alto Networks
  • Year Founded: 2005
  • HQ Location: Santa Clara, CA
  • Twitter: @PaloAltoNtwks
    128,951 Twitter followers
  • LinkedIn® Page: www.linkedin.com
    23,492 employees on LinkedIn®
  • Ownership: NYSE: PANW

Who Uses This Product?

  • Top Industries: Financial Services
  • Company Size: 65% Large, 25% Medium

What Are Recent G2 Reviews of Chronosphere?

NetApp Data Infrastructure Insights

NetApp Cloud Insights is an infrastructure monitoring tool that gives you visibility into your complete infrastructure. With Cloud Insights, you can monitor, troubleshoot and optimize all your resources including your public clouds and your private data centers.

Average Rating: 4.4/5.0

Total Reviews: 13

How Do G2 Users Rate NetApp Data Infrastructure Insights?

  • Has the product been a good partner in doing business?: 8.9/10 (Category avg: 8.8/10)
  • Dashboards and Visualization: 9.2/10 (Category avg: 8.8/10)
  • Observability: 9.2/10 (Category avg: 9.0/10)
  • Single Pane of Glass: 10.0/10 (Category avg: 8.8/10)

Who Is the Company Behind NetApp Data Infrastructure Insights?

  • Seller: NetApp
  • Year Founded: 1992
  • HQ Location: Sunnyvale, California
  • Twitter: @NetApp
    118,015 Twitter followers
  • LinkedIn® Page: www.linkedin.com
    12,706 employees on LinkedIn®
  • Ownership: NASDAQ

Who Uses This Product?

  • Top Industries: Information Technology and Services
  • Company Size: 43% Large, 29% Medium

What Do G2 Reviewers Say About NetApp Data Infrastructure Insights?

AI-generated summary from verified user reviews

Pros
  • Users appreciate the effective real-time monitoring of NetApp Data Infrastructure Insights, enhancing cloud resource management and integration.
  • Users value the effective reporting capabilities of NetApp Data Infrastructure Insights, aiding in understanding infrastructure deployments.
  • Users value the real-time reporting features of NetApp Data Infrastructure Insights for enhanced cloud resource management.
  • Users value the all-in-one solution of NetApp Data Infrastructure Insights, enjoying seamless integration and real-time analytics.
  • Users value the real-time insights from NetApp Data Infrastructure Insights, enhancing infrastructure management and analytics capabilities.
Cons
  • Users find the cost prohibitive, making it a challenge for some organizations to adopt NetApp Data Infrastructure Insights.
  • Users often face pricing issues with NetApp Data Infrastructure Insights, making cost management challenging and frustrating.

What Are Recent G2 Reviews of NetApp Data Infrastructure Insights?

What Are G2 Users Discussing About NetApp Data Infrastructure Insights?

Apica

Apica provides agentic-ready infrastructure purpose-built for the AI era. Apica helps enterprises take control of exploding telemetry volumes by providing the pipeline control, metrics foundation, and data readiness that AI agents demand, at up to 40% lower total cost of ownership than legacy observability platforms. Unlike platform-centric solutions that ingest everything indiscriminately and charge at every step, Apica's pipeline-first architecture processes, enriches, and governs telemetry before costly platform ingestion, giving enterprises clean, governed, real-time data without vendor lock-in. Apica Ascent, the only complete telemetry data management product suite purpose-built for agentic AI environments, serves global enterprises across financial services, healthcare, retail, telecommunications, and technology sectors. Recognized as a Visionary in the 2025 Gartner Magic Quadrant for Observability Platforms. Learn more at www.apica.io or visit docs.apica.io.

Average Rating: 4.2/5.0

Total Reviews: 15

How Do G2 Users Rate Apica?

  • Has the product been a good partner in doing business?: 7.5/10 (Category avg: 8.8/10)
  • Dashboards and Visualization: 8.3/10 (Category avg: 8.8/10)
  • Observability: 9.2/10 (Category avg: 9.0/10)
  • Single Pane of Glass: 8.3/10 (Category avg: 8.8/10)

Who Is the Company Behind Apica?

  • Seller: Apica
  • Year Founded: 2005
  • HQ Location: Stockholm, SE
  • LinkedIn® Page: www.linkedin.com
    83 employees on LinkedIn®

Who Uses This Product?

  • Company Size: 47% Medium, 33% Large

What Do G2 Reviewers Say About Apica?

AI-generated summary from verified user reviews

Pros
  • Users find Apica easy to use, enabling effortless testing with a user-friendly interface for all skill levels.
  • Users value the real-time monitoring capability of Apica, enhancing system performance and decision-making through timely insights.
  • Users value the comprehensive data analysis of Apica, enabling insights into system opportunities and issues effectively.
  • Users find the easy setup of Apica very beneficial for quickly conducting load tests without complex configurations.
  • Users value the efficient issue detection features of Apica, enabling proactive management of system performance and health.
Cons
  • Users find Circonus' limited features frustrating during trials, wishing for broader access to explore its full capabilities.
  • Users note the limited features during the trial, suggesting a broader selection for better evaluation is needed.
  • Users find the complex setup of Apica challenging, requiring significant time to customize and train effectively.
  • Users note the high pricing of Apica, which may be challenging for smaller firms with limited budgets.
  • Users find difficult customization in Apica, requiring time to adjust it for specific needs before production use.

What Are Recent G2 Reviews of Apica?

What Are G2 Users Discussing About Apica?

Pure1 AIOps

Pure1 Meta is global intelligence built from a massive collection of storage array health and performance data. By continuously scanning call-home telemetry from Pure’s installed base, Pure1 Meta uses machine learning predictive analytics to help resolve potential issues and optimize your workloads.

Average Rating: 4.7/5.0

Total Reviews: 12

How Do G2 Users Rate Pure1 AIOps?

  • Has the product been a good partner in doing business?: 9.2/10 (Category avg: 8.8/10)

Who Is the Company Behind Pure1 AIOps?

  • Seller: Pure Storage
  • Year Founded: 2009
  • HQ Location: Santa Clara, US
  • LinkedIn® Page: www.linkedin.com
    5,173 employees on LinkedIn®
  • Ownership: PSTG
  • Total Revenue (USD mm): $1,359

Who Uses This Product?

  • Company Size: 42% Medium, 33% Large

What Do G2 Reviewers Say About Pure1 AIOps?

AI-generated summary from verified user reviews

Pros
  • Users appreciate the great and fast customer support offered by Pure1 AIOps, enhancing their overall experience.
  • Users appreciate the ease of use of Pure1 AIOps, benefiting from a user-friendly admin console and efficient implementation.
  • Users appreciate the implementation ease of Pure1 AIOps, benefiting from a fully built-out system and user-friendly configurations.
  • Users value the advanced security features of Pure1 AIOps, enhancing their overall safety and confidence in the system.
Cons
  • Users find the higher upfront cost challenging to justify, along with the ongoing hardware subscription fees.
  • Users find the upfront costs and hardware subscription challenging to justify, impacting their overall experience with Pure1 AIOps.

What Are Recent G2 Reviews of Pure1 AIOps?

What Are G2 Users Discussing About Pure1 AIOps?

CA Unified Infrastructure Management

Saas solution to core IT Service Management processes. Rapid setup and configuration for quick time to value.

Average Rating: 3.4/5.0

Total Reviews: 4

How Do G2 Users Rate CA Unified Infrastructure Management?

  • Has the product been a good partner in doing business?: 6.7/10 (Category avg: 8.8/10)
  • Dashboards and Visualization: 8.3/10 (Category avg: 8.8/10)
  • Observability: 8.3/10 (Category avg: 9.0/10)
  • Single Pane of Glass: 8.3/10 (Category avg: 8.8/10)

Who Is the Company Behind CA Unified Infrastructure Management?

  • Seller: Broadcom
  • Year Founded: 1991
  • HQ Location: San Jose, CA
  • Twitter: @broadcom
    63,909 Twitter followers
  • LinkedIn® Page: www.linkedin.com
    44,602 employees on LinkedIn®
  • Ownership: NASDAQ: CA

Who Uses This Product?

  • Company Size: 100% Large, 60% Medium

What Are Recent G2 Reviews of CA Unified Infrastructure Management?

CubeAPM

CubeAPM is an OpenTelemetry-native observability and application performance monitoring (APM) platform that helps engineering and DevOps teams monitor applications, infrastructure, logs, and metrics from a single unified dashboard. Built for modern cloud and on-prem environments, CubeAPM offers full-stack visibility without sacrificing data control. It can be self-hosted inside your own cloud or data center, making it ideal for teams that need enterprise-grade observability while maintaining compliance with ISO 27001 standards. Most teams face a trade-off in observability — cloud SaaS tools are easy to run but send sensitive data outside your cloud, while open-source stacks demand heavy operations. CubeAPM removes this compromise by combining the control of self-hosting with the simplicity of SaaS. With flat usage-based pricing at $0.15 per GB, smart sampling, and unlimited retention, CubeAPM delivers predictable, affordable observability for organizations of any scale. Dashboards load instantly, data queries run fast, and teams can monitor microservices, Kubernetes clusters, APIs, and distributed systems in real time. Key Highlights OpenTelemetry-native: Ingest data from any stack with full compatibility. Self-hosted but managed: Runs in your environment while upgrades and maintenance are handled by CubeAPM. Unlimited retention: Store logs, traces, and metrics as long as you need. Transparent pricing: $0.15 / GB with no host-based fees or hidden charges. ISO 27001 compliant: Ensures quality, reliability, and operational excellence. CubeAPM is the ideal observability solution for teams seeking performance insights, compliance readiness, and total control — without the high costs or operational complexity of traditional APM tools.

Average Rating: 4.9/5.0

Total Reviews: 26

How Do G2 Users Rate CubeAPM?

  • Has the product been a good partner in doing business?: 10.0/10 (Category avg: 8.8/10)
  • Dashboards and Visualization: 10.0/10 (Category avg: 8.8/10)
  • Observability: 10.0/10 (Category avg: 9.0/10)
  • Single Pane of Glass: 10.0/10 (Category avg: 8.8/10)

Who Is the Company Behind CubeAPM?

Who Uses This Product?

  • Top Industries: Information Technology and Services
  • Company Size: 54% Small, 46% Medium

What Do G2 Reviewers Say About CubeAPM?

AI-generated summary from verified user reviews

Pros
  • Users highlight the responsive customer support of CubeAPM, appreciating quick assistance and availability on Slack.
  • Users value the cost optimization of CubeAPM, appreciating its affordability compared to other observability tools.
  • Users value the effective monitoring capabilities of CubeAPM, noting quick data integration and responsive support.
  • Users appreciate the affordable and predictable pricing of CubeAPM, making it a cost-effective observability solution.
  • Users commend the real-time monitoring capabilities of CubeAPM, enhancing visibility into performance and reducing downtime.
Cons
  • Users find CubeAPM has inadequate monitoring capabilities, particularly for mobile apps and advanced AI observability.
  • Users find the absence of mobile and security monitoring features in CubeAPM limits its overall capabilities.
  • Users note the limited mobile app monitoring capabilities of CubeAPM, particularly for iOS, affecting overall effectiveness.
  • Users note the limited features of CubeAPM, especially in AI-driven observability and mobile app monitoring.
  • Users highlight the feature limitations of CubeAPM, particularly in mobile app monitoring and dashboard effectiveness.

What Are Recent G2 Reviews of CubeAPM?

Sematext Cloud

Sematext Cloud is an innovative, unified platform with all-in-one solutions for infrastructure monitoring, application performance monitoring, log management, real user monitoring, and synthetic monitoring to provide unified, real-time observability of your entire technology stack. It's used by organizations of all sizes and across a wide range of industries, with the goal of driving collaboration between engineering and business teams, reduce the time of root-cause-analysis, understand user behavior and track key business metrics.

Average Rating: 4.7/5.0

Total Reviews: 38

How Do G2 Users Rate Sematext Cloud?

  • Has the product been a good partner in doing business?: 9.5/10 (Category avg: 8.8/10)

Who Is the Company Behind Sematext Cloud?

  • Seller: Sematext
  • Year Founded: 2007
  • HQ Location: Brooklyn, NY
  • Twitter: @sematext
    3,758 Twitter followers
  • LinkedIn® Page: www.linkedin.com
    16 employees on LinkedIn®

Who Uses This Product?

  • Top Industries: Information Technology and Services
  • Company Size: 47% Medium, 45% Small

What Are Recent G2 Reviews of Sematext Cloud?

What Are G2 Users Discussing About Sematext Cloud?

Tian Lin
TL
Researched and written by Tian Lin
Updated April 10, 2026