Best Data Visualization Tools for Medium-Sized Businesses

How Many Data Visualization Tools Products Does G2 Track?

Total Products under this Category: 762

Category Stats (Nov 2026)

  • Average Rating: 4.44/5 The average rating of products in this category, based on all submitted ratings
  • Top Trending Product: Upsolve AI (+1.75%) - Among all products in this category, Upsolve AI recorded the largest rating increase compared to last month

Last updated: November 01, 2026

How Does G2 Rank Data Visualization Tools Products?

Why You Can Trust G2's Software Rankings:

  • 30 Analysts and Data Experts
  • 22,900+ Authentic Reviews
  • 762+ Products
  • Unbiased Rankings

G2's software rankings are built on verified user reviews, rigorous moderation, and a consistent research methodology maintained by a team of analysts and data experts. Each product is measured using the same transparent criteria, with no paid placement or vendor influence. While reviews reflect real user experiences, which can be subjective, they offer valuable insight into how software performs in the hands of professionals. Together, these inputs power the G2 Score, a standardized way to compare tools within every category.

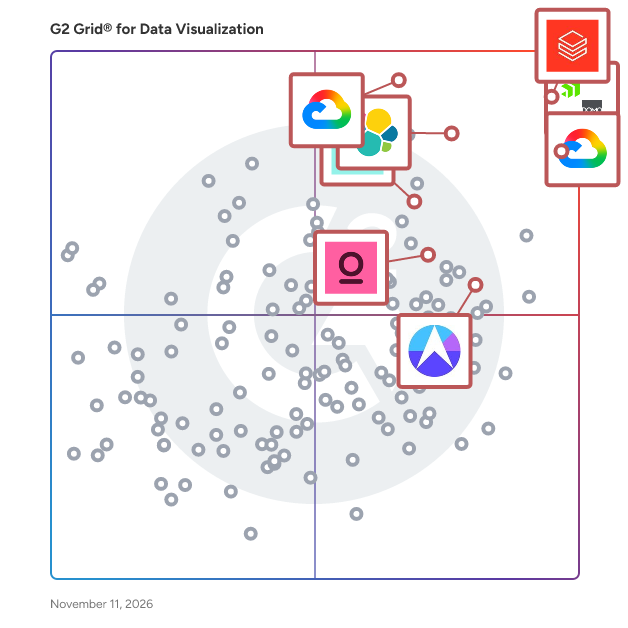
G2 Grid® for Data Visualization Tools

G2 Grid® for Data Visualization Tools plotting products by satisfaction and market presence

Highlighted products: Domo, Databricks, Looker, Data Studio, Elastic Stack, Drivetrain, Omni Analytics, and Sisense.

Underlying data: [Grid® JSON](https://www.g2.com/categories/data-visualization-tools/grids.json?focus%5B%5D=domo&focus%5B%5D=databricks&focus%5B%5D=looker&focus%5B%5D=data-studio&focus%5B%5D=elastic-stack&focus%5B%5D=drivetrain-drivetrain&focus%5B%5D=omni-analytics-inc-omni-analytics&focus%5B%5D=sisense&segment=mid-market)

Domo

Domo’s AI and data platform business is now part of Progress Software. Domo's cloud-native AI data readiness platform complements and significantly broadens Progress' data platform offerings, creating powerful synergies to deliver innovative, secure and scalable AI data readiness solutions worldwide. Together, these capabilities will help customers turn fragmented enterprise data and knowledge into governed, AI-ready intelligence, improving the security, governance and cost of AI-powered initiatives. Domo is the agentic platform for the intelligent enterprise, helping organizations connect, govern, activate, and distribute data and AI across their business. Built for enterprises, Domo works with existing cloud data platforms such as Snowflake, BigQuery, and Databricks to help teams turn governed data into AI-powered agents, apps, workflows, and analytics. Domo is built on three layers. The data foundation connects and governs data across cloud data platforms and business systems. The activation layer enables organizations to build AI agents, apps, workflows, automations, and dashboards on top of that foundation. The distribution layer delivers intelligence where work happens through embedded apps, mobile, dashboards, and AI assistants using Model Context Protocol (MCP). Governance underpins every layer, helping organizations scale AI and data products with security and trust. Key capabilities include: • Connecting and governing data across cloud data platforms and enterprise applications. • Building AI agents, apps, workflows, automations, dashboards, and analytics. • Delivering data and AI through dashboards, embedded apps, AI assistants, and AI agents. • Supporting both low-code and pro-code development for business and technical teams. • Applying governance, security, and access controls across data and AI. Organizations use Domo for AI agents, apps, and workflows, as well as business intelligence, operational analytics, embedded analytics, and executive reporting. By combining governed data, AI activation, app development, and distribution in a single platform, Domo helps organizations build and scale trusted data products across the enterprise.

Average Rating: 4.3/5.0

Total Reviews: 1,078

How Do G2 Users Rate Domo?

  • Has the product been a good partner in doing business?: 8.8/10 (Category avg: 9.0/10)
  • Dashboards: 8.3/10 (Category avg: 9.0/10)
  • Steps to Answer: 8.1/10 (Category avg: 8.6/10)
  • Formats: 8.5/10 (Category avg: 8.6/10)

Who Is the Company Behind Domo?

  • Seller: Domo
  • Company Website:
  • Year Founded: 2010
  • HQ Location: American Fork, UT
  • LinkedIn® Page: www.linkedin.com
    1,288 employees on LinkedIn®
  • Ownership: NASDAQ: DOMO

Who Uses This Product?

  • Who Uses This: Data Analyst, Business Analyst
  • Top Industries: Computer Software, Information Technology and Services
  • Company Size: 50% Medium, 28% Large

What Do G2 Reviewers Say About Domo?

AI-generated summary from verified user reviews

Pros
  • Users value the ease of use of Domo, appreciating its intuitive interface and straightforward data integration capabilities.
  • Users love Domo for its intuitive data visualization, making it easy to create dashboards and extract insights efficiently.
  • Users find Domo extremely intuitive, enabling quick dashboard creation and seamless integration of diverse data sources.
  • Users value the easy integrations of Domo, allowing seamless connection to numerous data sources for insightful analytics.
  • Users praise Domo's seamless integrations, enabling easy connections to various data sources for effective analytics and monitoring.
Cons
  • Users find the steep learning curve of Domo challenging, impacting onboarding and productivity for some staff.
  • Users find it challenging to keep up with missing features and updates, necessitating dedicated resources for tracking.
  • Users face significant data management issues, finding it challenging to secure, clean, and efficiently manage datasets in Domo.
  • Users find Domo's pricing to be expensive and confusing, especially as usage and storage requirements increase.
  • Users find Domo's complexity challenging, citing issues in data management and a lack of support for troubleshooting.

What Are Recent G2 Reviews of Domo?

What Are G2 Users Discussing About Domo?

Databricks

Databricks is the Data and AI company. More than 20,000 organizations worldwide — including adidas, AT&T, Bayer, Block, Mastercard, Rivian, Unilever, and 70% of the Fortune 500 — rely on the Databricks Data + AI Platform to build and scale data and AI apps, analytics, and agents. Headquartered in San Francisco with 30+ offices around the globe, Databricks offers a unified platform that includes Genie, Lakebase, Agent Bricks, Lakeflow, Lakehouse, and Unity Catalog. Founded in 2013 by the original creators of Apache Spark™, Delta Lake, MLflow and Unity Catalog, Databricks is built on an open lakehouse architecture that brings data, analytics and AI together. The platform is used by data engineers, data scientists, analysts, developers, machine learning teams, AI teams and business users to collaborate across the full data and AI lifecycle. Key Databricks capabilities include: - Data engineering: Build, automate and manage reliable batch, streaming and real-time data pipelines. - Analytics and business intelligence: Run SQL analytics, create dashboards and enable business teams to explore data. - Data governance: Discover, secure and manage data and AI assets across teams, clouds and workloads. - Machine learning and AI: Develop models, build generative AI applications and create production-grade AI agents. - Data applications: Build and deploy data-driven applications using governed enterprise data. Available across AWS, Azure and Google Cloud, Databricks helps organizations work across clouds, reduce data silos and simplify collaboration across teams and tools. Customers use Databricks for use cases such as customer personalization, fraud detection, predictive maintenance, real-time analytics, cybersecurity, healthcare research, financial risk management, supply chain optimization and AI-powered decision-making. Databricks is used across industries including financial services, healthcare and life sciences, retail, manufacturing, energy and the public sector. Organizations use the platform to modernize data infrastructure, accelerate AI adoption and turn enterprise data into business value.

Average Rating: 4.6/5.0

Total Reviews: 1,374

How Do G2 Users Rate Databricks?

  • Has the product been a good partner in doing business?: 8.9/10 (Category avg: 9.0/10)

Who Is the Company Behind Databricks?

  • Seller: Databricks Inc.
  • Company Website:
  • Year Founded: 2013
  • HQ Location: San Francisco, CA
  • LinkedIn® Page: www.linkedin.com
    14,336 employees on LinkedIn®

Who Uses This Product?

  • Who Uses This: Data Engineer, Data Analyst
  • Top Industries: Information Technology and Services, Financial Services
  • Company Size: 46% Large, 39% Medium

What Do G2 Reviewers Say About Databricks?

AI-generated summary from verified user reviews

Pros
  • Users appreciate the seamless integration of big data and AI in Databricks, enhancing collaboration and performance.
  • Users appreciate the ease of use of Databricks, valuing its seamless integration and fast performance.
  • Users appreciate the seamless integration of Databricks with big data processing and AI, enhancing collaboration and performance.
  • Users value the seamless collaboration features of Databricks, enhancing teamwork and data analysis across departments.
  • Users appreciate the seamless integration of big data processing and AI in Databricks, enhancing collaboration and efficiency.
Cons
  • Users find the learning curve steep with Databricks, requiring time and skills to adapt effectively.
  • Users note that the cost can scale quickly, making cost monitoring and control a significant challenge.
  • Users find the steep learning curve of Databricks challenging, requiring considerable effort to adapt for business use cases.
  • Users find the inadequate ingestion options for non-standard data sources a limitation in Databricks' functionality.
  • Users find Databricks' complexity challenging, especially for beginners and smaller teams trying to fine-tune the system.

What Are Recent G2 Reviews of Databricks?

What Are G2 Users Discussing About Databricks?

Looker

Looker, Google Cloud’s business intelligence platform, enables you to chat with your data. Organizations turn to Looker for self-service and governed BI, to build custom applications with trusted metrics, or to bring Looker modeling to their existing environment. The result is improved data engineering efficiency and true business transformation.

Average Rating: 4.4/5.0

Total Reviews: 1,670

How Do G2 Users Rate Looker?

  • Has the product been a good partner in doing business?: 8.9/10 (Category avg: 9.0/10)
  • Dashboards: 8.7/10 (Category avg: 9.0/10)
  • Steps to Answer: 8.1/10 (Category avg: 8.6/10)
  • Formats: 8.3/10 (Category avg: 8.6/10)

Who Is the Company Behind Looker?

  • Seller: Google
  • Year Founded: 1998
  • HQ Location: Mountain View, CA
  • LinkedIn® Page: www.linkedin.com
    301,144 employees on LinkedIn®
  • Ownership: NASDAQ:GOOG
  • Phone: +1 (650) 253-0000

Who Uses This Product?

  • Who Uses This: Data Analyst, Data Engineer
  • Top Industries: Computer Software, Information Technology and Services
  • Company Size: 59% Medium, 21% Small

What Do G2 Reviewers Say About Looker?

AI-generated summary from verified user reviews

Pros
  • Users appreciate the ease of use with Looker, facilitating real-time reporting and seamless integration for effective analytics.
  • Users value Looker's real-time dashboards and powerful data modeling, enhancing self-service analytics and consistent reporting across teams.
  • Users enjoy the easy integrations of Looker, facilitating seamless connection with data warehouses for efficient analytics.
  • Users appreciate the seamless integrations of Looker, enhancing data management and analytics accessibility across their platforms.
  • Users value Looker's real-time data visualization, enabling clear, interactive dashboards that drive informed decision-making.
Cons
  • Users find the learning curve steep, especially non-technical users who may struggle with LookML and dashboard customization.
  • Users find the learning difficulty of Looker's LookML challenging, especially for those without technical expertise.
  • Users often face slow loading times, especially with large data sets, impacting their overall experience with Looker.
  • Users often experience slow performance with Looker, particularly when handling large datasets and complex dashboards.
  • Users find the complexity of Looker challenging, especially due to the steep learning curve and limited customizations.

What Are Recent G2 Reviews of Looker?

What Are G2 Users Discussing About Looker?

AI can help you find the answers. G2 helps you trust them.

Connect G2 to Claude or ChatGPT for answers grounded in G2's trusted reviews, comparisons, and pricing from real user insights.

How it works

Data Studio

Data Studio offers self-service business intelligence with unmatched flexibility for smarter business decisions. Featuring connections to more than 1,000+ data sources, you can create highly visual, intuitive reports and share them with your team with consistent metrics. Data Studio helps you tell impactful stories by creating and sharing engaging reports and data visualization, showcasing your business metrics and dimensions with intuitive smart reports, with automatic sharing for informed collaboation. Create meaningful, shareable, customizable, charts and graphs with just a few clicks, and now, with Gemini in Looker, automatically generate reports, visualizations and slides and save countless hours."

Average Rating: 4.4/5.0

Total Reviews: 457

How Do G2 Users Rate Data Studio?

  • Has the product been a good partner in doing business?: 8.2/10 (Category avg: 9.0/10)
  • Dashboards: 9.1/10 (Category avg: 9.0/10)
  • Steps to Answer: 8.1/10 (Category avg: 8.6/10)
  • Formats: 8.5/10 (Category avg: 8.6/10)

Who Is the Company Behind Data Studio?

  • Seller: Google
  • Year Founded: 1998
  • HQ Location: Mountain View, CA
  • LinkedIn® Page: www.linkedin.com
    301,144 employees on LinkedIn®
  • Ownership: NASDAQ:GOOG
  • Phone: +1 (650) 253-0000

Who Uses This Product?

  • Who Uses This: Digital Marketing Specialist, Marketing Manager
  • Top Industries: Marketing and Advertising, Computer Software
  • Company Size: 45% Small, 37% Medium

What Do G2 Reviewers Say About Data Studio?

AI-generated summary from verified user reviews

Pros
  • Users appreciate the ease of setup in Data Studio, which allows for quick, flexible dashboard creation.
  • Users love the flexible visualization capabilities of Looker Studio, making data insights easily accessible and actionable.
  • Users value the easy integrations in Looker Studio, enhancing their ability to visualize and share data effectively.
  • Users appreciate the ease of data visualization with Data Studio, making complex data clear and accessible for insights.
  • Users love the collaborative sharing capabilities of Looker Studio, making it easy to present data visually to teams and clients.
Cons
  • Users find Looker Studio's limited customization frustrating, especially when needing more advanced visualisation options.
  • Users often experience slow performance when connected to multiple data sources or working with larger datasets.
  • Users often find Looker Studio's slow loading times frustrating, especially with large datasets or numerous charts.
  • Users often face connectivity issues with Looker Studio, leading to frustrating experiences with unreliable connectors and slow performance.
  • Users find limitations in storage, as performance slows with large datasets and advanced customizations are restricted.

What Are Recent G2 Reviews of Data Studio?

What Are G2 Users Discussing About Data Studio?

Elastic Stack

The Elastic Stack, commonly known as the ELK Stack, is a comprehensive suite of open-source tools designed for ingesting, storing, analyzing, and visualizing data in real-time. It comprises Elasticsearch, Kibana, Beats, and Logstash, enabling users to handle data from any source and in any format efficiently. Key Features and Functionality: - Elasticsearch: A distributed, JSON-based search and analytics engine that allows for rapid storage, search, and analysis of large volumes of data. - Kibana: An extensible user interface that provides powerful visualizations, dashboards, and management tools to interpret and present data effectively. - Beats and Logstash: Data ingestion tools that collect and process data from various sources, transforming and forwarding it to Elasticsearch for indexing. - Integrations: A multitude of pre-built integrations that facilitate seamless data collection and connection with the Elastic Stack, enabling quick insights. Primary Value and User Solutions: The Elastic Stack empowers organizations to harness the full potential of their data by providing a scalable and resilient platform for real-time search and analytics. It addresses challenges such as managing large datasets, ensuring high availability, and delivering relevant search results swiftly. By offering a unified solution for data ingestion, storage, analysis, and visualization, the Elastic Stack enables users to gain actionable insights, enhance operational efficiency, and make informed decisions based on their data.

Average Rating: 4.5/5.0

Total Reviews: 106

How Do G2 Users Rate Elastic Stack?

  • Has the product been a good partner in doing business?: 8.3/10 (Category avg: 9.0/10)
  • Dashboards: 9.0/10 (Category avg: 9.0/10)
  • Steps to Answer: 8.3/10 (Category avg: 8.6/10)
  • Formats: 8.7/10 (Category avg: 8.6/10)

Who Is the Company Behind Elastic Stack?

  • Seller: Elastic
  • Year Founded: 2012
  • HQ Location: San Francisco, CA
  • LinkedIn® Page: www.linkedin.com
    10,457 employees on LinkedIn®
  • Ownership: NYSE: ESTC

Who Uses This Product?

  • Who Uses This: Software Engineer, Senior Software Engineer
  • Top Industries: Information Technology and Services, Computer Software
  • Company Size: 46% Medium, 35% Large

What Do G2 Reviewers Say About Elastic Stack?

AI-generated summary from verified user reviews

Pros
  • Users value the ease of use of Elastic Stack, simplifying real-time monitoring and analysis across diverse systems.
  • Users appreciate the flexibility of Elastic Stack, enabling customization and integration with various tools and formats.
  • Users value the unified log management of Elastic Stack, enabling quick issue correlation and comprehensive system insights.
  • Users appreciate the search efficiency of Elastic Stack, enabling quick issue correlation and insightful system behavior analysis.
  • Users appreciate the versatility of Elastic Stack, allowing seamless integration and customization across various deployment models and data types.
Cons
  • Users find that resource management challenges in Elastic Stack require extensive expertise and ongoing attention to maintain performance.
  • Users find the complexity issues of Elastic Stack challenging, requiring expertise for optimal management and performance.
  • Users find the Elastic Stack to be expensive at scale, especially due to high resource and licensing costs.
  • Users report that Elastic Stack's high memory usage can lead to increased costs and requires extensive resources at scale.
  • Users find the learning curve steep for Elastic Stack, requiring significant expertise for optimal performance and management.

What Are Recent G2 Reviews of Elastic Stack?

What Are G2 Users Discussing About Elastic Stack?

Drivetrain

Drivetrain is an AI-native business planning platform that does the work. Mid-market and enterprise finance teams choose Drivetrain when they need a financial planning and analysis software that scales with complexity while remaining intuitive for users. Finance teams use Drivetrain to support core FP&A workflows such as 3-statement modeling, board and investor reporting, headcount and workforce planning, sales planning, cash flow and revenue forecasting, scenario modeling, budgeting, and variance analysis. By unifying these use cases into a single platform, finance leaders plan with greater accuracy, collaborate more effectively, and deliver timely insights for better decision-making. Drivetrain natively integrates with 800+ business systems including Salesforce, NetSuite, QuickBooks, Xero, Hubspot, Salesforce, Rippling, Excel and Looker. These integrations create a single source of truth that reduces manual data preparation and reconciliation. The platform supports flexible, multi-dimensional modeling. And, these models can be built using plain-English formulas, allowing finance teams to handle complexity without relying on rigid templates or specialized technical expertise. Drivetrain also has intuitive reporting and visualization capabilities, combining drag-and-drop report building with charts and dashboards for clear communication of performance. Robust role-based access controls allow finance leaders to manage permissions at a granular level, ensuring stakeholders receive secure, relevant access to metrics, models, and reports. AI is embedded throughout the platform to support data transformation, anomaly detection, model building, insight generation, and more. These capabilities help automate manual work so that finance teams can focus on analysis and decision-making. Finance teams in more than 20 countries and 13 verticals use Drivetrain for their FP&A needs. Customers include category-leading companies such as Postman, Javvy Coffee, Graham Allen, Matillion, Spinnaker Support, and Jumia Group.

Average Rating: 4.7/5.0

Total Reviews: 146

How Do G2 Users Rate Drivetrain?

  • Has the product been a good partner in doing business?: 9.7/10 (Category avg: 9.0/10)
  • Dashboards: 10.0/10 (Category avg: 9.0/10)
  • Steps to Answer: 10.0/10 (Category avg: 8.6/10)
  • Formats: 10.0/10 (Category avg: 8.6/10)

Who Is the Company Behind Drivetrain?

  • Seller: Drivetrain
  • Company Website:
  • Year Founded: 2021
  • HQ Location: Sunnyvale, US
  • LinkedIn® Page: in.linkedin.com
    110 employees on LinkedIn®

Who Uses This Product?

  • Who Uses This: CFO, Finance Manager
  • Top Industries: Computer Software, Information Technology and Services
  • Company Size: 79% Medium, 18% Small

What Do G2 Reviewers Say About Drivetrain?

AI-generated summary from verified user reviews

Pros
  • Users find Drivetrain exceptionally easy to use, with intuitive features that streamline workflows and enhance collaboration.
  • Users find Drivetrain's report creation capabilities essential for streamlining financial reporting and enhancing collaboration.
  • Users appreciate the reporting efficiency of Drivetrain, streamlining financial processes and enhancing productivity significantly.
  • Users commend the exceptional customer support and expertise of Drivetrain's team, ensuring smooth implementation and ongoing assistance.
  • Users value the easy integrations of Drivetrain, enabling seamless connections with various systems for real-time insights.
Cons
  • Users note a significant learning curve with Drivetrain, making model building more complex than traditional spreadsheets.
  • Users note the lack of advanced modeling features and poor documentation, leading to a challenging learning experience.
  • Users face a notable learning difficulty due to the different logic in building models compared to traditional spreadsheets.
  • Users face a steep learning curve with Drivetrain, complicating model structuring compared to traditional spreadsheets.
  • Users face a difficult learning curve with Drivetrain's advanced features, requiring time and guidance for effective use.

What Are Recent G2 Reviews of Drivetrain?

Omni Analytics

Omni is the AI analytics platform that helps Condé Nast, Guitar Center, and dbt Labs accelerate AI adoption, improve self-service, and embed AI analytics into their products. Powered by a governed semantic layer, Omni grounds AI in your business metrics and logic to deliver accurate, contextual insights. Users explore data with AI, spreadsheets, SQL, or a point-and-click UI to receive trustworthy, enterprise-grade intelligence across workflows. Every team moves faster: analysts focus on strategy, stakeholders get reliable answers, and product teams build smarter applications. We build our product fast and in the open, with new features releasing every week. You can follow along by watching our public engineering demos at: omni.co/demos To learn more about how companies like BuzzFeed, Synthesia, and Heidi use Omni, check out: omni.co/customer-case-studies

Average Rating: 4.8/5.0

Total Reviews: 74

How Do G2 Users Rate Omni Analytics?

  • Has the product been a good partner in doing business?: 9.9/10 (Category avg: 9.0/10)
  • Dashboards: 9.0/10 (Category avg: 9.0/10)
  • Steps to Answer: 8.9/10 (Category avg: 8.6/10)
  • Formats: 8.8/10 (Category avg: 8.6/10)

Who Is the Company Behind Omni Analytics?

Who Uses This Product?

  • Top Industries: Computer Software, Information Technology and Services
  • Company Size: 45% Medium, 41% Small

What Do G2 Reviewers Say About Omni Analytics?

AI-generated summary from verified user reviews

Pros
  • Users value the ease of use of Omni Analytics, facilitating quick data exploration and dashboard creation for everyone.
  • Users value the responsive and helpful customer support from Omni Analytics, enhancing their overall experience and efficiency.
  • Users value the easy integrations of Omni Analytics, facilitating quick connections with the entire modern data stack.
  • Users praise the innovation in Omni Analytics, highlighting its user-friendly design and rapid insights delivery.
  • Users love the intuitive data visualization features of Omni Analytics, making dashboard creation and data exploration effortless.
Cons
  • Users identify the need for missing features in Omni Analytics, particularly in topic setup and scheduling enhancements.
  • Users find a small learning curve with Omni Analytics, particularly regarding the complexity of topics and documentation.
  • Users note the limited features of Omni Analytics compared to established tools, affecting overall satisfaction.
  • Users note that complex data modeling in Omni Analytics can be improved for better navigation and stability.
  • Users find the difficult setup of topics in Omni Analytics challenging, impacting their overall user experience.

What Are Recent G2 Reviews of Omni Analytics?

Sisense

Sisense is an API-first analytics platform that modernizes businesses by seamlessly integrating in-context analytics within applications, leading to action-oriented insights that enhance decision intelligence.

Average Rating: 4.2/5.0

Total Reviews: 1,010

How Do G2 Users Rate Sisense?

  • Has the product been a good partner in doing business?: 8.7/10 (Category avg: 9.0/10)
  • Dashboards: 7.9/10 (Category avg: 9.0/10)
  • Steps to Answer: 6.7/10 (Category avg: 8.6/10)
  • Formats: 7.7/10 (Category avg: 8.6/10)

Who Is the Company Behind Sisense?

  • Seller: Sisense, Inc.
  • Company Website:
  • Year Founded: 2004
  • HQ Location: New York
  • LinkedIn® Page: www.linkedin.com
    534 employees on LinkedIn®

Who Uses This Product?

  • Who Uses This: Data Analyst, Product Manager
  • Top Industries: Information Technology and Services, Computer Software
  • Company Size: 57% Medium, 24% Small

What Do G2 Reviewers Say About Sisense?

AI-generated summary from verified user reviews

Pros
  • Users appreciate the ease of use of Sisense, thanks to its intuitive design and helpful documentation.
  • Users appreciate the data visualization capabilities of Sisense, creating clear and interactive dashboards from complex data sources.
  • Users value the seamless integrations in Sisense, enabling efficient data management and enhanced reporting capabilities.
  • Users commend the quick and helpful customer support of Sisense, enhancing their overall experience with the tool.
  • Users appreciate the dashboard customization in Sisense, enhancing their ability to create tailored and insightful visual presentations.
Cons
  • Users find a significant learning curve with Sisense, requiring time and training to achieve proficiency.
  • Users note missing features in Sisense, including limited transformation options and a lacking query builder.
  • Users report a massive security breach and poor support, requiring significant effort for issue resolution.
  • Users struggle with dashboard issues, finding the UI unhelpful and time-consuming for efficient data presentation.
  • Users find Sisense has limited customization, making it challenging for non-technical users to create tailored dashboards.

What Are Recent G2 Reviews of Sisense?

What Are G2 Users Discussing About Sisense?

SAP Analytics Cloud

With the SAP Analytics Cloud solution, you can bring together analytics and planning with unique integration to SAP applications and smooth access to heterogenous data sources. As the analytics and planning solution within SAP Business Technology Platform, SAP Analytics Cloud supports trusted insights and integrated planning processes enterprise-wide to help you make decisions without doubt.

Average Rating: 4.2/5.0

Total Reviews: 763

How Do G2 Users Rate SAP Analytics Cloud?

  • Has the product been a good partner in doing business?: 8.3/10 (Category avg: 9.0/10)
  • Dashboards: 8.7/10 (Category avg: 9.0/10)
  • Steps to Answer: 7.9/10 (Category avg: 8.6/10)
  • Formats: 8.7/10 (Category avg: 8.6/10)

Who Is the Company Behind SAP Analytics Cloud?

  • Seller: SAP
  • Year Founded: 1972
  • HQ Location: Walldorf
  • LinkedIn® Page: www.linkedin.com
    149,349 employees on LinkedIn®
  • Ownership: NYSE:SAP
  • Phone: +1 (800) 872-1727

Who Uses This Product?

  • Who Uses This: Senior Consultant, Consultant
  • Top Industries: Information Technology and Services, Computer Software
  • Company Size: 48% Large, 28% Medium

What Do G2 Reviewers Say About SAP Analytics Cloud?

AI-generated summary from verified user reviews

Pros
  • Users value the ease of use of SAP Analytics Cloud, facilitating smooth training and effective data management.
  • Users value the integrated data analysis capabilities of SAP Analytics Cloud for seamless reporting and real-time insights.
  • Users appreciate the clean and effective data visualizations in SAP Analytics Cloud that enhance storytelling and reporting.
  • Users value the easy integrations of SAP Analytics Cloud, enhancing data flow and streamlining dashboard creation across teams.
  • Users value the integrated platform of SAP Analytics Cloud, combining BI, planning, and predictive analytics seamlessly.
Cons
  • Users experience slow performance during uploads and when handling large datasets, affecting usability and efficiency.
  • Users find the learning curve steep for SAP Analytics Cloud, particularly for non-technical users needing extra training.
  • Users find the learning difficulty high for SAP Analytics Cloud, requiring technical knowledge and external support for setup.
  • Users often experience performance issues, particularly with slow load times and complexity when handling large datasets.
  • Users often face performance lags with large datasets, making their experience less efficient and frustrating.

What Are Recent G2 Reviews of SAP Analytics Cloud?

What Are G2 Users Discussing About SAP Analytics Cloud?

Pigment

Pigment is an AI business planning and performance management platform. Built for the complexity of modern enterprises, Pigment combines dynamic modeling with autonomous AI agents and an intuitive UX, to help teams make intelligent decisions with speed and clarity. Across finance, sales, supply chain, and other business functions, teams at companies like Unilever, Snowflake, Siemens, and Anthropic use Pigment every day to anticipate change, plan ahead, and act with confidence.

Average Rating: 4.6/5.0

Total Reviews: 124

How Do G2 Users Rate Pigment?

  • Has the product been a good partner in doing business?: 9.5/10 (Category avg: 9.0/10)
  • Dashboards: 8.8/10 (Category avg: 9.0/10)
  • Steps to Answer: 8.6/10 (Category avg: 8.6/10)
  • Formats: 7.5/10 (Category avg: 8.6/10)

Who Is the Company Behind Pigment?

  • Seller: Pigment
  • Company Website:
  • Year Founded: 2019
  • HQ Location: Paris, FR
  • LinkedIn® Page: www.linkedin.com
    773 employees on LinkedIn®

Who Uses This Product?

  • Who Uses This: FP&A Manager
  • Top Industries: Computer Software, Information Technology and Services
  • Company Size: 71% Medium, 21% Large

What Do G2 Reviewers Say About Pigment?

AI-generated summary from verified user reviews

Pros
  • Users praise the flexibility of Pigment, enabling seamless adjustments and tailored financial planning as needs evolve.
  • Users love the flexibility and AI features in Pigment, enhancing planning and reporting capabilities effectively.
  • Users commend the stellar customer support from Pigment, enhancing their experience and ensuring seamless implementations.
  • Users appreciate the ease of use of Pigment, allowing for quick setup and effective collaboration in financial planning.
  • Users praise Pigment for its powerful automation, seamlessly integrating data and enhancing forecasting capabilities with minimal errors.
Cons
  • Users experience data inaccuracy due to missing fields for reporting, causing bottlenecks for analysts and report builders.
  • Users find the formulas and calculations complicated, impacting their ability to efficiently use Pigment.
  • Users find the setup process complex, noting complicated formulas and a lack of easy API management options.
  • Users face connectivity issues with Pigment, often experiencing slow calculations and performance challenges on large datasets.
  • Users find the formula limitations somewhat tricky, complicating calculations and slowing down forecasts.

What Are Recent G2 Reviews of Pigment?

Grow.com

Grow is a no-code full-stack business intelligence (BI) platform that empowers everyone in your organization to make data-driven decisions. By combining ETL, data warehousing and visualization in one easy-to-use platform, any organization can connect and explore its data to surface insights. Our unlimited-user license model gives everyone access to the answers they need without waiting in line for an analyst. Now everyone can make great decisions in real-time to accelerate their growth.

Average Rating: 4.3/5.0

Total Reviews: 275

How Do G2 Users Rate Grow.com?

  • Has the product been a good partner in doing business?: 8.8/10 (Category avg: 9.0/10)
  • Dashboards: 8.8/10 (Category avg: 9.0/10)
  • Steps to Answer: 7.9/10 (Category avg: 8.6/10)
  • Formats: 8.0/10 (Category avg: 8.6/10)

Who Is the Company Behind Grow.com?

  • Seller: Epicor
  • Company Website:
  • Year Founded: 1972
  • HQ Location: Austin, TX
  • LinkedIn® Page: www.linkedin.com
    6,161 employees on LinkedIn®

Who Uses This Product?

  • Who Uses This: Data Analyst, Account Manager
  • Top Industries: Marketing and Advertising, Computer Software
  • Company Size: 64% Small, 34% Medium

What Do G2 Reviewers Say About Grow.com?

AI-generated summary from verified user reviews

Pros
  • Users appreciate the ease of use of Grow.com, enabling quick data access and insightful analysis for all skill levels.
  • Users appreciate the intuitive dashboards of Grow.com, enabling seamless data visualization and reporting for all team members.
  • Users value the easy integrations of Grow.com, seamlessly connecting multiple data sources for streamlined reporting and insights.
  • Users love the intuitive and visually appealing interface of Grow.com, simplifying data analysis for everyone.
  • Users value the seamless integrations of Grow.com, allowing easy access to consolidated data insights and metrics.
Cons
  • Users find Grow.com to be expensive, especially for small businesses, impacting overall accessibility and usability.
  • Users experience missing features like offline support and flexible data transformation, impacting overall efficiency and performance.
  • Users experience slow loading times, especially when connecting data sources and handling large datasets, affecting usability.
  • Users experience slow performance with Grow.com, particularly during data loading and updating processes.
  • Users experience performance issues with Grow.com, particularly with data syncing and complex dashboard handling.

What Are Recent G2 Reviews of Grow.com?

What Are G2 Users Discussing About Grow.com?

Visme

Visme is the operating system for business content, the platform teams use to create, manage, and scale everything their business communicates with, from presentations and reports to infographics, documents, and social graphics. Where most AI creates from a blank prompt, Visme works from what your business already knows. Connect your Drive, OneDrive, SharePoint, and existing decks, and Visme reads them, structures them, and learns your brand, voice, and key facts. Every new piece is held to that brand standard automatically, with the right fonts, colors, logos, and tone applied without anyone enforcing them manually. Visme's AI is grounded in your brand, your content, and your data rather than a generic prompt, so what it produces reads like your company instead of off-the-shelf output. From that foundation, Visme can build on-brand Sales Decks, QBRs, and Proposals from your own content, pull live data from Salesforce, Google Sheets, and Excel, and update a fact once so it carries across every piece built from it. Visme is built for the teams that produce recurring customer-facing content: sales, customer success, marketing, and revenue operations. Real-time collaboration keeps distributed teams working in one place, and Smart Link sharing shows how content performs after it is sent. The outcome is one system the whole company creates from, consistent, current, and built on what your team already has, so the people accountable for the brand can hold the standard without reviewing every piece.

Average Rating: 4.5/5.0

Total Reviews: 498

How Do G2 Users Rate Visme?

  • Has the product been a good partner in doing business?: 9.2/10 (Category avg: 9.0/10)
  • Dashboards: 8.6/10 (Category avg: 9.0/10)
  • Steps to Answer: 7.8/10 (Category avg: 8.6/10)
  • Formats: 8.8/10 (Category avg: 8.6/10)

Who Is the Company Behind Visme?

  • Seller: Visme
  • Company Website:
  • Year Founded: 2014
  • HQ Location: Rockville, Maryland
  • LinkedIn® Page: www.linkedin.com
    89 employees on LinkedIn®

Who Uses This Product?

  • Who Uses This: CEO, Founder
  • Top Industries: Marketing and Advertising, Education Management
  • Company Size: 70% Small, 24% Medium

What Do G2 Reviewers Say About Visme?

AI-generated summary from verified user reviews

Pros
  • Users appreciate the ease of use of Visme, finding it perfect for creating polished visuals effortlessly.
  • Users appreciate the user-friendly interface and beautiful templates that enhance their projects and creativity.
  • Users love the extensive selection of beautiful templates in Visme, enhancing their professional and polished presentations effortlessly.
  • Users praise Visme for its intuitive design and user-friendly features, making graphic creation quick and polished.
  • Users love the easy-to-use interface of Visme, making document creation and chart design straightforward and polished.
Cons
  • Users find Visme's limited features restrict collaborative efforts and necessary tools for comprehensive project management.
  • Users find the missing features in Visme limiting, especially regarding collaboration and mobile functionality.
  • Users experience limited editing capabilities in Visme, hindering their ability to efficiently modify presentations and collaborate.
  • Users find limited options frustrating, especially when seeking specific formatting and features within Visme.
  • Users find Visme expensive for individual use, with additional fees and limited collaboration features adding to the cost.

What Are Recent G2 Reviews of Visme?

What Are G2 Users Discussing About Visme?

Count

AI makes things up. A made-up fact or an unsupported conclusion can damage a decision, a stakeholder or a reputation. Count is a collaborative platform for AI-powered analytics and research where every answer earns your trust. Count’s Reasoning Chains show the thinking, evidence and sources under every claim an AI makes. Each claim is labelled as a Citation, Assumption, Model knowledge, Judgement, Guesswork or Hallucination, so you can see which ones need checking before they reach a decision. Teams use the AI they already have, including Claude, ChatGPT and any MCP client, and audit its answers in Count. They connect BigQuery, Snowflake, Postgres, dbt and their own files, and check the work together on one canvas in real time. Viewers are free. Count is SOC 2 compliant, with SSO, SCIM and EU/US data residency on Enterprise. Start free.

Average Rating: 4.8/5.0

Total Reviews: 104

How Do G2 Users Rate Count?

  • Has the product been a good partner in doing business?: 9.5/10 (Category avg: 9.0/10)
  • Dashboards: 9.4/10 (Category avg: 9.0/10)
  • Steps to Answer: 9.6/10 (Category avg: 8.6/10)
  • Formats: 9.6/10 (Category avg: 8.6/10)

Who Is the Company Behind Count?

Who Uses This Product?

  • Who Uses This: Data Analyst, Analytics Engineer
  • Top Industries: Financial Services, Information Technology and Services
  • Company Size: 78% Medium, 10% Large

What Do G2 Reviewers Say About Count?

AI-generated summary from verified user reviews

Pros
  • Users love the team collaboration features in Count, enhancing their workflow and streamlining communication effectively.
  • Users appreciate the ease of use of Count, enabling quick data integration and understanding without technical expertise.
  • Users appreciate the excellent customer support from Count, finding the team consistently helpful and responsive to feedback.
  • Users appreciate the flexibility of Count, seamlessly integrating data sources into user-friendly, customizable dashboards.
  • Users love the intuitive data visualizations in Count, enabling easy exploration and collaboration on data insights.
Cons
  • Users mention a learning curve that can initially hinder getting the full value from Count, but it's manageable.
  • Users experience slow performance with Count, especially with large datasets, leading to frustration during usage.
  • Users note the limited customization options in Count, hindering advanced tailored use cases and requiring additional support.
  • Users find Count has missing features, limiting its usability compared to more comprehensive BI tools like Tableau.
  • Users experience layout issues that can lead to confusion and performance lag when managing multiple data visualizations.

What Are Recent G2 Reviews of Count?

Abacum

Abacum is an AI-native Financial Planning and Analysis (FP&A) platform designed to enhance business performance through clarity, speed, and impactful decision-making. This innovative solution provides users with instant access to essential operational and financial key performance indicators (KPIs) all in one centralized location. With just a single click, users can automate management reporting, forecast revenue, plan headcount, budget operational expenditures (OPEX), and run multiple scenarios, all seamlessly integrated within the Abacum environment. Targeted primarily at mid-market companies, Abacum caters to finance teams seeking a robust yet user-friendly solution for their planning and analysis needs. The platform stands out by combining intuitive workflows with enterprise-grade flexibility, allowing users to create collaborative plans, analyze performance in real time, and share valuable insights that drive business progress. Its ability to integrate with over 700 systems, including ERP, CRM, HRIS, and data warehouses, ensures that all data is automatically synced, cleaned, structured, and consistently up to date, thus eliminating the need for manual data handling. One of the key features of Abacum is its multi-dimensional modeling engine, which empowers finance teams to conduct complex analyses and scenario planning with ease. This capability, coupled with collaborative workflows, facilitates seamless business partnering across various functions within an organization. As a result, finance teams can plan and report up to 75% faster, significantly improving efficiency and allowing them to focus on strategic initiatives rather than time-consuming manual processes. Abacum is designed to support fast-growing companies and industry leaders, including names such as Strava, Dish Networks, JG Wentworth, BetterUp, Factorial, Kajabi, Abridge, and Aiven. By providing a scalable FP&A solution that balances power with simplicity, Abacum enables organizations to navigate the complexities of financial planning and analysis confidently.

Average Rating: 4.7/5.0

Total Reviews: 173

How Do G2 Users Rate Abacum?

  • Has the product been a good partner in doing business?: 9.4/10 (Category avg: 9.0/10)
  • Dashboards: 9.2/10 (Category avg: 9.0/10)
  • Steps to Answer: 8.5/10 (Category avg: 8.6/10)
  • Formats: 8.7/10 (Category avg: 8.6/10)

Who Is the Company Behind Abacum?

  • Seller: Abacum
  • Company Website:
  • Year Founded: 2020
  • HQ Location: New York, US
  • LinkedIn® Page: www.linkedin.com
    182 employees on LinkedIn®

Who Uses This Product?

  • Who Uses This: CFO, Head of Finance
  • Top Industries: Computer Software, Financial Services
  • Company Size: 85% Medium, 9% Small

What Do G2 Reviewers Say About Abacum?

AI-generated summary from verified user reviews

Pros
  • Users appreciate the responsive customer support of Abacum, enhancing financial planning through proactive communication and assistance.
  • Users find Abacum's ease of use remarkable, facilitating quick financial planning and collaboration across teams.
  • Users appreciate fast, collaborative financial planning with Abacum, simplifying processes for both finance and non-finance teams.
  • Users commend the implementation ease of Abacum, highlighting a smooth setup supported by excellent guidance and responsive teams.
  • Users highlight Abacum's exceptional flexibility, effortlessly adapting to complex data analysis and integrating into daily operations.
Cons
  • Users face a significant learning difficulty due to advanced features and the need for meticulous management of AI classifiers.
  • Users find the missing features in Abacum make some tasks cumbersome and slow, impacting overall efficiency.
  • Users find that the complex setup can complicate performance, requiring careful management of variables during implementation.
  • Users face a steep learning curve particularly during setup, but guidance from support teams helps ease the process.
  • Users face a steep learning curve with Abacum, especially for advanced features and initial setup processes.

What Are Recent G2 Reviews of Abacum?

What Are G2 Users Discussing About Abacum?

Infogram

Infogram is a data visualization company that helps people create infographics, reports, dashboards, maps, charts and social media assets. We show people how to communicate with data in a clear and engaging way. Launched in 2012, Infogram rapidly became the web’s favorite data visualization tool thanks to its simplicity, functionality and strong design aesthetic. We serve a wide range of customers including marketers, educators, journalists, consultants, and business professionals. We support people who see data as a powerful communication tool when visualized effectively. Infogram is used and loved by millions of people around the globe

Average Rating: 4.7/5.0

Total Reviews: 178

How Do G2 Users Rate Infogram?

  • Has the product been a good partner in doing business?: 9.0/10 (Category avg: 9.0/10)
  • Dashboards: 9.2/10 (Category avg: 9.0/10)
  • Steps to Answer: 8.4/10 (Category avg: 8.6/10)
  • Formats: 9.3/10 (Category avg: 8.6/10)

Who Is the Company Behind Infogram?

  • Seller: Prezi
  • Year Founded: 2009
  • HQ Location: Oakland, California
  • LinkedIn® Page: www.linkedin.com
    202 employees on LinkedIn®

Who Uses This Product?

  • Top Industries: Education Management, Marketing and Advertising
  • Company Size: 51% Small, 31% Medium

What Do G2 Reviewers Say About Infogram?

AI-generated summary from verified user reviews

Pros
  • Users appreciate the ease of use of Infogram, making data visualization quick and efficient for various tasks.
  • Users commend the easy visualization and variety of graph types in Infogram, enhancing their interactive graphic creation experience.
  • Users value the AI integration in Infogram, finding data upload and chart suggestions highly beneficial for efficiency.
  • Users find automation features in Infogram to significantly enhance their productivity and streamline data-related tasks.
  • Users appreciate the exceptional customer satisfaction with Infogram, highlighting efficient support and smooth payment processes.
Cons
  • Users experience poor visualization with Infogram, noting occasional glitches and inconsistent AI graph outputs.
  • Users desire more free templates in Infogram, feeling limited by the current selection available.

What Are Recent G2 Reviews of Infogram?

What Are G2 Users Discussing About Infogram?

Bijou Barry
BB
Researched and written by Bijou Barry
Updated