Best Analytics Platforms for Small Business

How Many Analytics Platforms Products Does G2 Track?

Total Products under this Category: 603

Category Stats (Sep 2026)

  • Average Rating: 4.51/5 (↑0.01 vs Aug 2026) The average rating of products in this category, based on all submitted ratings
  • Top Trending Product: BlazeSQL (+2.75%) - Among all products in this category, BlazeSQL recorded the largest rating increase compared to last month

Last updated: September 01, 2026

How Does G2 Rank Analytics Platforms Products?

Why You Can Trust G2's Software Rankings:

  • 30 Analysts and Data Experts
  • 29,100+ Authentic Reviews
  • 603+ Products
  • Unbiased Rankings

G2's software rankings are built on verified user reviews, rigorous moderation, and a consistent research methodology maintained by a team of analysts and data experts. Each product is measured using the same transparent criteria, with no paid placement or vendor influence. While reviews reflect real user experiences, which can be subjective, they offer valuable insight into how software performs in the hands of professionals. Together, these inputs power the G2 Score, a standardized way to compare tools within every category.

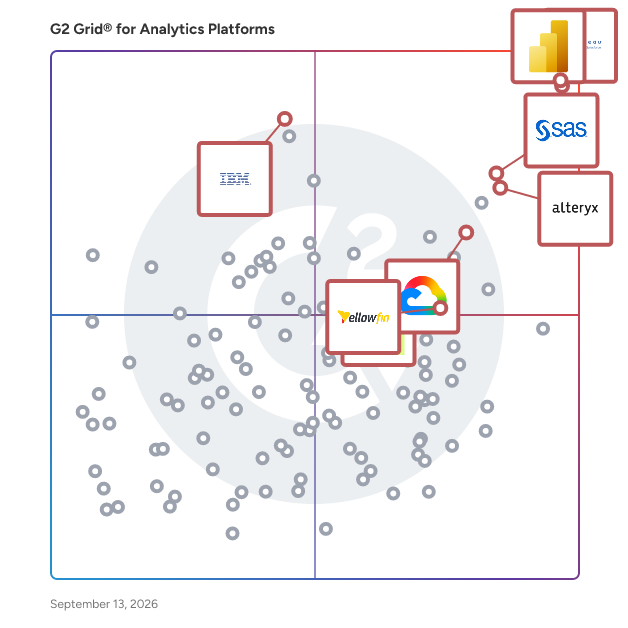
G2 Grid® for Analytics Platforms

G2 Grid® for Analytics Platforms plotting products by satisfaction and market presence

Highlighted products: Tableau, Microsoft Power BI, SAS Viya, Alteryx, GoodData.AI, Yellowfin BI, IBM Cognos Analytics, and Looker.

Underlying data: [Grid® JSON](https://www.g2.com/categories/analytics-platforms/grids.json?focus%5B%5D=tableau&focus%5B%5D=microsoft-microsoft-power-bi&focus%5B%5D=sas-sas-viya&focus%5B%5D=alteryx&focus%5B%5D=gooddata-ai&focus%5B%5D=yellowfin-bi&focus%5B%5D=ibm-cognos-analytics&focus%5B%5D=looker&segment=small-business)

Tableau

Tableau is the world’s leading AI-powered analytics platform. Whether you are a business user or an analyst, Tableau turns trusted data into actionable insights. With our flexible, interoperable platform, you can: Turn data into action at scale with human and agent collaboration. Tableau Next delivers agentic AI for faster data-insight-action workflows. It surfaces insights, provides proactive recommendations, and helps you take action in the flow of work. Scale data-driven insights with complete operational confidence. Tableau Cloud enables fully managed analytics at scale. It accelerates your time to value and gives you access to the latest AI-powered innovations. Deploy visual, self-service analytics with unmatched control and flexibility. Tableau Server meets your organization's governance and security needs. It provides enterprise-grade, self-service analytics on-premise or in your private cloud.

Average Rating: 4.4/5.0

Total Reviews: 3,709

How Do G2 Users Rate Tableau?

  • Has the product been a good partner in doing business?: 8.6/10 (Category avg: 9.2/10)
  • Steps to Answer: 8.3/10 (Category avg: 8.4/10)
  • Reports Interface: 8.7/10 (Category avg: 8.8/10)
  • Calculated Fields: 8.5/10 (Category avg: 8.5/10)

Who Is the Company Behind Tableau?

  • Seller: Salesforce
  • Company Website:
  • Year Founded: 1999
  • HQ Location: San Francisco, CA
  • Twitter: @salesforce
    579,511 Twitter followers
  • LinkedIn® Page: www.linkedin.com
    89,711 employees on LinkedIn®

Who Uses This Product?

  • Who Uses This: Data Analyst, Business Analyst
  • Top Industries: Information Technology and Services, Computer Software
  • Company Size: 41% Large, 36% Medium

What Do G2 Reviewers Say About Tableau?

AI-generated summary from verified user reviews

Pros
  • Users highlight the ease of use of Tableau, simplifying data visualization and integration for effective decision-making.
  • Users value the ease of creating interactive visualizations with Tableau, simplifying data analysis from multiple sources.
  • Users love the intuitive and powerful visualization capabilities of Tableau, enabling clear insights from complex data.
  • Users appreciate the ease of use and powerful visualization features of Tableau, streamlining data presentation and analysis.
  • Users find Tableau's intuitive design exceptional, enabling effortless data visualization and interactive dashboards for effective reporting.
Cons
  • Users find the learning curve steep, complicating the onboarding process and integration with Salesforce.
  • Users find learning Tableau challenging, particularly due to its complexity and difficulties in collaboration and calculations.
  • Users find Tableau expensive, with costs complicating its value in large organizations and advanced functionalities.
  • Users experience slow performance with large datasets and lengthy data refresh processes, leading to frustration.
  • Users find Tableau's onboarding complex, making simple tasks unnecessarily complicated and challenging to switch from MS products.

What Are Recent G2 Reviews of Tableau?

What Are G2 Users Discussing About Tableau?

Microsoft Power BI

Power BI Desktop puts visual analytics at your fingertips. With this powerful authoring tool, you can create interactive data visualizations and reports. Connect, mash up, model, and visualize your data. Place visuals exactly where you want them, analyze and explore your data, and share content with others by publishing to the Power BI web service. Power BI Desktop is part of the Power BI product suite. To monitor key data and share dashboards and reports, use the Power BI web service. To view and interact with your data on any mobile device, get the Power BI Mobile app on the AppStore, Google Play or the Microsoft Store. To embed stunning, fully interactive reports and visuals into your applications use Power BI Embedded.

Average Rating: 4.5/5.0

Total Reviews: 1,603

How Do G2 Users Rate Microsoft Power BI?

  • Has the product been a good partner in doing business?: 8.8/10 (Category avg: 9.2/10)
  • Steps to Answer: 8.4/10 (Category avg: 8.4/10)
  • Reports Interface: 8.9/10 (Category avg: 8.8/10)
  • Calculated Fields: 8.6/10 (Category avg: 8.5/10)

Who Is the Company Behind Microsoft Power BI?

  • Seller: Microsoft
  • Year Founded: 1975
  • HQ Location: Redmond, Washington
  • Twitter: @microsoft
    13,091,739 Twitter followers
  • LinkedIn® Page: www.linkedin.com
    232,750 employees on LinkedIn®
  • Ownership: MSFT

Who Uses This Product?

  • Who Uses This: Data Analyst, Software Engineer
  • Top Industries: Information Technology and Services, Computer Software
  • Company Size: 42% Large, 38% Medium

What Do G2 Reviewers Say About Microsoft Power BI?

AI-generated summary from verified user reviews

Pros
  • Users appreciate the ease of use of Microsoft Power BI, allowing accessible data analysis for everyone.
  • Users find Power BI’s data visualization capabilities excellent for creating customized reports and dashboards quickly.
  • Users value the seamless integrations of Power BI, enabling efficient data connectivity and enhanced organizational analysis.
  • Users praise the powerful data analytics and visualization capabilities of Microsoft Power BI for insightful reporting.
  • Users love the powerful charting features in Power BI, enabling easy data visualization and report creation.
Cons
  • Users find the learning curve steep for Power BI, especially for beginners trying to connect data sources effectively.
  • Users find the slow performance of Power BI frustrating, especially when handling large datasets without optimization.
  • Users face performance issues with Power BI, especially regarding DAX queries and handling large data volumes, causing frustration.
  • Users often find data modeling complexities in Power BI challenging, leading to a steep learning curve and performance issues.
  • Users find the limited customization options in Power BI frustrating, constraining their ability to present data effectively.

What Are Recent G2 Reviews of Microsoft Power BI?

What Are G2 Users Discussing About Microsoft Power BI?

SAS Viya

SAS Viya is a cloud-native data and AI platform that enables teams to build, deploy and scale explainable AI that drives trusted, confident decisions. It unites the entire data and AI life cycle and empowers teams to innovate quickly while balancing speed, automation and governance by design. Viya unifies data management, advanced analytics and decisioning in a single platform, so organizations can move from experimentation to production with confidence, delivering measurable business impact that is secure, explainable and scalable across any environment. Key capabilities required to deliver trusted decisions include: • End-to-end clarity across the data and AI life cycle, with built-in lineage, auditability and continuous monitoring to support defensible decisions. • Governance by design, enabling consistent oversight across data, models and decisions to reduce risk and accelerate adoption. • Explainable AI at scale, so insights and outcomes can be understood, validated and trusted by business and regulators alike. • Operationalized analytics, ensuring value continues beyond deployment through monitoring, retraining and life cycle management. • Flexible, cloud-native deployment, allowing organizations to start anywhere and scale everywhere while maintaining control.

Average Rating: 4.3/5.0

Total Reviews: 775

How Do G2 Users Rate SAS Viya?

  • Has the product been a good partner in doing business?: 8.2/10 (Category avg: 9.2/10)
  • Steps to Answer: 8.1/10 (Category avg: 8.4/10)
  • Reports Interface: 8.5/10 (Category avg: 8.8/10)
  • Calculated Fields: 8.3/10 (Category avg: 8.5/10)

Who Is the Company Behind SAS Viya?

  • Seller: SAS Institute Inc.
  • Company Website:
  • Year Founded: 1976
  • HQ Location: Cary, NC
  • Twitter: @SASsoftware
    60,863 Twitter followers
  • LinkedIn® Page: www.linkedin.com
    15,122 employees on LinkedIn®

Who Uses This Product?

  • Who Uses This: Student, Biostatistician
  • Top Industries: Pharmaceuticals, Banking
  • Company Size: 33% Small, 33% Large

What Do G2 Reviewers Say About SAS Viya?

AI-generated summary from verified user reviews

Pros
  • Users value the ease of use in SAS Viya, enhancing data visualization and decision-making for businesses.
  • Users appreciate the advanced analytical capabilities of SAS Viya, making data analysis and decision-making more efficient.
  • Users value the sophisticated analytical capabilities of SAS Viya, enhancing decision-making and insights from diverse data sources.
  • Users value the end-to-end data lifecycle tooling in SAS Viya, enhancing insights and strategic decision-making capabilities.
  • Users value the powerful data visualization capabilities of SAS Viya, enhancing insights and decision-making in their organizations.
Cons
  • Users find SAS Viya difficult for non-technical users to navigate, impacting ease of access to reports and dashboards.
  • Users find the visualization complexity of SAS Viya challenging, especially for those without technical expertise.
  • Users find the learning curve challenging, especially for non-technical individuals navigating reports and dashboards.
  • Users find the difficult learning curve for SAS Viya challenging, especially for non-technical users attempting to access features.
  • Users find the expensive pricing of SAS Viya a potential barrier, complicating their decision-making process.

What Are Recent G2 Reviews of SAS Viya?

What Are G2 Users Discussing About SAS Viya?

Alteryx

Alteryx, through it's Alteryx One platform, helps enterprises transform complex, disconnected data into a clean, AI-ready state. Whether you’re creating financial forecasts, analyzing supplier performance, segmenting customer data, analyzing employee retention, or building competitive AI applications from your proprietary data, Alteryx One makes it easy to cleanse, blend, and analyze data to unlock the unique insights that drive impactful decisions. AI-Guided Analytics Alteryx automates and simplifies every stage of data preparation and analysis, from validation and enrichment to predictive analytics and automated insights. Incorporate generative AI directly into your workflows to streamline complex data tasks and generate insights faster. Unmatched flexibility, whether you prefer code-free workflows, natural language commands, or low-code options, Alteryx adapts to your needs. Trusted. Secure. Enterprise-Ready. Alteryx is trusted by over half of the Global 2000 and 19 of the top 20 global banks. With built-in automation, governance, and security, your workflows can scale and maintain compliance while delivering consistent results. And it doesn’t matter if your systems are on-premises, hybrid, or in the cloud; Alteryx fits effortlessly into your infrastructure. Easy to Use. Deeply Connected. What truly sets Alteryx apart is our focus on efficiency and ease of use for analysts and our active community of 700,000 Alteryx users to support you at every step of your journey. With seamless integration to data everywhere including platforms like Databricks, Snowflake, AWS, Google, SAP, and Salesforce, our platform helps unify siloed data and accelerate getting to insights. Visit Alteryx.com for more information, and to start your free trial.

Average Rating: 4.6/5.0

Total Reviews: 863

How Do G2 Users Rate Alteryx?

  • Has the product been a good partner in doing business?: 8.8/10 (Category avg: 9.2/10)
  • Steps to Answer: 8.6/10 (Category avg: 8.4/10)
  • Reports Interface: 8.0/10 (Category avg: 8.8/10)
  • Calculated Fields: 8.9/10 (Category avg: 8.5/10)

Who Is the Company Behind Alteryx?

  • Seller: Alteryx
  • Company Website:
  • Year Founded: 1997
  • HQ Location: Irvine, CA
  • Twitter: @alteryx
    26,149 Twitter followers
  • LinkedIn® Page: www.linkedin.com
    2,312 employees on LinkedIn®

Who Uses This Product?

  • Who Uses This: Data Analyst, Analyst
  • Top Industries: Financial Services, Accounting
  • Company Size: 63% Large, 21% Medium

What Do G2 Reviewers Say About Alteryx?

AI-generated summary from verified user reviews

Pros
  • Users appreciate the ease of use in Alteryx, finding it simple to automate tasks with drag and drop functionality.
  • Users value the automation capabilities of Alteryx, streamlining data processes and enhancing analytical efficiency.
  • Users find Alteryx to be very intuitive, making it easy for non-technical users to learn and utilize.
  • Users find that Alteryx's interface makes learning technology easy for everyone, even those without a tech background.
  • Users value Alteryx for its efficiency in managing data, streamlining workflows, and enhancing overall productivity.
Cons
  • Users highlight the expensive pricing of Alteryx, making it difficult for small teams or startups to afford licenses.
  • Users face a steep learning curve with Alteryx, requiring time to master its complex features.
  • Users find that Alteryx suffers from missing features, such as lack of direct database access and limited reporting tools.
  • Users find the learning difficulty of Alteryx steep, especially for those unfamiliar with RegEx and SQL.
  • Users experience slow performance with Alteryx, particularly when handling large workflows and during data wrangling tasks.

What Are Recent G2 Reviews of Alteryx?

GoodData.AI

GoodData is the full-stack, AI-native decision intelligence platform that helps businesses turn data into actionable, enterprise-grade insights. Designed for governed, scalable analytics, GoodData enables organizations to build, operationalize, and embed decisions, workflows, and AI agents directly within products and business workflows. The platform combines Analytics as Code, a governed semantic and metrics layer, APIs, SDKs, and open AI interoperability to help teams create composable analytics and AI experiences across products, workflows, and customer environments. From embedded analytics and dashboards to assistants, AI workflows, and interoperable agents, GoodData gives teams the foundation to move from insight to action with governance, performance, and deployment flexibility built in. Today, GoodData serves over 140,000 companies and 3.2 million users worldwide.

Average Rating: 4.3/5.0

Total Reviews: 592

How Do G2 Users Rate GoodData.AI?

  • Has the product been a good partner in doing business?: 8.4/10 (Category avg: 9.2/10)
  • Steps to Answer: 8.3/10 (Category avg: 8.4/10)
  • Reports Interface: 8.6/10 (Category avg: 8.8/10)
  • Calculated Fields: 8.2/10 (Category avg: 8.5/10)

Who Is the Company Behind GoodData.AI?

  • Seller: GoodData.AI
  • Company Website:
  • Year Founded: 2007
  • HQ Location: San Francisco, CA
  • Twitter: @gooddata
    1 Twitter followers
  • LinkedIn® Page: www.linkedin.com
    290 employees on LinkedIn®

Who Uses This Product?

  • Who Uses This: Data Analyst, Product Manager
  • Top Industries: Computer Software, Consumer Services
  • Company Size: 44% Medium, 40% Small

What Do G2 Reviewers Say About GoodData.AI?

AI-generated summary from verified user reviews

Pros
  • Users appreciate the ease of use of GoodData.AI, enabling quick report creation and smooth integration with data systems.
  • Users appreciate the impressive data visualization features of GoodData.AI, enabling clear insights for all users.
  • Users appreciate the seamless integration of GoodData.AI with data sources, enhancing efficiency throughout the data lifecycle.
  • Users find GoodData.AI intuitive and easy to use, enabling quick reporting and data visualization for everyone.
  • Users value the easy integrations of GoodData.AI, enhancing data analysis and streamlining the product lifecycle.
Cons
  • Users experience a steep learning curve with GoodData, making adaptation to business needs challenging and slow.
  • Users find GoodData.AI lacking important features and documentation, making it hard to access insights and data.
  • Users find the learning difficulty with GoodData.AI challenging, particularly in understanding MAQL language and complex data models.
  • Users find GoodData.AI's complexity challenging, especially during setup and when adapting to changing data structures.
  • Users find the limited customization options of GoodData.AI hinder their ability to fully tailor visualizations and reports.

What Are Recent G2 Reviews of GoodData.AI?

Yellowfin BI

Yellowfin is the only analytics suite that successfully combines action based dashboards with industry-leading automated analysis and data storytelling. By delivering the best analytical experience, Yellowfin provides your users with unique ways to engage with and act on their data, and addresses the needs of data analysts, business users, customers and developers who want to build, deploy or use amazing analytical experiences. Analytics for software companies Integrate and embed analytics with a difference into your app, your way * Replace legacy or home grown reporting tools * Embed a modern self-service analytics suite * Deliver an exceptional customer experience Analytics for enterprise Get more value from your data in new and innovative ways * Migrate from spreadsheets to a modern analytics platform * Replace legacy BI applications * Embed analytics into operational workflows Analytical Application Builders Leverage your domain expertise to create data products that delight * Create unique data driven applications * Close the loop on analytics * Deliver insights as a service

Average Rating: 4.4/5.0

Total Reviews: 419

How Do G2 Users Rate Yellowfin BI?

  • Has the product been a good partner in doing business?: 8.9/10 (Category avg: 9.2/10)
  • Steps to Answer: 8.0/10 (Category avg: 8.4/10)
  • Reports Interface: 8.6/10 (Category avg: 8.8/10)
  • Calculated Fields: 8.2/10 (Category avg: 8.5/10)

Who Is the Company Behind Yellowfin BI?

  • Seller: Yellowfin
  • Year Founded: 2003
  • HQ Location: Austin, Texas
  • Twitter: @YellowfinBI
    5,783 Twitter followers
  • LinkedIn® Page: www.linkedin.com
    64 employees on LinkedIn®

Who Uses This Product?

  • Who Uses This: General Manager, Business Analyst
  • Top Industries: Computer Software, Information Technology and Services
  • Company Size: 46% Small, 35% Medium

What Do G2 Reviewers Say About Yellowfin BI?

AI-generated summary from verified user reviews

Pros
  • Users value the user-friendly interface of Yellowfin BI, enabling seamless dashboard creation and data visualization.
  • Users value the user-friendly data visualization capabilities of Yellowfin BI, enabling easy and effective reporting.
  • Users appreciate the intuitive interface of Yellowfin BI, enabling quick setup and easy report creation without technical challenges.
  • Users praise the user-friendly interface of Yellowfin BI, enabling quick dashboard creation and easy data exploration.
  • Users value the quick and easy dashboard customization of Yellowfin BI, enabling rapid and effective data visualization.
Cons
  • Users often experience a steep learning curve with Yellowfin BI, especially for advanced features and customization.
  • Users report challenges with large data handling in Yellowfin BI, noting performance slowdowns and lengthy filter refresh times.
  • Users experience slow performance with large datasets in Yellowfin BI, impacting efficiency and user satisfaction.
  • Users often face performance issues with Yellowfin BI, including slow loading times for large datasets and complex dashboards.
  • Users find limited customization in Yellowfin BI, affecting advanced analytics and the ability to create tailored visualizations.

What Are Recent G2 Reviews of Yellowfin BI?

What Are G2 Users Discussing About Yellowfin BI?

Looker

Looker, Google Cloud’s business intelligence platform, enables you to chat with your data. Organizations turn to Looker for self-service and governed BI, to build custom applications with trusted metrics, or to bring Looker modeling to their existing environment. The result is improved data engineering efficiency and true business transformation.

Average Rating: 4.4/5.0

Total Reviews: 1,589

How Do G2 Users Rate Looker?

  • Has the product been a good partner in doing business?: 8.9/10 (Category avg: 9.2/10)
  • Steps to Answer: 8.2/10 (Category avg: 8.4/10)
  • Reports Interface: 8.6/10 (Category avg: 8.8/10)
  • Calculated Fields: 8.4/10 (Category avg: 8.5/10)

Who Is the Company Behind Looker?

  • Seller: Google
  • Year Founded: 1998
  • HQ Location: Mountain View, CA
  • Twitter: @google
    31,899,995 Twitter followers
  • LinkedIn® Page: www.linkedin.com
    301,144 employees on LinkedIn®
  • Ownership: NASDAQ:GOOG

Who Uses This Product?

  • Who Uses This: Data Analyst, Data Engineer
  • Top Industries: Computer Software, Information Technology and Services
  • Company Size: 60% Medium, 20% Large

What Do G2 Reviewers Say About Looker?

AI-generated summary from verified user reviews

Pros
  • Users love the ease of use of Looker, making report creation simple for those with limited technical skills.
  • Users value the dynamic real-time reporting abilities of Looker, enhancing collaboration and decision-making across digital ad platforms.
  • Users love the easy integrations with various data sources, enhancing their analytics experience on Looker.
  • Users appreciate the seamless integrations with platforms like Salesforce, enhancing functionality and user experience in Looker.
  • Users appreciate the dynamic and real-time reporting capabilities of Looker, enhancing data sharing for digital ads.
Cons
  • Users find Looker's steep learning curve challenging, especially with LookML, making onboarding for beginners difficult.
  • Users find the steep learning curve of Looker challenging, especially for those lacking technical expertise.
  • Users experience slow loading times with Looker, particularly when handling larger datasets, complicating dashboard creation.
  • Users often experience slow performance with Looker, particularly during data loading and complex transformations.
  • Users find Looker to have high complexity, struggling with learning curves and limited visuals, affecting overall usability.

What Are Recent G2 Reviews of Looker?

What Are G2 Users Discussing About Looker?

IBM Cognos Analytics

IBM Cognos Analytics is a business intelligence and analytics solution that uses agentic AI to help teams transform trusted data into actionable insights, build governed analytical applications, and make better decisions. Teams can explore data, monitor KPIs, analyze performance, forecast trends, and share insights across the business. The solution is built for business leaders, analysts, report authors, IT teams, and data governance teams that need governed reporting, self-service analytics, data modeling, and flexible deployment options. Common use cases include enterprise reporting, operational reporting, financial reporting, dashboarding, performance management, forecasting, and governed self-service analytics. It supports both centralized BI teams and distributed users who need consistent access to trusted analytics. Key capabilities: 1. Create governed reports and dashboards: Build, schedule, distribute, and manage reports, dashboards, and visualizations for teams, executives, and stakeholders. Support routine reporting, business reviews, and purpose-built analytical applications with consistent information. 2. Explore data with control: Use self-service analytics, certified data models, governed metrics, access controls, and auditability to keep reporting consistent across teams and departments. 3. Analyze and forecast faster: Use natural-language assistance, automated insights, and forecasting to help users understand data faster in supported versions and deployments. 4. Put Reporting Agents to work: Use agentic AI capabilities in supported versions and deployments to find reports, summarize results, share insights, and create or refine reports using natural language. 5. Deploy where the business needs it: Run Cognos Analytics in on-premises, IBM-hosted, hybrid, or certified container environments to align with infrastructure, security, and governance requirements. Cognos Analytics helps organizations reduce repetitive reporting work, improve consistency across metrics and dashboards, and make governed data analytics easier to access across the business.

Average Rating: 4.1/5.0

Total Reviews: 437

How Do G2 Users Rate IBM Cognos Analytics?

  • Has the product been a good partner in doing business?: 7.8/10 (Category avg: 9.2/10)
  • Steps to Answer: 7.6/10 (Category avg: 8.4/10)
  • Reports Interface: 8.0/10 (Category avg: 8.8/10)
  • Calculated Fields: 8.1/10 (Category avg: 8.5/10)

Who Is the Company Behind IBM Cognos Analytics?

  • Seller: IBM
  • Company Website:
  • Year Founded: 1911
  • HQ Location: Armonk, New York, United States
  • Twitter: @IBMSecurity
    74,660 Twitter followers
  • LinkedIn® Page: www.linkedin.com
    344,328 employees on LinkedIn®

Who Uses This Product?

  • Who Uses This: Software Engineer, Analyst
  • Top Industries: Information Technology and Services, Financial Services
  • Company Size: 58% Large, 26% Medium

What Do G2 Reviewers Say About IBM Cognos Analytics?

AI-generated summary from verified user reviews

Pros
  • Users appreciate the ease of use of IBM Cognos Analytics, facilitating quick data analysis and visualization.
  • Users appreciate the data visualization capabilities of IBM Cognos Analytics, enhancing understanding and insights effortlessly.
  • Users value the intuitive user interface of IBM Cognos Analytics, enhancing data comprehension and report creation efforts.
  • Users value the dashboard customization in Cognos Analytics, making complex data visuals clear and understandable.
  • Users appreciate the efficiency of IBM Cognos Analytics, benefiting from quick report generation and clear visualizations.
Cons
  • Users find the learning curve steep, requiring significant time and training to effectively utilize IBM Cognos Analytics.
  • Users find the pricing of IBM Cognos Analytics to be expensive, impacting overall satisfaction despite its features.
  • Users find IBM Cognos Analytics complex to navigate and build reports, often requiring extensive training for effective use.
  • Users find the complex usage of IBM Cognos Analytics challenging, especially with report creation and software integration.
  • Users find the learning difficulty of IBM Cognos Analytics challenging, especially for novices trying to build reports.

What Are Recent G2 Reviews of IBM Cognos Analytics?

What Are G2 Users Discussing About IBM Cognos Analytics?

Amazon Quick

Amazon QuickSight is a cloud-based unified business intelligence (BI) service at hyperscale. With QuickSight, all users can meet varying analytic needs from the same source of truth through modern interactive dashboards, paginated reports, natural language queries and embedded analytics. With Amazon Q in QuickSight, business analysts and business users can use natural language to build, discover, and share meaningful insights in seconds, turning insights into impact faster. Over 100,000 customers use Amazon QuickSight. Learn more at https://quicksight.aws

Average Rating: 4.3/5.0

Total Reviews: 677

How Do G2 Users Rate Amazon Quick?

  • Has the product been a good partner in doing business?: 8.3/10 (Category avg: 9.2/10)
  • Steps to Answer: 8.0/10 (Category avg: 8.4/10)
  • Reports Interface: 8.2/10 (Category avg: 8.8/10)
  • Calculated Fields: 8.0/10 (Category avg: 8.5/10)

Who Is the Company Behind Amazon Quick?

  • Seller: Amazon Web Services (AWS)
  • Year Founded: 2006
  • HQ Location: Seattle, WA
  • Twitter: @awscloud
    2,232,483 Twitter followers
  • LinkedIn® Page: www.linkedin.com
    147,094 employees on LinkedIn®
  • Ownership: NASDAQ: AMZN

Who Uses This Product?

  • Who Uses This: Data Analyst, Software Engineer
  • Top Industries: Computer Software, Information Technology and Services
  • Company Size: 40% Small, 36% Medium

What Do G2 Reviewers Say About Amazon Quick?

AI-generated summary from verified user reviews

Pros
  • Users appreciate the s seamless integration of Amazon QuickSight with AWS services for effective dashboard creation.
  • Users value the ease of use of Amazon QuickSight, simplifying the creation of interactive dashboards effortlessly.
  • Users highlight the manual integration ease of Amazon QuickSight, streamlining data collection and workflow seamlessly with AWS.
  • Users value the fast and intuitive data visualization features of Amazon QuickSight, enhancing analytical capabilities effortlessly.
  • Users value the intuitive dashboard creation in Amazon QuickSight, enhancing data accessibility and team collaboration.
Cons
  • Users find limited customization in Amazon QuickSight, impacting advanced analytics and visual flexibility compared to competitors.
  • Users find the learning curve challenging, requiring prior knowledge for effective use of QuickSight's features.
  • Users note the limited visualization options in Amazon QuickSight, impacting flexibility and usability for data presentations.
  • Users note the missing features in QuickSight, especially in customization and advanced visual options compared to competitors.
  • Users find the poor interface design of Amazon QuickSight hinders usability and complicates access to advanced features.

What Are Recent G2 Reviews of Amazon Quick?

What Are G2 Users Discussing About Amazon Quick?

Splunk Enterprise

Find out what is happening in your business and take meaningful action quickly with Splunk Enterprise. Automate the collection, indexing and alerting of machine data that's critical to your operations. Uncover the actionable insights from all your data — no matter the source or format. Leverage artificial intelligence and machine learning for predictive and proactive business decisions.

Average Rating: 4.3/5.0

Total Reviews: 414

How Do G2 Users Rate Splunk Enterprise?

  • Has the product been a good partner in doing business?: 8.7/10 (Category avg: 9.2/10)
  • Reports Interface: 5.0/10 (Category avg: 8.8/10)
  • Calculated Fields: 8.3/10 (Category avg: 8.5/10)

Who Is the Company Behind Splunk Enterprise?

  • Seller: Cisco
  • Year Founded: 1984
  • HQ Location: San Jose, CA
  • Twitter: @Cisco
    720,366 Twitter followers
  • LinkedIn® Page: www.linkedin.com
    95,294 employees on LinkedIn®
  • Ownership: NASDAQ:CSCO

Who Uses This Product?

  • Who Uses This: Software Engineer, Senior Software Engineer
  • Top Industries: Information Technology and Services, Computer Software
  • Company Size: 64% Large, 27% Medium

What Do G2 Reviewers Say About Splunk Enterprise?

AI-generated summary from verified user reviews

Pros
  • Users find Splunk Enterprise's ease of use remarkable, enabling quick access and seamless integration of large datasets.
  • Users value the robust data ingestion capabilities of Splunk Enterprise, efficiently managing diverse data sources.
  • Users commend the great integration capabilities of Splunk Enterprise, facilitating seamless implementation across various networks and systems.
  • Users value the flexibility and visualization capabilities of Splunk Enterprise, enabling effective data analysis and troubleshooting.
  • Users praise the visualization capabilities of Splunk Enterprise dashboards for effective data analysis and decision-making.
Cons
  • Users find Splunk Enterprise to be expensive, with high renewal costs and limitations that affect large organizations.
  • Users find the learning curve steep, struggling to quickly grasp Splunk Enterprise's many features and functionalities.
  • Users experience slow performance with Splunk Enterprise, noting occasional crashes and delays in processing saved searches.
  • Users find the complex configuration of Splunk Enterprise challenging, impacting performance optimization and overall user experience.
  • Users find the pricing issues with Splunk Enterprise burdensome, especially regarding storage costs and data limits.

What Are Recent G2 Reviews of Splunk Enterprise?

What Are G2 Users Discussing About Splunk Enterprise?

Databricks

Databricks is the Data and AI company. More than 20,000 organizations worldwide — including adidas, AT&T, Bayer, Block, Mastercard, Rivian, Unilever, and 70% of the Fortune 500 — rely on the Databricks Data + AI Platform to build and scale data and AI apps, analytics, and agents. Headquartered in San Francisco with 30+ offices around the globe, Databricks offers a unified platform that includes Genie, Lakebase, Agent Bricks, Lakeflow, Lakehouse, and Unity Catalog. Founded in 2013 by the original creators of Apache Spark™, Delta Lake, MLflow and Unity Catalog, Databricks is built on an open lakehouse architecture that brings data, analytics and AI together. The platform is used by data engineers, data scientists, analysts, developers, machine learning teams, AI teams and business users to collaborate across the full data and AI lifecycle. Key Databricks capabilities include: - Data engineering: Build, automate and manage reliable batch, streaming and real-time data pipelines. - Analytics and business intelligence: Run SQL analytics, create dashboards and enable business teams to explore data. - Data governance: Discover, secure and manage data and AI assets across teams, clouds and workloads. - Machine learning and AI: Develop models, build generative AI applications and create production-grade AI agents. - Data applications: Build and deploy data-driven applications using governed enterprise data. Available across AWS, Azure and Google Cloud, Databricks helps organizations work across clouds, reduce data silos and simplify collaboration across teams and tools. Customers use Databricks for use cases such as customer personalization, fraud detection, predictive maintenance, real-time analytics, cybersecurity, healthcare research, financial risk management, supply chain optimization and AI-powered decision-making. Databricks is used across industries including financial services, healthcare and life sciences, retail, manufacturing, energy and the public sector. Organizations use the platform to modernize data infrastructure, accelerate AI adoption and turn enterprise data into business value.

Average Rating: 4.6/5.0

Total Reviews: 1,333

How Do G2 Users Rate Databricks?

  • Has the product been a good partner in doing business?: 8.9/10 (Category avg: 9.2/10)
  • Steps to Answer: 8.3/10 (Category avg: 8.4/10)
  • Reports Interface: 9.1/10 (Category avg: 8.8/10)
  • Calculated Fields: 8.6/10 (Category avg: 8.5/10)

Who Is the Company Behind Databricks?

  • Seller: Databricks Inc.
  • Company Website:
  • Year Founded: 2013
  • HQ Location: San Francisco, CA
  • Twitter: @databricks
    92,269 Twitter followers
  • LinkedIn® Page: www.linkedin.com
    14,336 employees on LinkedIn®

Who Uses This Product?

  • Who Uses This: Data Engineer, Data Analyst
  • Top Industries: Information Technology and Services, Financial Services
  • Company Size: 48% Large, 38% Medium

What Do G2 Reviewers Say About Databricks?

AI-generated summary from verified user reviews

Pros
  • Users enjoy the ease of use and extensive features of Databricks, streamlining data warehousing and machine learning tasks.
  • Users value the seamless integrations with AWS services that enhance efficiency and support diverse business needs.
  • Users appreciate the ease of use of Databricks, enhancing their experience with its intuitive interface and efficient features.
  • Users value the seamless collaboration provided by Databricks, enhancing teamwork on data projects and insights sharing.
  • Users value the effective data management features of Databricks, simplifying their workflows and enhancing decision-making.
Cons
  • Users face a steep learning curve with Databricks, as its complexity can be confusing for newcomers.
  • Users note that the cost of Databricks can be quite high, particularly for large data projects and limited free options.
  • Users express frustration over missing features in Databricks, limiting its effectiveness for complex deployments and custom setups.
  • Users find the steep learning curve of Databricks challenging, particularly for those unfamiliar with big data tools.
  • Users face unintuitive UI issues that lead to random errors and complicate the experience for non-technical users.

What Are Recent G2 Reviews of Databricks?

What Are G2 Users Discussing About Databricks?

KNIME

KNIME helps everybody make sense of data. Its free and open source KNIME Analytics Platform enables anyone — whether they come from a business, technical or data background — to intuitively work with data, every day. KNIME Business Hub is the commercial complement to KNIME Analytics Platform and enables users to collaborate on data science and share insights across the organization. Together, the products support the complete data science lifecycle, allowing teams at all levels of analytics readiness to support the operationalization of data and to build a scalable data science practice.

Average Rating: 4.5/5.0

Total Reviews: 117

How Do G2 Users Rate KNIME?

  • Has the product been a good partner in doing business?: 8.5/10 (Category avg: 9.2/10)
  • Steps to Answer: 8.3/10 (Category avg: 8.4/10)
  • Reports Interface: 8.2/10 (Category avg: 8.8/10)
  • Calculated Fields: 8.9/10 (Category avg: 8.5/10)

Who Is the Company Behind KNIME?

  • Seller: KNIME
  • Company Website:
  • Year Founded: 2008
  • HQ Location: Zurich, Switzerland
  • Twitter: @knime
    7,998 Twitter followers
  • LinkedIn® Page: www.linkedin.com
    244 employees on LinkedIn®

Who Uses This Product?

  • Top Industries: Information Technology and Services, Higher Education
  • Company Size: 39% Large, 34% Medium

What Do G2 Reviewers Say About KNIME?

AI-generated summary from verified user reviews

Pros
  • Users find KNIME's ease of use enhances productivity, enabling even non-technical individuals to build workflows effortlessly.
  • Users find KNIME's coding ease remarkable, enabling effortless workflows without requiring extensive technical skills.
  • Users find KNIME to be an easy-to-learn platform, enabling quick workflow creation without coding skills.
  • Users find KNIME easy to learn and start delivering results, thanks to its intuitive visual workflow interface.
  • Users love the easy and intuitive data visualization capabilities of KNIME, enhancing understanding and communication of data insights.
Cons
  • Users find the initial learning curve challenging, especially for those unfamiliar with data science concepts and visual programming.
  • Users face memory usage issues with KNIME, leading to slow performance, especially with larger files and operations.
  • Users report storage limitations with KNIME, leading to performance issues and difficulties with large datasets.
  • Users note that data management issues hinder their experience, especially with file handling and certain databases.
  • Users find the lack of learning resources for KNIME to be a significant barrier to effective usage.

What Are Recent G2 Reviews of KNIME?

What Are G2 Users Discussing About KNIME?

Deepnote

Deepnote is a data workspace where agents and humans work together. It's designed to simplify data exploration, accelerate analysis, and quickly deliver actionable insights for you and your team. Unlike outdated tools such as Jupyter, Deepnote is built with the next decade in mind. Deepnote gives anyone working with data superpowers. It unifies your data workflow through an integrated semantic layer, preparing your data for advanced AI applications. You can also leverage our AI data copilot to chat with your data, create charts, write code, or turn your AI notebooks into fully-fledged data dashboards or apps. Combine data, SQL or Python code, and visualizations side-by-side on a flexible canvas - enhanced with cutting-edge AI reasoning models. 🤖 Analyze with AI • Generate code and visualizations by describing your goal. • Auto-write, run, and debug code with AI. • Move faster with context-aware AI suggestions. 🔗 Unify • Connect to 60+ data sources like BigQuery, Snowflake, and PostgreSQL. • Combine Python and SQL in one notebook. • Build reusable ETL, analytics, and metric modules. • Create a semantic layer with shared definitions and trusted metrics. ⚖️ Scale • Instantly boost compute power, more included than Colab. • Schedule jobs and get notified with fresh results. • Organize work in projects and folders for team clarity. • Manage workflows via REST API. 🚀 Launch • Turn notebooks into dashboards or data apps, natively or with Streamlit. • Let users explore data with interactive inputs. • Share secure, live apps in one click.

Average Rating: 4.5/5.0

Total Reviews: 382

How Do G2 Users Rate Deepnote?

  • Has the product been a good partner in doing business?: 8.6/10 (Category avg: 9.2/10)
  • Steps to Answer: 7.7/10 (Category avg: 8.4/10)
  • Reports Interface: 8.0/10 (Category avg: 8.8/10)
  • Calculated Fields: 8.2/10 (Category avg: 8.5/10)

Who Is the Company Behind Deepnote?

  • Seller: Deepnote
  • Company Website:
  • Year Founded: 2019
  • HQ Location: San Francisco , US
  • Twitter: @DeepnoteHQ
    5,239 Twitter followers
  • LinkedIn® Page: www.linkedin.com
    21 employees on LinkedIn®

Who Uses This Product?

  • Who Uses This: Student, Data Analyst
  • Top Industries: Computer Software, Higher Education
  • Company Size: 67% Small, 25% Medium

What Do G2 Reviewers Say About Deepnote?

AI-generated summary from verified user reviews

Pros
  • Users find Deepnote's ease of use enhances collaboration and simplifies data analysis with its intuitive interface.
  • Users value the seamless collaboration capabilities of Deepnote, enhancing teamwork and efficiency in data projects.
  • Users value the real-time collaboration capabilities of Deepnote, enhancing teamwork and efficiency in analytics processes.
  • Users value the easy integrations in Deepnote, enabling faster development and seamless data management across platforms.
  • Users find data management effortless with Deepnote, benefiting from easy integrations and seamless analysis capabilities.
Cons
  • Users notice slow performance when handling large datasets, affecting analysis speed and user experience.
  • Users find the limited features of Deepnote restricts their ability to fully utilize its potential.
  • Users experience data management issues with slow performance and an unintuitive file management system, affecting usability.
  • Users experience lagging performance with Deepnote, particularly when processing large datasets, affecting efficiency during critical tasks.
  • Users face slow loading times in Deepnote, particularly with larger projects, which can hinder productivity and frustrate experiences.

What Are Recent G2 Reviews of Deepnote?

What Are G2 Users Discussing About Deepnote?

Hex

Hex is the world’s favorite AI Analytics platform. With Hex, anyone can explore data using natural language, with or without code, all on trusted context, in one AI-powered platform. Get started now > https://app.hex.tech/signup?source=g2 Get a demo > https://hex.tech/request-a-demo/?source=g2

Average Rating: 4.5/5.0

Total Reviews: 402

How Do G2 Users Rate Hex?

  • Has the product been a good partner in doing business?: 9.1/10 (Category avg: 9.2/10)
  • Steps to Answer: 7.6/10 (Category avg: 8.4/10)
  • Reports Interface: 8.3/10 (Category avg: 8.8/10)
  • Calculated Fields: 7.7/10 (Category avg: 8.5/10)

Who Is the Company Behind Hex?

  • Seller: Hex Tech
  • Company Website:
  • Year Founded: 2019
  • HQ Location: San Francisco, US
  • Twitter: @_hex_tech
    6,982 Twitter followers
  • LinkedIn® Page: www.linkedin.com
    280 employees on LinkedIn®

Who Uses This Product?

  • Who Uses This: Data Analyst, Data Scientist
  • Top Industries: Computer Software, Information Technology and Services
  • Company Size: 53% Medium, 22% Small

What Do G2 Reviewers Say About Hex?

AI-generated summary from verified user reviews

Pros
  • Users find Hex to be user-friendly, highlighting its seamless integrations and fast implementation as major advantages.
  • Users love the seamless integration of SQL with Python, enhancing their analytical capabilities in Hex effortlessly.
  • Users appreciate the seamless data management capabilities of Hex, enabling effortless integration and collaboration.
  • Users value the effortless integration of SQL and Python in Hex, enhancing data analysis and visualization capabilities.
  • Users appreciate the seamless data analysis and reporting capabilities of Hex, enhancing collaboration and interactivity.
Cons
  • Users criticize the limited features of Hex, noting insufficient capabilities compared to standard BI tools like Tableau.
  • Users find the missing features in Hex frustrating, desiring better data visualization and result management capabilities.
  • Users find Hex lacking features, especially in dashboarding and advanced functionalities that impact usability and efficiency.
  • Users experience slow performance with Hex, especially within virtual machines and due to limited computational capacity.
  • Users often face data management issues with kernel failures and GPU integration, complicating their experience with Hex.

What Are Recent G2 Reviews of Hex?

What Are G2 Users Discussing About Hex?

BlazeSQL

It is an AI-Native Self-Service BI Platform, centered around an AI Data Analyst chatbot that queries, analyzes and visualizes data from your SQL Database. It enables true self-service analytics by really understanding and learning about your company and Database, so it can reliably answer everyone's questions on demand. Unlike most tools that claim to do the same, BlazeSQL is not only reliable, but it provides intuitive tooling to provide the AI with context, explains its work to non-technical users so it's not a black box, and provides transparency for admins so they have visibility of all chats and can easily monitor accuracy. It helps non-technical people get insights independently, and technical people work faster. Results from the chat can effortlessly be added to dashboards, exported, saved for tracking, or shared. While Blaze can certainly return specific data or graphs on demand (ex. campaign performance), it can fully apply its intelligence and business understanding by taking a user's high level goals (ex. increasing Return on Ad spend) and autonomously conducting a comprehensive analysis to surface the right insights and make actionable suggestions. That way, it fully leverage's the capabilities of the world's most powerful AI models as they continue to become more and more capable. Advanced capabilities include autonomous agent monitoring & reporting, a slack integration, web research, and dynamic AI integrations with any API. Enterprise security features include Role Based Access Control, a desktop client with an "Offline-mode" that only sends metadata to the cloud but leaves query results completely local, SSO, 2FA, and strong encryption in transit and at-rest. Notable customers such as Yamaha have had success using BlazeSQL, and it continues to be successfully adopted by SMEs and Large enterprises alike. Various case studies and testimonials note results like a data team saving 1.5 days a week, data bottlenecks being eliminated so that business stakeholders are able to make data a daily part of their work and thinking, and teams starting to think more strategically and critically with their analysis to deliver real business impact and growth.

Average Rating: 4.4/5.0

Total Reviews: 128

How Do G2 Users Rate BlazeSQL?

  • Has the product been a good partner in doing business?: 9.0/10 (Category avg: 9.2/10)
  • Steps to Answer: 8.7/10 (Category avg: 8.4/10)
  • Reports Interface: 8.7/10 (Category avg: 8.8/10)
  • Calculated Fields: 8.3/10 (Category avg: 8.5/10)

Who Is the Company Behind BlazeSQL?

Who Uses This Product?

  • Who Uses This: Software Engineer
  • Top Industries: Information Technology and Services, Accounting
  • Company Size: 59% Small, 29% Medium

What Do G2 Reviewers Say About BlazeSQL?

AI-generated summary from verified user reviews

Pros
  • Users appreciate the efficient data analytics capabilities of BlazeSQL, enabling quick insights and empowering self-service analysis.
  • Users appreciate the ease of use of BlazeSQL, enabling efficient data analysis and empowering non-technical users.
  • Users appreciate the efficiency and ease of use BlazeSQL offers for data analysis and self-service capabilities.
  • Users value the flexibility of BlazeSQL, enabling quick adjustments and diverse analytical capabilities through natural language queries.
  • Users value the easy integrations of BlazeSQL, enabling efficient data analysis and empowering non-technical users to explore insights.

What Are Recent G2 Reviews of BlazeSQL?