Best Analytics Platforms - Page 4

How Many Analytics Platforms Products Does G2 Track?

Total Products under this Category: 597

Category Stats (Sep 2026)

  • Average Rating: 4.51/5 (โ†‘0.01 vs Aug 2026) The average rating of products in this category, based on all submitted ratings
  • Top Trending Product: BlazeSQL (+2.75%) - Among all products in this category, BlazeSQL recorded the largest rating increase compared to last month

Last updated: September 01, 2026

How Does G2 Rank Analytics Platforms Products?

Why You Can Trust G2's Software Rankings:

  • 30 Analysts and Data Experts
  • 29,000+ Authentic Reviews
  • 597+ Products
  • Unbiased Rankings

G2's software rankings are built on verified user reviews, rigorous moderation, and a consistent research methodology maintained by a team of analysts and data experts. Each product is measured using the same transparent criteria, with no paid placement or vendor influence. While reviews reflect real user experiences, which can be subjective, they offer valuable insight into how software performs in the hands of professionals. Together, these inputs power the G2 Score, a standardized way to compare tools within every category.

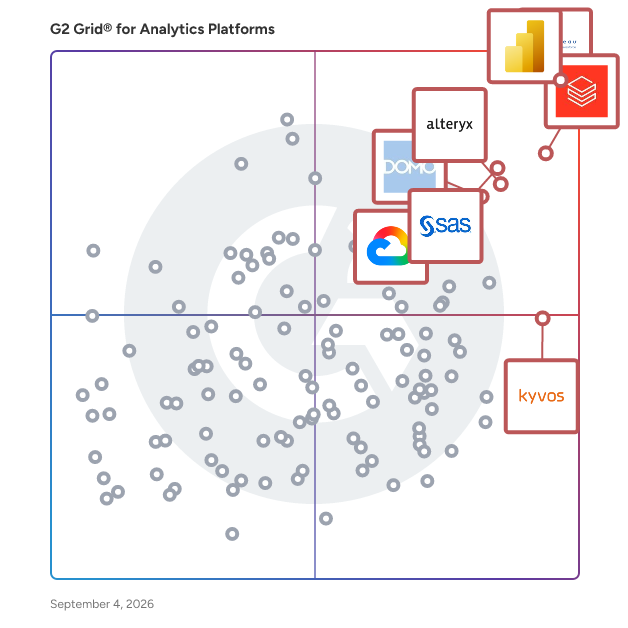
G2 Gridยฎ for Analytics Platforms

G2 Gridยฎ for Analytics Platforms plotting products by satisfaction and market presence

Highlighted products: Microsoft Power BI, Tableau, Databricks, SAS Viya, Alteryx, Domo, Looker, and Kyvos Semantic Layer.

Underlying data: [Gridยฎ JSON](https://www.g2.com/categories/analytics-platforms/grids.json?focus%5B%5D=microsoft-microsoft-power-bi&focus%5B%5D=tableau&focus%5B%5D=databricks&focus%5B%5D=sas-sas-viya&focus%5B%5D=alteryx&focus%5B%5D=domo&focus%5B%5D=looker&focus%5B%5D=kyvos-semantic-layer)

Metabase

Metabase is the easy-to-use, open source Business Intelligence tool that lets everyone work with data, with or without SQL, for internal and customer-facing, embedded analytics. Install and setup in 5 minutes. Works with whatโ€™s already in your data stack, including SQL and NoSQL databases, from PostgreSQL to MongoDB. Let your whole team explore data on their own, create charts, interactive dashboards, and set up subscriptions and alerts - even to people outside of your org. The native SQL editor and advanced data tools will win over your data team. From Open Source (Always Free) to Enterprise, from Metabase Cloud to self-hosted, Metabase has everything you need scale with you with a number of affordable plans. Try free for 14 days.

Average Rating: 4.4/5.0

Total Reviews: 145

How Do G2 Users Rate Metabase?

  • Has the product been a good partner in doing business?: 8.9/10 (Category avg: 9.2/10)
  • Steps to Answer: 8.5/10 (Category avg: 8.4/10)
  • Reports Interface: 8.9/10 (Category avg: 8.8/10)
  • Calculated Fields: 8.3/10 (Category avg: 8.5/10)

Who Is the Company Behind Metabase?

  • Seller: Metabase
  • Year Founded: 2014
  • HQ Location: Lucknow, Uttar Pradesh
  • Twitter: @metabase
    8,751 Twitter followers
  • LinkedInยฎ Page: www.linkedin.com
    129 employees on LinkedInยฎ

Who Uses This Product?

  • Who Uses This: Product Manager, Business Analyst
  • Top Industries: Information Technology and Services, Computer Software
  • Company Size: 52% Medium, 34% Small

What Do G2 Reviewers Say About Metabase?

AI-generated summary from verified user reviews

Pros
  • Users find Metabase's ease of use and intuitive interface make reporting and data exploration straightforward and quick.
  • Users find the implementation ease of Metabase remarkable, enabling quick insights and effortless data exploration for all skill levels.
  • Users value the intuitive interface of Metabase, enabling effortless report generation and data visualization for everyone.
  • Users value Metabase for its user-friendly data visualization features, empowering anyone to easily create insightful charts.
  • Users laud the easy setup of Metabase, enabling swift connections and intuitive configurations for all skill levels.
Cons
  • Users face slow performance with Metabase, experiencing long query load times and issues with large datasets.
  • Users notice missing features in Metabase, such as limited visualizations and the absence of an AI query assistant.
  • Users experience slow loading times with queries and dashboards, which can lead to frustrating timeouts.
  • Users experience performance issues with Metabase, especially when handling large datasets or high query volumes.
  • Users feel the dashboard creation UI needs improvement and suggest enhancements for visualizations and chart options.

What Are Recent G2 Reviews of Metabase?

What Are G2 Users Discussing About Metabase?

Board

Board is the Enterprise Planning Platform built to accelerate business performance and enable continuous planning with greater forecast accuracy to drive confident, aligned decisions. Its fully integrated planning solution spans the entire enterprise, delivering value for financial and operational planning in one unified platform. Using internal data and expert-curated external indicators, Board provides real-time visibility into your business. Board offers the most flexible, collaborative and adaptive user experience, powering executive dashboards and analytic capabilities that allows clear explanation and interpretation delivered through generative AI. This allows organizations to respond in an agile manner: capitalize on opportunities, optimize resources and mitigate risks.

Average Rating: 4.4/5.0

Total Reviews: 304

How Do G2 Users Rate Board?

  • Has the product been a good partner in doing business?: 8.8/10 (Category avg: 9.2/10)
  • Steps to Answer: 8.4/10 (Category avg: 8.4/10)
  • Reports Interface: 8.7/10 (Category avg: 8.8/10)
  • Calculated Fields: 8.5/10 (Category avg: 8.5/10)

Who Is the Company Behind Board?

  • Seller: Board International
  • Company Website:
  • Year Founded: 1994
  • HQ Location: Chiasso, Ticino
  • Twitter: @BoardSoftware
    27,073 Twitter followers
  • LinkedInยฎ Page: www.linkedin.com
    932 employees on LinkedInยฎ

Who Uses This Product?

  • Who Uses This: Software Engineer, Group Controller
  • Top Industries: Information Technology and Services, Computer Software
  • Company Size: 57% Medium, 40% Large

What Do G2 Reviewers Say About Board?

AI-generated summary from verified user reviews

Pros
  • Users praise the ease of use of Board, facilitating quick deployment and intuitive self-service interactions.
  • Users value the flexibility of Board, allowing customization to fit diverse business needs seamlessly.
  • Users value the centralized access to information, making board meetings efficient and focused on strategic discussions.
  • Users value the efficiency of Board, benefiting from faster deployment and streamlined meeting management.
  • Users appreciate the highly flexible customization of Board, allowing tailored solutions for diverse business needs.
Cons
  • Users experience slow performance with large datasets on Board, impacting efficiency and complicating the use of advanced features.
  • Users find that the learning curve for Board can be steep, particularly in configuration and advanced features.
  • Users find the missing features like layout exclusions limiting, impacting their overall experience with Board.
  • Users express frustration with poor visualization in Board, highlighting inefficiencies in dashboard design and data handling.
  • Users find the complexity of configuration in Board challenging, especially for new users and smaller teams.

What Are Recent G2 Reviews of Board?

What Are G2 Users Discussing About Board?

Easy Insight

Easy Insight provides affordable, easy to use SaaS business intelligence. Instant connections to other popular SaaS products such as Basecamp, Zendesk, and Salesforce come with prebuilt dashboards to get you up and running with immediate results. A simple report builder helps you quickly adjust or create any new reports from scratch in a variety of visualizations. When you're ready to move beyond connecting to one or two SaaS products, Easy Insight provides robust ETL capabilities within the product itself to help you import flat file or relational database data, transform and join the data with other data sources, and create everything from beautiful executive dashboards to detailed tables. Extensive and easy to use security features make it easy to limit which data your users can see, enabling you to take a single dashboard and present it differently to everyone in your organization. Each sales rep will see his own data and each project manager her own projects, all operating on that same core set of dashboards and dramatically reducing the cost of rework.

Average Rating: 4.8/5.0

Total Reviews: 42

How Do G2 Users Rate Easy Insight?

  • Has the product been a good partner in doing business?: 9.9/10 (Category avg: 9.2/10)
  • Steps to Answer: 8.0/10 (Category avg: 8.4/10)
  • Reports Interface: 8.1/10 (Category avg: 8.8/10)
  • Calculated Fields: 7.9/10 (Category avg: 8.5/10)

Who Is the Company Behind Easy Insight?

  • Seller: Easy Insight
  • Year Founded: 2008
  • HQ Location: Denver, CO
  • Twitter: @easyinsight
    513 Twitter followers
  • LinkedInยฎ Page: www.linkedin.com
    3 employees on LinkedInยฎ

Who Uses This Product?

  • Top Industries: Marketing and Advertising, Information Technology and Services
  • Company Size: 68% Small, 25% Medium

What Are Recent G2 Reviews of Easy Insight?

What Are G2 Users Discussing About Easy Insight?

Qlik Sense

Qlik Sense empowers people to make better data-driven decisions and take action. The solution provides augmented analytics for every business need from visualization and dashboards to natural language analytics, custom and embedded analytics, reporting and alerting. Our unique associative technology enhances human intuition with AI-powered insights, offering unmatched capabilities for combining data and exploring information. It indexes the associations in your data, and exposes related and unrelated values as you click, revealing hidden insights that would be missed by query-based tools. And it performs calculations as fast as you can think. Qlik Sense helps users move from passive to active analytics for real-time collaboration and action. And you get robust data integration, application automation and the convenience of SaaS with hybrid multi-cloud capabilities. See why weโ€™ve been named a Gartner Magic Quadrant Leader for Analytics and BI platforms for 11 years in a row. Visit us at https://www.qlik.com/us/

Average Rating: 4.4/5.0

Total Reviews: 761

How Do G2 Users Rate Qlik Sense?

  • Has the product been a good partner in doing business?: 8.5/10 (Category avg: 9.2/10)
  • Steps to Answer: 8.3/10 (Category avg: 8.4/10)
  • Reports Interface: 8.4/10 (Category avg: 8.8/10)
  • Calculated Fields: 8.4/10 (Category avg: 8.5/10)

Who Is the Company Behind Qlik Sense?

  • Seller: Qlik
  • Year Founded: 1993
  • HQ Location: Radnor, PA
  • Twitter: @qlik
    64,130 Twitter followers
  • LinkedInยฎ Page: www.linkedin.com
    4,551 employees on LinkedInยฎ
  • Phone: 1 (888) 994-9854

Who Uses This Product?

  • Who Uses This: Consultant, Analyst
  • Top Industries: Information Technology and Services, Computer Software
  • Company Size: 41% Large, 41% Medium

What Do G2 Reviewers Say About Qlik Sense?

AI-generated summary from verified user reviews

Pros
  • Users love the ease of use in Qlik Sense, enhancing their productivity with minimal IT support needed.
  • Users commend the robust data visualization capabilities of Qlik Sense, enhancing insights with its user-friendly interface.
  • Users appreciate the rapid development capabilities of Qlik Sense, enabling quick creation and deployment of analytics applications.
  • Users value the robust data visualization capabilities of Qlik Sense, enhancing their insights and business strategies.
  • Users value the versatile and user-friendly tools in Qlik Sense, enhancing data representation and insights across levels.
Cons
  • Users find the limited features of Qlik Sense restrict their ability to create custom visualizations effectively.
  • Users find the missing features in Qlik Sense restrictive, particularly lacking personal object additions and static report options.
  • Users find Qlik Sense expensive, which limits its accessibility despite its capabilities.
  • Users note the limited automation in data updates and desire better organization and visualization capabilities in Qlik Sense.
  • Users find the learning curve steep, especially with scripting functions and integration challenges for beginners.

What Are Recent G2 Reviews of Qlik Sense?

What Are G2 Users Discussing About Qlik Sense?

Strategy One (formerly MicroStrategy ONE)

๐Ÿš€ Strategy One โ€“ the AI+BI Platform for Enterprise Analytics at Scale What is Strategy One? Strategy One is the enterprise AI + BI platform that powers data-driven decision-making at scale. Built for complex enterprises, it unifies business intelligence, advanced analytics, and governed data modeling into a single, open platform. With native AI-powered workflows, pixel-perfect dashboards, modern self-service tools, and seamless integrations with Excel, Power BI, and Tableau, Strategy One delivers trusted insights wherever decisions are made. Why Strategy One? Unlike fragmented BI stacks or limited legacy tools, Strategy One provides an end-to-end platform with one trusted semantic core. Business users get governed self-service. Analysts get powerful modeling tools. Executives get real-time answers they can trust. And IT retains full control over data access, definitions, and lineage. Whether youโ€™re creating executive dashboards, deploying embedded analytics, scaling AI copilots, or consolidating BI toolsโ€”Strategy One meets the moment with: โœ… Cloud-native architecture โœ… Open integrations with 200+ data sources โœ… Enterprise-grade security and governance โœ… Industry-leading performance and scale โœ… Built-in support for AI copilots, agents, and models Strategy One is trusted by global enterprises in banking, retail, healthcare, and government to turn data into decisionsโ€”fast, securely, and at scale.

Average Rating: 4.2/5.0

Total Reviews: 529

How Do G2 Users Rate Strategy One (formerly MicroStrategy ONE)?

  • Has the product been a good partner in doing business?: 7.7/10 (Category avg: 9.2/10)
  • Steps to Answer: 7.5/10 (Category avg: 8.4/10)
  • Reports Interface: 8.2/10 (Category avg: 8.8/10)
  • Calculated Fields: 8.0/10 (Category avg: 8.5/10)

Who Is the Company Behind Strategy One (formerly MicroStrategy ONE)?

  • Seller: Strategy (formerly MicroStrategy)
  • Company Website:
  • Year Founded: 1989
  • HQ Location: Tysons Corner, VA
  • Twitter: @MicroStrategy
    303,456 Twitter followers
  • LinkedInยฎ Page: www.linkedin.com
    3,457 employees on LinkedInยฎ

Who Uses This Product?

  • Who Uses This: Manager, Business Intelligence Developer
  • Top Industries: Retail, Financial Services
  • Company Size: 62% Large, 29% Medium

What Do G2 Reviewers Say About Strategy One (formerly MicroStrategy ONE)?

AI-generated summary from verified user reviews

Pros
  • Users find the ease of use in Strategy One enhances data management and visualization, streamlining their workflow effectively.
  • Users value the commitment to innovation in Strategy One, enhancing functionality and keeping it ahead of competitors.
  • Users find the easy setup of Strategy One to be straightforward, enhancing their overall experience with the platform.
  • Users appreciate the customization capabilities of Strategy One, enabling quick and flexible report and dashboard creation.
  • Users value the flexible dashboard customization in Strategy One, enabling easy access to comprehensive data insights.
Cons
  • Users find the learning difficulty of Strategy One overwhelming, with notable challenges for both technical and end users.
  • Users find the product has a steep learning curve, requiring significant training and adjustments to master effectively.
  • Users find the Copilot integration lacking and face issues with slow service and data management difficulties.
  • Users find the complex usage of Strategy One challenging, citing a steep learning curve and integration issues with Excel.
  • Users find access restrictions frustrating, needing the enterprise version for better availability and customization options.

What Are Recent G2 Reviews of Strategy One (formerly MicroStrategy ONE)?

What Are G2 Users Discussing About Strategy One (formerly MicroStrategy ONE)?

Gathr.ai

Gathr.ai powers AI with complete data context for higher quality intelligence. With day-zero, high-fidelity data discourse, users can get data-backed answers to the โ€˜whyโ€™, โ€˜what-ifโ€™, and โ€˜how do Iโ€™ questions that drive business KPIs forward. This intelligence is delivered natively on top of the organizationโ€™s existing data estate โ€” including data warehouses, databases, federated SQL engines, and operational systems. Leading businesses across industries also rely on Gathr.ai to build high-performance data pipelines, bespoke Data+AI solutions, and action-driven analytics experiences. Built for builders, Gathr.ai delivers agility, performance, and control. It snaps into the existing stack โ€” integrating upstream and downstream systems with no extra plumbing. It gives developers starter-kit speed and full extension freedom.

Average Rating: 4.8/5.0

Total Reviews: 33

How Do G2 Users Rate Gathr.ai?

  • Has the product been a good partner in doing business?: 10.0/10 (Category avg: 9.2/10)
  • Steps to Answer: 9.8/10 (Category avg: 8.4/10)
  • Reports Interface: 9.8/10 (Category avg: 8.8/10)
  • Calculated Fields: 9.8/10 (Category avg: 8.5/10)

Who Is the Company Behind Gathr.ai?

  • Seller: Gathr.ai
  • Year Founded: 2022
  • HQ Location: Los Gatos, CA, US
  • LinkedInยฎ Page: www.linkedin.com
    57 employees on LinkedInยฎ

Who Uses This Product?

  • Who Uses This: Associate Software Engineer
  • Top Industries: Information Technology and Services, Computer Software
  • Company Size: 79% Medium, 21% Large

What Do G2 Reviewers Say About Gathr.ai?

AI-generated summary from verified user reviews

Pros
  • Users value the seamless integrations of Gathr.ai, enabling quick connections and streamlined data processing for analytics.
  • Users celebrate the user-friendly data management features of Gathr.ai, enabling quick insights and better data quality control.
  • Users appreciate the intuitive drag-and-drop interface of Gathr.ai, enabling quick and easy pipeline creation and integration.
  • Users appreciate the ease of use of Gathr.ai, making data processing quick and efficient with its intuitive interface.
  • Users love the easy integrations with Gathr.ai, enabling swift creation of complex data workflows and analytics.
Cons
  • Users note that access issues arise due to a lack of native connectors, complicating integration workflows.
  • Users report connection issues when configuring connectors for legacy systems, but support can offer timely solutions.
  • Users find the difficult setup of custom connectors a bit challenging, but it's not a major hindrance.
  • Users find the lack of real-time data hinders their ability to effectively monitor or improve pipeline performance.
  • Users find that performance optimization requires technical expertise and lacks visibility into real-time data transfer rates.

What Are Recent G2 Reviews of Gathr.ai?

Bold BI

Bold BIยฎ by Syncfusionยฎ is a modern, flexible analytics platform that empowers everyoneโ€”from business users to developersโ€”to turn raw data into meaningful insights, fast. Whether you're embedding analytics into your application or building dashboards from scratch, Bold BI makes it easy to deliver powerful, interactive data experiences without compromising on performance or security. With an intuitive no-code, drag-and-drop interface, even non-technical users can create stunning dashboards in minutes. Meanwhile, developers enjoy deep customization through robust APIs, SDKs, and white-labeling options, making it simple to integrate analytics seamlessly into any application. With support for 130+ data sources, including Microsoft SQL Server, Azure SQL Data Warehouse, Oracle, REST APIs, Bold Datahub, and more, Bold BI offers unmatched data flexibility and connectivity. Designed for secure, scalable deployments, the platformโ€™s multi-tenant architecture and enterprise-grade security features single sign-on (SSO) via OAuth2 and OpenID and role-based access control to ensure data protection and simplified user management. Real-time dashboard sharing, scheduled alerts, and export options make collaboration effortless, helping teams stay aligned and make faster, data-driven decisions. Backed by Syncfusion, Bold BI offers end-to-end expert support, ideal for organizations looking to scale their analytics. Customers benefit from 24/5 assistance through free scheduled support calls, live chat, and emailโ€”from onboarding to full implementation. NOTE: Older reviews may reference the historical product name, "Syncfusion Dashboard Platform."

Average Rating: 4.4/5.0

Total Reviews: 89

How Do G2 Users Rate Bold BI?

  • Has the product been a good partner in doing business?: 8.9/10 (Category avg: 9.2/10)
  • Steps to Answer: 7.9/10 (Category avg: 8.4/10)
  • Reports Interface: 8.4/10 (Category avg: 8.8/10)
  • Calculated Fields: 8.3/10 (Category avg: 8.5/10)

Who Is the Company Behind Bold BI?

  • Seller: Syncfusion
  • Company Website:
  • Year Founded: 2001
  • HQ Location: Morrisville, North Carolina
  • Twitter: @Syncfusion
    11,907 Twitter followers
  • LinkedInยฎ Page: www.linkedin.com
    2,709 employees on LinkedInยฎ

Who Uses This Product?

  • Top Industries: Computer Software, Information Technology and Services
  • Company Size: 51% Small, 32% Medium

What Do G2 Reviewers Say About Bold BI?

AI-generated summary from verified user reviews

Pros
  • Users highlight the exceptional customer support from Bold BI, noting quick resolutions and expert guidance throughout the process.
  • Users value the ease of use of Bold BI, enjoying a seamless experience for all skill levels.
  • Users value the easy integration with numerous data sources, enhancing their analytics capabilities effortlessly.
  • Users praise the drag-and-drop dashboard customization, enabling quick and impressive dashboard creation without coding skills.
  • Users value the seamless embedding capabilities of Bold BI, facilitating integration within various applications and portals.
Cons
  • Users frequently encounter bugs with Bold BI, particularly evident during version updates and when using Docker and Kubernetes.
  • Users find the learning curve steep, requiring technical knowledge and tutorials for effective setup and usage.
  • Users find the difficult setup of Bold BI time-consuming, requiring tutorials and technical knowledge for advanced features.
  • Users report encountering numerous software bugs in Bold BI, especially during updates and with Docker and Kubernetes integrations.
  • Users note the dashboard issues with lengthy setup times and a complex learning curve for advanced features.

What Are Recent G2 Reviews of Bold BI?

What Are G2 Users Discussing About Bold BI?

Plotly Dash Enterprise

Dash is the trusted solution for operationalizing Python models, allowing data science teams to focus on data and models, while still producing and deploying enterprise-ready apps. What would typically require a team of back-end developers, front-end developers and IT can all be done with Dash. It enables data science teams to build, design, deploy, and securely manage data-driven applications that align with your business goals. Companies can deliver on their data, analytic, and AI initiatives quickly and effectively -- no JavaScript, CSS, CronJobs or DevOps required.

Average Rating: 4.8/5.0

Total Reviews: 36

How Do G2 Users Rate Plotly Dash Enterprise?

  • Has the product been a good partner in doing business?: 8.8/10 (Category avg: 9.2/10)
  • Steps to Answer: 7.9/10 (Category avg: 8.4/10)
  • Reports Interface: 8.5/10 (Category avg: 8.8/10)
  • Calculated Fields: 9.0/10 (Category avg: 8.5/10)

Who Is the Company Behind Plotly Dash Enterprise?

  • Seller: Plotly
  • Year Founded: 2013
  • HQ Location: Montrรฉal, CA
  • Twitter: @plotlygraphs
    41,308 Twitter followers
  • LinkedInยฎ Page: www.linkedin.com
    107 employees on LinkedInยฎ

Who Uses This Product?

  • Top Industries: Computer Software
  • Company Size: 47% Small, 31% Large

What Do G2 Reviewers Say About Plotly Dash Enterprise?

AI-generated summary from verified user reviews

Pros
  • Users appreciate the easy charting features of Plotly Dash Enterprise, enabling beautiful visualizations without coding.
  • Users appreciate the coding ease of Plotly Dash Enterprise, simplifying the creation of stunning visualizations effortlessly.
  • Users appreciate the excellent customer support of Plotly Dash Enterprise, enhancing their overall experience and productivity.
  • Users appreciate the ease of dashboard management in Plotly Dash Enterprise, creating efficient visualizations effortlessly.
  • Users love the user-friendly data visualization features of Plotly Dash Enterprise, enabling stunning dashboards effortlessly.

What Are Recent G2 Reviews of Plotly Dash Enterprise?

What Are G2 Users Discussing About Plotly Dash Enterprise?

Zoho Analytics

Zoho Analytics is a GenAI-powered self-service BI and analytics platform that helps businesses collect, prepare, analyze, and present insights from their data, all within minutes. Integrate with 500+ native data sources, like files, feeds, local and cloud databases, cloud storage, and popular business apps. Clean, transform, enrich, and catalog data with our agentic AI-powered, self-service data preparation and management capabilities. Create and manage complex ETL data pipelines using our visual pipeline builder, process stream data for real-time analytics, and set up a strong metrics layer for quality analysis and management. Zoho Analytics comes with 100+ domain-specific prebuilt reports and dashboards, pre-trained NLQ models, intelligently modeled and blended data across business applications, and lots more. Use our intuitive drag-and-drop visualization builder to build insightful and interactive reports and dashboards using a wide variety of visual components, like charts, widgets, pivot tables, tabular views and more. Generate customized reports and dashboards using simple, natural language with our AI-powered conversational agent, Zia. Ask Zia goes beyond basic reporting; it enables users to perform diagnostic analytics, forecast key metrics, and receive intelligent insights and recommendations. Users can assign tasks and trigger actions just by conversing with our agentic AI, Zia, streamlining their workflows and empowering data-driven decisions. Seamlessly embed Ask Zia into your custom or business applications to deliver contextual insights and actions. Enrich your analysis with automated insights by using our NLG-powered narration engine, Zia Insights. With diagnostic analytics for smarter decision-making, Zia Insights takes automated insights to the next level by bubbling up key drivers for particular business tasks. Enumerate complex business scenarios with what-if analyses, forecast KPIs, uncover trends and patterns with advanced analytical capabilities. Leverage cognitive analysis for keyword extraction and sentiment analysis, and more. Evaluate the best ML models with no-code assistance or develop custom models and functions using Python Code Studio. Zoho Analytics comes with pre-packed ML models (AutoML) that allow you to evaluate and pick the best model for your use case. Alternatively custom models and functions using Python Code Studio Embed our full-fledged analytics platform into other software applications. Craft and present immersive data stories through slideshows or purpose-built analytics portals. Collaborate securely through contextual comment threads and real-time messaging. Zoho Analytics has a robust set of APIs that enables elaborate customization and highly extensible low-code and no-code integration with any technology stack. It also offers a high degree of deployment flexibility (private, public, multi-cloud, and on-premises) and platform extensibility (professional services, partner support, and marketplace). Zoho Analytics is modern and scalable, and it can readily match growing data volumes and usage. Its time-tested and accredited enterprise-grade security features and governance framework ensure continuous data management and stewardship. On top of everything else, the TCO for Zoho Analyticsโ€”including licensing, implementation, customization, training, and supportโ€”is the lowest in our market.

Average Rating: 4.2/5.0

Total Reviews: 283

How Do G2 Users Rate Zoho Analytics?

  • Has the product been a good partner in doing business?: 8.5/10 (Category avg: 9.2/10)
  • Steps to Answer: 8.0/10 (Category avg: 8.4/10)
  • Reports Interface: 8.1/10 (Category avg: 8.8/10)
  • Calculated Fields: 8.3/10 (Category avg: 8.5/10)

Who Is the Company Behind Zoho Analytics?

  • Seller: Zoho
  • Year Founded: 1996
  • HQ Location: Austin, TX
  • Twitter: @Zoho
    137,880 Twitter followers
  • LinkedInยฎ Page: www.linkedin.com
    30,766 employees on LinkedInยฎ
  • Phone: +1 (888) 900-9646

Who Uses This Product?

  • Who Uses This: Director, Business Analyst
  • Top Industries: Information Technology and Services, Computer Software
  • Company Size: 50% Small, 43% Medium

What Do G2 Reviewers Say About Zoho Analytics?

AI-generated summary from verified user reviews

Pros
  • Users appreciate the ease of use of Zoho Analytics, thanks to its intuitive interface and customizable dashboards.
  • Users value the intuitive interface and customization of Zoho Analytics, enhancing their data reporting experience effortlessly.
  • Users appreciate the seamless integrations of Zoho Analytics, enabling easy data import from various external sources.
  • Users appreciate the user-friendly dashboards of Zoho Analytics, enabling easy customization and efficient data tracking.
  • Users appreciate the intuitive data visualization in Zoho Analytics, making complex analysis accessible and straightforward.
Cons
  • Users experience a steep learning curve with Zoho Analytics, especially for complex reports and advanced features.
  • Users find the limited customization options in Zoho Analytics frustrating compared to other platforms, like Google Analytics.
  • Users experience limited data integration options with Zoho Analytics, hindering seamless connectivity and overall functionality.
  • Users face integration issues with Zoho Analytics, limiting connections to external data sources and complicating functionality.
  • Users feel the missing features in Zoho Analytics limit functionality, especially for advanced data analysis tasks.

What Are Recent G2 Reviews of Zoho Analytics?

What Are G2 Users Discussing About Zoho Analytics?

wynEnterprise

Discover the story behind your data with Wyn Enterprise. Wyn Enterprise is a seamless embedded business intelligence platform that provides BI reporting, interactive dashboards, scheduling, and distribution tools within any internal or commercial app. With easy-to-use designers, designed for self-service BI, Wyn offers limitless visual data exploration, allowing the everyday user to become data-driven while revealing trends and telling the story behind the data. Whether for your business or your commercial SaaS app, Wyn is an ideal solution for both. Embedded BI for your business provides a holistic view of your business and can lead to more insights, increased team collaboration, and overall business growth. Additionally, embedding Wyn in your SaaS app provides white-label reports and dashboards as part of your own app. Embed Wyn and empower your users with a seamless business intelligence solution. Features: โ€ข Seamlessly embedded Business Intelligence: Designed for embedded self-service BI, Wyn provides ad hoc reporting, interactive dashboards, scheduling, and distribution tools within any internal or commercial app. Our platform offers flexible deployment and integration. โ€ข Embedding BI with Wyn: Once installed, Wyn is 100% web-based. In your application, Wyn is embedded as a port to provide users the ability to easily create, design, share, export, and distribute dashboards and documents. Seamlessly embed Wyn via Rest API and DIV. Wyn also supports OEM installation and embedding. Additionally, you can integrate with development platforms such as Java, PHP, and .NET through GraphQL API. You can also embed inside customized .NET apps as well as JavaScript frameworks (Angular, React, Vue). โ€ข Self-service BI dashboard and reports: Eliminate your dependence on the IT departments and data analysts. Offer every end-user (from code-first to code-free) the ability to create custom ad hoc reports and interactive dashboards. Self-service BI allows users to run their own queries and create their own reports, even if they donโ€™t have a background in statistical analysis, allowing them to turn data into valuable insights for better data driven decisions. โ€ข Data Monitoring: Create threshold based notifications and establish Wyn Alerts that are always on to monitor your data. Never miss an opportunity for improvement thanks to real-time monitoring and instant alerts. Integrate your push-notifications with the platform you use everyday - Slack, MS Teams, or email - ensuring that you never miss an alert. โ€ขLocalization Support: With Custom Localization Support, youโ€™re in control of your dashboard and report. Authors have the ability to localize titles and labels, text explanations, and data visualizations. There is more to localization than just translating words and sentences. Wynโ€™s custom localization also supports right to left (RTL) languages, regional language options, and number and date formats. โ€ขNEW! Natural Language Generation Text Scenario: Introducing InsightIQ, a revolutionary addition to our feature set that transforms the way you interact with your data. InsightIQ is a Natural Language Generation Text Scenario that takes data summarization and insights derivation to a whole new level. This powerful tool allows you to seamlessly distill the essence of your visuals into articulate and easy-to-understand natural language text, facilitating quick reviews and automatic insights extraction. โ€ข Built-in multi-tenant support: Wyn's multi-tenant capabilities provides a single centrally administered architecture to serve multiple customers (tenants). These tenants can be within an organization or different businesses, with all its data stored in the SaaS system. Data privacy and securing the data from other tenants are both critical in these deployment scenarios โ€ข Date governance and modeling: Wyn allows you to secure and model your raw data. With easy-to-use dashboard and report designers in the same web-based application, end-users can develop their own ad-hoc dashboards and reports based on the secured data. Wyn also allows allows admins to model business data in a structure familiar to users. โ€ข Extensible security: Wyn provides extensible security to match your access control needs. Filter and segregate your data and limit your tenant-specific data with the configurable role-based security and user-context definitions. User contexts provide row-level data security in a document or database-level security for a data source. User context acts as an additional layer of data security, extending the role-based security. โ€ข Specialized web portals: The software comes with three portals, the document portal; for business end-users, dashboard, and report authors, the admin portal; for admins that configure the server, manage account and security settings, and the resource portal; for data administrators or IT teams. โ€ข Pixel-perfect reports: For power users and business users, the report designer tools can help in developing pixel-perfect operational reports, as well as in creating invoices, letters, and account statements among many others. The software further allows you to use ad hoc reporting or the standard enterprise reports. โ€ข Efficient Report Sharing: The software also allows you to schedule automated delivery of reports to be sent to your teamโ€™s emails. File sharing in various document formats is also supported. Additionally, you can collaborate with your team on report and dashboard designs, and you can share the published versions with others in your enterprise. โ€ข Centralized storage; Apart from being a secured platform, Wyn Enterprise also provides centralized storage for all your reports, images, datasets, and configuration settings. Other server resources, such as dashboards, themes, models, users, and roles, are also stored in the same place. The software also allows you to compile data from relational databases, local Excel or CSV files, web sources, and NoSQL data sources. Say Goodbye to User Fees You need a scalable BI platform. You also need to know how much it will cost in the long run. Wyn's scalable licensing model allows room for your business to grow without growth in licensing fees. โ€ข No per-user fees โ€ข No limits on data size 20+ Years in the Industry Unleash the full potential of embedded ad hoc reporting, driven by the same ActiveReports engine that has led the industry for 20+ years.

Average Rating: 4.7/5.0

Total Reviews: 38

How Do G2 Users Rate wynEnterprise?

  • Has the product been a good partner in doing business?: 9.7/10 (Category avg: 9.2/10)
  • Steps to Answer: 9.1/10 (Category avg: 8.4/10)
  • Reports Interface: 9.2/10 (Category avg: 8.8/10)
  • Calculated Fields: 8.7/10 (Category avg: 8.5/10)

Who Is the Company Behind wynEnterprise?

  • Seller: wynEnterprise LLC
  • Company Website:
  • Year Founded: 2018
  • HQ Location: 7400 Beaufont Springs Dr., St 300, Richmond VA 23225
  • LinkedInยฎ Page: www.linkedin.com
    28 employees on LinkedInยฎ

Who Uses This Product?

  • Top Industries: Information Technology and Services
  • Company Size: 53% Small, 37% Medium

What Do G2 Reviewers Say About wynEnterprise?

AI-generated summary from verified user reviews

Pros
  • Users appreciate the excellent customer support of wynEnterprise, ensuring effective problem resolution and user satisfaction.
  • Users find wynEnterprise to be easy to use, allowing for quick implementation and impressive data visualizations.
  • Users love the flexibility of wynEnterprise, enabling tailored solutions and easy integration with existing systems.
  • Users value the impressive reporting and analytics capabilities of wynEnterprise, making it effective for various business needs.
  • Users value the high level of customization in wynEnterprise, enabling precise branding and tailored data visuals.
Cons
  • Users find the documentation lacking, making it challenging to navigate the system's in-depth options effectively.
  • Users find the complexity of wynEnterprise challenging, with a steep learning curve and the need for better documentation.
  • Users find the lack of detailed instructions for upgrades frustrating, impacting the overall experience with wynEnterprise.
  • Users express concern over the lack of documentation and features, suggesting it limits the product's potential and usability.
  • Users face challenges with update issues, requiring time-consuming backups before applying updates to Wyn Enterprise.

What Are Recent G2 Reviews of wynEnterprise?

What Are G2 Users Discussing About wynEnterprise?

Altair AI Studio

Altair AI Studio (formerly RapidMiner Studio) is a data science tool that anyone can use to design and prototype highly explainable AI and machine learning models that help build trust throughout an organization. Altair AI Studio includes: - Full generative AI functionality with access to hundreds of large language models (LLMs). - Intuitive and powerful drag-and-drop canvases that give users code-like control without complexity. - Award-winning auto ML with automated clustering, predictive modeling, feature engineering, and time series forecasting. - Data connectivity, exploration, and preparation. - Deploy and manage AI projects and models at enterprise scale. - Collaborate with team members in the same environment without having to worry about overwriting each other's work. - Unify the entire data science lifecycle from data exploration and machine learning to model operations and visualization and deploy in the cloud. Altair AI Studio helps users make powerful insights accessible to the entire organization and can scale seamlessly for users and enterprises. Altair AI studio enables organizations to derive significant value from AI with minimal cost and operational impact.

Average Rating: 4.6/5.0

Total Reviews: 506

How Do G2 Users Rate Altair AI Studio?

  • Has the product been a good partner in doing business?: 8.9/10 (Category avg: 9.2/10)
  • Steps to Answer: 7.5/10 (Category avg: 8.4/10)
  • Reports Interface: 8.9/10 (Category avg: 8.8/10)
  • Calculated Fields: 7.5/10 (Category avg: 8.5/10)

Who Is the Company Behind Altair AI Studio?

  • Seller: Altair
  • Company Website:
  • Year Founded: 1985
  • HQ Location: Troy, MI
  • LinkedInยฎ Page: www.linkedin.com
    2,774 employees on LinkedInยฎ
  • Ownership: NASDAQ:ALTR

Who Uses This Product?

  • Who Uses This: Student, Professor
  • Top Industries: Higher Education, Education Management
  • Company Size: 42% Small, 31% Large

What Do G2 Reviewers Say About Altair AI Studio?

AI-generated summary from verified user reviews

Pros
  • Users praise the ease of use of Altair AI Studio, finding its interface intuitive and beneficial for data tasks.
  • Users value the no-code machine learning capabilities of Altair AI Studio, facilitating easy model creation and analysis.
  • Users value the seamless AI integration of Altair AI Studio, enhancing decision-making and improving efficiency across organizations.
  • Users appreciate the advanced machine learning and data analytics in Altair AI Studio for smarter decision-making and efficiency.
  • Users value the automation capabilities of Altair AI Studio, enhancing efficiency in data processing and decision making.
Cons
  • Users find the complexity of Altair AI Studio challenging, particularly with language support and integrating legacy systems.
  • Users experience slower performance when handling large datasets in Altair AI Studio, affecting their efficiency and experience.
  • Users experience slow performance when handling large datasets, leading to slowdowns or freezing during usage.
  • Users find the complexity issues of Altair AI Studio frustrating, especially due to limited support resources.
  • Users find the complex usage of Altair AI Studio challenging, especially due to limited documentation and steep learning curve.

What Are Recent G2 Reviews of Altair AI Studio?

What Are G2 Users Discussing About Altair AI Studio?

InsightOut

InsightOut is a unified data analytics platform from Treehouse Technology Group that enables business teams to do more with their data. Business users can extract insights and value from their data in context and at scale, with self-service simplicity. Our end-to-end data solution aggregates, cleans, and blends fragmented data across departments โ€” no matter the data source or volume โ€” within a visual command center. With purpose-built dashboards and intuitive visualizations, users have a 360ยฐ view of the business and can independently manage and analyze data at the speed of thought, without reliance on IT. Beyond data visualization, automated data discovery surfaces actionable business insights from the underlying data. This enables proactive decision-making to accelerate your time to market, mitigate risk, and enhance your operational efficiency. Designed to support the workflows unique to your organization, InsightOutโ€™s dynamic reporting and native Excel add-in fosters data distribution and collaboration throughout your extended enterprise of internal and external stakeholders. By joining best-in-class solutions in business intelligence and business planning, InsightOut empowers business leaders to drive growth and lead with data. Treehouse Technology Group is a technology and data strategy consulting firm, providing data development and software implementation services since 2014. We are a trusted technology partner to the Fortune 500, world-class innovators, and capital market leaders. Our valued customers include Envision Healthcare, Mars Petcare, Fidelity, Teleflex, Bain Capital, Berkshire Partners, and Wynn Resorts.

Average Rating: 4.6/5.0

Total Reviews: 49

How Do G2 Users Rate InsightOut?

  • Has the product been a good partner in doing business?: 9.5/10 (Category avg: 9.2/10)
  • Steps to Answer: 8.8/10 (Category avg: 8.4/10)
  • Reports Interface: 9.0/10 (Category avg: 8.8/10)
  • Calculated Fields: 8.8/10 (Category avg: 8.5/10)

Who Is the Company Behind InsightOut?

Who Uses This Product?

  • Top Industries: Information Technology and Services, Accounting
  • Company Size: 52% Medium, 38% Small

What Are Recent G2 Reviews of InsightOut?

Equals

The next-generation spreadsheet. Equals is the fastest, most flexible way to measure and report on your SaaS business. Automate your reporting with precision. Analyze from the comfort of a spreadsheet. Powered by live data from Stripe, Salesforce, Hubspot, and your SQL database. ---- We all understand the power and value of data. Yet, amongst the explosion of new tools to help us make sense of it all, we invariably end up back in a spreadsheet. BI tools are inherently complex and one-size-fits-all solutions simply don't cut it. Why? The spreadsheet is the only tool that gives you the flexibility to match the specifics of your business. There's really nothing like it โ€” a canvas on which you can play, move, touch, and feel data while building compounding, sophisticated analyses and reports. Yet, starting analyses in Excel and Sheets is painful. Your data always comes from somewhere else, you have to export it to a CSV, import it into your spreadsheet, and hope you didn't miss anything. And then keeping it up-to-date is the original pain times ten. At Equals, we're building a next-generation spreadsheet that works just like those that came before but is fit for this era of work. It's directly connected to your data and is as unconstrained and flexible as a spreadsheet. It's paired with BI-grade dashboards that are as quick and easy to create as a doc. Based in North America, we have been building software and companies for 10+ years at the likes of Intercom, Atlassian, Stripe, and Loom. We're backed by the best innovators and investors in Silicon Valley, including a16z and Craft Ventures.

Average Rating: 4.8/5.0

Total Reviews: 39

How Do G2 Users Rate Equals?

  • Has the product been a good partner in doing business?: 9.7/10 (Category avg: 9.2/10)
  • Steps to Answer: 8.8/10 (Category avg: 8.4/10)
  • Reports Interface: 9.5/10 (Category avg: 8.8/10)
  • Calculated Fields: 9.5/10 (Category avg: 8.5/10)

Who Is the Company Behind Equals?

  • Seller: Equals
  • Year Founded: 2021
  • HQ Location: US Remote
  • Twitter: @heyequals
    3,799 Twitter followers
  • LinkedInยฎ Page: www.linkedin.com
    26 employees on LinkedInยฎ

Who Uses This Product?

  • Who Uses This: CEO
  • Top Industries: Computer Software
  • Company Size: 85% Small, 15% Medium

What Do G2 Reviewers Say About Equals?

AI-generated summary from verified user reviews

Pros
  • Users value the ease of use with Equals, benefiting from intuitive interaction and superb support throughout their experience.
  • Users find the setup ease of Equals exceptional, making integration and onboarding swift and efficient.
  • Users commend the efficiency of Equals, which seamlessly handles reporting and data manipulation without extra exports.
  • Users love the seamless integrations of Equals, enabling efficient data synchronization across multiple platforms effortlessly.
  • Users praise the simplified workflow of Equals, enhancing productivity through centralized data reporting and real-time updates.
Cons
  • Users experience bugs and crashes while using Equals, especially with large data sets and date formatting issues.
  • Users note a slight learning curve with Equals, finding the interface confusing for beginners despite strong support resources.
  • Users desire a filters feature in Equals, highlighting its current lack for non-technical team members.
  • Users find the complex usage of Equals challenging, especially for those who are new to the product.
  • Users experience copy-paste issues in Equals, finding it less intuitive compared to Excel and wishing for more shortcuts.

What Are Recent G2 Reviews of Equals?

Astrato

๐—”๐˜€๐˜๐—ฟ๐—ฎ๐˜๐—ผ ๐—”๐—ป๐—ฎ๐—น๐˜†๐˜๐—ถ๐—ฐ๐˜€ ๐—ถ๐˜€ ๐—ฎ ๐˜„๐—ฎ๐—ฟ๐—ฒ๐—ต๐—ผ๐˜‚๐˜€๐—ฒ-๐—ป๐—ฎ๐˜๐—ถ๐˜ƒ๐—ฒ ๐—ฏ๐˜‚๐˜€๐—ถ๐—ป๐—ฒ๐˜€๐˜€ ๐—ถ๐—ป๐˜๐—ฒ๐—น๐—น๐—ถ๐—ด๐—ฒ๐—ป๐—ฐ๐—ฒ ๐—ฝ๐—น๐—ฎ๐˜๐—ณ๐—ผ๐—ฟ๐—บ ๐˜๐—ต๐—ฎ๐˜ ๐—ฒ๐—ป๐—ฎ๐—ฏ๐—น๐—ฒ๐˜€ ๐—ผ๐—ฟ๐—ด๐—ฎ๐—ป๐—ถ๐˜€๐—ฎ๐˜๐—ถ๐—ผ๐—ป๐˜€ ๐˜๐—ผ ๐—ฏ๐˜‚๐—ถ๐—น๐—ฑ, ๐—ฒ๐—บ๐—ฏ๐—ฒ๐—ฑ, ๐—ฎ๐—ป๐—ฑ ๐˜€๐—ต๐—ฎ๐—ฟ๐—ฒ ๐—ถ๐—ป๐˜๐—ฒ๐—ฟ๐—ฎ๐—ฐ๐˜๐—ถ๐˜ƒ๐—ฒ ๐—ฑ๐—ฎ๐˜€๐—ต๐—ฏ๐—ผ๐—ฎ๐—ฟ๐—ฑ๐˜€ ๐—ฎ๐—ป๐—ฑ ๐—ฑ๐—ฎ๐˜๐—ฎ ๐—ฎ๐—ฝ๐—ฝ๐—น๐—ถ๐—ฐ๐—ฎ๐˜๐—ถ๐—ผ๐—ป๐˜€ ๐—ฑ๐—ถ๐—ฟ๐—ฒ๐—ฐ๐˜๐—น๐˜† ๐—ผ๐—ป ๐˜๐—ผ๐—ฝ ๐—ผ๐—ณ ๐—ฐ๐—น๐—ผ๐˜‚๐—ฑ ๐—ฑ๐—ฎ๐˜๐—ฎ ๐˜„๐—ฎ๐—ฟ๐—ฒ๐—ต๐—ผ๐˜‚๐˜€๐—ฒ๐˜€ ๐—ถ๐—ป๐—ฐ๐—น๐˜‚๐—ฑ๐—ถ๐—ป๐—ด ๐—ฆ๐—ป๐—ผ๐˜„๐—ณ๐—น๐—ฎ๐—ธ๐—ฒ, ๐—•๐—ถ๐—ด๐—ค๐˜‚๐—ฒ๐—ฟ๐˜†, ๐——๐—ฎ๐˜๐—ฎ๐—ฏ๐—ฟ๐—ถ๐—ฐ๐—ธ๐˜€, ๐—–๐—น๐—ถ๐—ฐ๐—ธ๐—›๐—ผ๐˜‚๐˜€๐—ฒ, ๐—ฆ๐˜‚๐—ฝ๐—ฎ๐—ฏ๐—ฎ๐˜€๐—ฒ, ๐—”๐—บ๐—ฎ๐˜‡๐—ผ๐—ป ๐—ฅ๐—ฒ๐—ฑ๐˜€๐—ต๐—ถ๐—ณ๐˜, ๐—ฃ๐—ผ๐˜€๐˜๐—ด๐—ฟ๐—ฒ๐—ฆ๐—ค๐—Ÿ, ๐—ฎ๐—ป๐—ฑ ๐——๐—ฟ๐—ฒ๐—บ๐—ถ๐—ผ. Astrato's zero-copy architecture connects to the warehouse via a live-query engine, which means every dashboard, report, and workflow runs against the source data in real time โ€” without extracts, data movement, or cached copies. Security policies such as row-level access controls and PII masking are inherited directly from the warehouse, reducing governance overhead for IT and data teams. ๐—ง๐—ต๐—ฒ ๐—ฝ๐—น๐—ฎ๐˜๐—ณ๐—ผ๐—ฟ๐—บ ๐˜€๐˜‚๐—ฝ๐—ฝ๐—ผ๐—ฟ๐˜๐˜€ ๐˜๐—ต๐—ฟ๐—ฒ๐—ฒ ๐—ฝ๐—ฟ๐—ถ๐—บ๐—ฎ๐—ฟ๐˜† ๐˜‚๐˜€๐—ฒ ๐—ฐ๐—ฎ๐˜€๐—ฒ๐˜€: โ€ข ๐—š๐˜‚๐—ถ๐—ฑ๐—ฒ๐—ฑ ๐˜€๐—ฒ๐—น๐—ณ-๐˜€๐—ฒ๐—ฟ๐˜ƒ๐—ถ๐—ฐ๐—ฒ ๐—•๐—œ. A no-code interface with 70+ out-of-the-box chart types allows business users to explore data, build dashboards, and generate reports without SQL. A shared semantic layer ensures governed, reusable metric definitions across all users and content. No-code Actions let designers chain clicks, filters, and navigation into guided flows โ€” so end users get an app-like experience, not a blank dashboard. โ€ข ๐—–๐˜‚๐˜€๐˜๐—ผ๐—บ๐—ฒ๐—ฟ-๐—ณ๐—ฎ๐—ฐ๐—ถ๐—ป๐—ด ๐—ฎ๐—ป๐—ฑ ๐—ถ๐—ป๐˜๐—ฒ๐—ฟ๐—ป๐—ฎ๐—น ๐—ฒ๐—บ๐—ฏ๐—ฒ๐—ฑ๐—ฑ๐—ฒ๐—ฑ ๐—ฎ๐—ป๐—ฎ๐—น๐˜†๐˜๐—ถ๐—ฐ๐˜€. Fully white-labeled dashboards and workflows can be embedded into external products, portals, CRMs, ERPs, and intranet tools. Three embedding modes are supported โ€” single object, grouped visuals, or full interactive workbooks โ€” delivered via iframe with mobile-responsive layouts. Multi-tenant isolation is enforced at both warehouse and application level via row-level filters, group permissions, and SSO pass-through. Built-in usage telemetry tracks engagement, exploration patterns, and drop-off. โ€ข ๐—ข๐—ฝ๐—ฒ๐—ฟ๐—ฎ๐˜๐—ถ๐—ผ๐—ป๐—ฎ๐—น ๐—ฑ๐—ฎ๐˜๐—ฎ ๐—ฎ๐—ฝ๐—ฝ๐˜€ ๐—ฎ๐—ป๐—ฑ ๐˜„๐—ผ๐—ฟ๐—ธ๐—ณ๐—น๐—ผ๐˜„๐˜€. Writeback capabilities let users push data back into the warehouse from any dashboard, app, or embedded view โ€” supporting planning, forecasting, approvals, and field updates. No-code forms with validation, conditional logic, and multi-step flows can be built without engineering. Action buttons can trigger stored procedures, external functions, Salesforce updates, Slack posts, and emails, so analytics drive downstream action. ๐—”๐—ฑ๐—ฑ๐—ถ๐˜๐—ถ๐—ผ๐—ป๐—ฎ๐—น ๐—ฐ๐—ฎ๐—ฝ๐—ฎ๐—ฏ๐—ถ๐—น๐—ถ๐˜๐—ถ๐—ฒ๐˜€ ๐—ถ๐—ป๐—ฐ๐—น๐˜‚๐—ฑ๐—ฒ: โ€ข ๐—ฆ๐—ฐ๐—ต๐—ฒ๐—ฑ๐˜‚๐—น๐—ฒ๐—ฑ ๐—ฟ๐—ฒ๐—ฝ๐—ผ๐—ฟ๐˜๐—ถ๐—ป๐—ด & ๐—ฑ๐—ถ๐˜€๐˜๐—ฟ๐—ถ๐—ฏ๐˜‚๐˜๐—ถ๐—ผ๐—ป. Live, branded reports generated from the warehouse and delivered automatically in PDF, Excel, PowerPoint, or image format to email, Slack, Microsoft Teams, or SharePoint. Teams can upload their own Excel or PowerPoint templates and have them populated with live data at run-time. Per-recipient row-level security ensures governed distribution, and reports can be archived to S3, Google Drive, or SharePoint for audit and compliance. โ€ข ๐—š๐—ฒ๐—ป ๐—”๐—œ & ๐—•๐—œ ๐—–๐—ผ๐—ฝ๐—ถ๐—น๐—ผ๐˜. Contextual AI Insights generate summaries that regenerate as users filter and drill. BI Copilot accelerates build time by generating chart titles, business-friendly field labels, and complex measures like YoY growth or retention from plain-language input. Custom Report lets end users ask questions in natural language and get visualizations back. Every AI output is grounded in the semantic layer. Bring your own LLM โ€” Snowflake Cortex, OpenAI, Azure OpenAI, Claude by Anthropic, or Google Gemini โ€” or use the default provider. With Snowflake Cortex, queries execute inside the warehouse and data never leaves. Admins control AI features via independent per-capability toggles. โ€ข ๐—˜๐—บ๐—ฏ๐—ฒ๐—ฑ๐—ฑ๐—ถ๐—ป๐—ด ๐—ฎ๐—ป๐—ฑ ๐—ถ๐—ป๐˜๐—ฒ๐—ด๐—ฟ๐—ฎ๐˜๐—ถ๐—ผ๐—ป. Dashboards can be embedded with full white-label control over colours, fonts, logos, layout, and domain. Authentication is handled via SSO pass-through, OAuth, or token-based access. SCIM and APIs support automated user provisioning at scale. โ€ข ๐—š๐—ผ๐˜ƒ๐—ฒ๐—ฟ๐—ป๐—ฎ๐—ป๐—ฐ๐—ฒ & ๐—น๐—ถ๐—ณ๐—ฒ๐—ฐ๐˜†๐—ฐ๐—น๐—ฒ ๐—ฐ๐—ผ๐—ป๐˜๐—ฟ๐—ผ๐—น. Role-based access control across view, edit, design, export, and admin. Workbook lifecycle governance with draft, version, publish workflows and change tracking. Row-level security inherited from the warehouse or configured per semantic layer. โ€ข ๐—˜๐—ป๐˜๐—ฒ๐—ฟ๐—ฝ๐—ฟ๐—ถ๐˜€๐—ฒ-๐—ด๐—ฟ๐—ฎ๐—ฑ๐—ฒ ๐˜€๐—ฒ๐—ฐ๐˜‚๐—ฟ๐—ถ๐˜๐˜† & ๐—ฐ๐—ผ๐—บ๐—ฝ๐—น๐—ถ๐—ฎ๐—ป๐—ฐ๐—ฒ: SOC 2 Type II, ISO 27001 certified, HIPAA compliant, GDPR-ready. Snowflake Technology Partner and Google Cloud Ready โ€“ BigQuery. Astrato is used by data teams, product teams, and analytics leaders across SaaS companies, data businesses, agencies, and enterprises. Pricing is structured to scale with embedded use cases involving large numbers of external users.

Average Rating: 4.7/5.0

Total Reviews: 24

How Do G2 Users Rate Astrato?

  • Has the product been a good partner in doing business?: 10.0/10 (Category avg: 9.2/10)
  • Steps to Answer: 8.6/10 (Category avg: 8.4/10)
  • Reports Interface: 9.5/10 (Category avg: 8.8/10)
  • Calculated Fields: 9.0/10 (Category avg: 8.5/10)

Who Is the Company Behind Astrato?

Who Uses This Product?

  • Company Size: 40% Medium, 32% Small

What Do G2 Reviewers Say About Astrato?

AI-generated summary from verified user reviews

Pros
  • Users praise the ease of use of Astrato, highlighting its intuitive design and minimal dependency on technical resources.
  • Users commend the exceptional customer support of Astrato, enhancing usability and reducing the learning curve effectively.
  • Users love the seamless integration with Snowflake, enabling quick setup and efficient analytics workflows.
  • Users value the easy, user-friendly learning experience of Astrato, enabling quick mastery and effective data exploration.
  • Users value the dashboard customization of Astrato, enabling easy and flexible solutions for non-technical professionals.
Cons
  • Users note the missing features in Astrato hinder functionality compared to more established tools, affecting overall user experience.
  • Users report encountering bugs and usability issues with Astrato, complicating their experience and affecting efficiency.
  • Users find that complex data modeling in Astrato can be challenging, requiring significant expertise for optimal results.
  • Users note that Astrato's complex usage can be challenging, especially with bugs and less intuitive features compared to established tools.
  • Users find that Astrato has a steep learning curve due to bugs and usability challenges compared to established tools.

What Are Recent G2 Reviews of Astrato?

ILUM

Ilum: A Data Platform Built by Data Engineers, for Data Engineers Ilum is a Data Lakehouse platform that unifies data management, distributed processing, analytics, and AI workflows for AI engineers, data engineers, data scientists, and analysts. It belongs to the Data Platform, Data Lakehouse, and Data Engineering software categories and supports flexible deployment across cloud, on-premise, and hybrid environments. Ilum enables technical teams to build, operate, and scale modern data infrastructure using open standards. It integrates tools for batch processing, stream processing, notebook-based exploration, workflow orchestration, and business intelligence, All In a Single Platform. Ilum supports modern open table formats like Delta Lake, Apache Iceberg, Apache Hudi, and Apache Paimon. It also offers native integration with Apache Spark and Trino for compute, with Apache Flink support currently in development. Key features include: - SQL Editor: Query Delta, Iceberg, Hudi, or Spark SQL with autocomplete, result previews, and metadata inspection. - Data Lineage & Catalog: Visualize data flow using OpenLineage and explore datasets through a searchable Data Catalog. - Notebook Integration: Use built-in Jupyter notebooks pre-wired to Spark, metadata, and your data environment for exploration or modeling. - Spark Job Management: Submit, monitor, and debug Spark jobs with integrated logs, metrics, scheduling, and a built-in Spark History Server. - Trino Support: Run federated queries across multiple data sources using Trino directly from within Ilum. - Declarative Pipelines: Define repeatable ETL and analytics pipelines, with dependency tracking and recovery logic. - Automatic ERD Diagrams: Instantly generate ER diagrams from schemas to aid in data understanding and onboarding. - ML Experimentation & Tracking: Includes MLflow for managing experiments, tracking parameters, metrics, and artifacts, fully integrated with notebooks and data pipelines to streamline model development workflows. - AI Integration & Deployment: Supports both classical ML and modern AI use cases, including GenAI workflows, vector search, and embedding-based applications. Models can be registered, versioned, and deployed for inference within declarative pipelines. - Built-in AI Agent Interface: Ilum integrates, providing a GPT-style interface to interact with your data, trigger pipelines, generate SQL, or explore metadata using natural language, bringing GenAI capabilities directly into your data platform. - BI Dashboards: Native support for Apache Superset, with JDBC integration for Tableau, Power BI, and other BI tools. Additional highlights: - Multi-Cluster Management: Connect multiple Spark or Kubernetes clusters to scale and isolate workloads. - Fine-Grained Access Control: LDAP, OAuth2, and Hydra integration for secure, role-based access. - Hybrid Ready: Designed to replace Databricks or Cloudera in environments where cloud adoption is partial, regulated, or not possible.

Average Rating: 4.9/5.0

Total Reviews: 23

How Do G2 Users Rate ILUM?

  • Has the product been a good partner in doing business?: 9.7/10 (Category avg: 9.2/10)
  • Steps to Answer: 9.8/10 (Category avg: 8.4/10)
  • Reports Interface: 10.0/10 (Category avg: 8.8/10)
  • Calculated Fields: 9.8/10 (Category avg: 8.5/10)

Who Is the Company Behind ILUM?

  • Seller: Ilum
  • Company Website:
  • Year Founded: 2019
  • HQ Location: Santa Fe, US
  • Twitter: @IlumCloud
    19 Twitter followers
  • LinkedInยฎ Page: www.linkedin.com
    4 employees on LinkedInยฎ

Who Uses This Product?

  • Top Industries: Telecommunications
  • Company Size: 52% Large, 35% Medium

What Do G2 Reviewers Say About ILUM?

AI-generated summary from verified user reviews

Pros
  • Users praise ILUM for its ease of use, with a clean UI and quick deployment enhancing productivity and workflow.
  • Users praise ILUM for its seamless integration, user-friendly interface, and excellent customer support, streamlining data management effectively.
  • Users value the seamless integrations of ILUM, enhancing productivity by connecting various systems and streamlining workflows.
  • Users love the ease of setup with ILUM, noting quick deployments and user-friendly interfaces that enhance productivity.
  • Users value the easy integrations of ILUM, enhancing their data workflows and simplifying complex processes effortlessly.
Cons
  • Users note that the complex setup of ILUM can be challenging, requiring time and effort to configure properly.
  • Users note the difficult setup of ILUM, requiring experimentation and digging for advanced configurations and integrations.
  • Users note the steep learning curve for new users, though intuitive daily use improves after initial setup.
  • Users note that the UX could be improved with more intuitive navigation and clearer configuration options.
  • Users find ILUM's complexity in advanced configurations may require time and effort to fully navigate and optimize.

What Are Recent G2 Reviews of ILUM?

Tian Lin
TL
Researched and written by Tian Lin
Updated July 2, 2025