Best Analytics Platforms for Medium-Sized Businesses - Page 4

How Many Analytics Platforms Products Does G2 Track?

Total Products under this Category: 607

Category Stats (Oct 2026)

  • Average Rating: 4.52/5 (↑0.01 vs Sep 2026) The average rating of products in this category, based on all submitted ratings
  • Top Trending Product: inzicht (+3.71%) - Among all products in this category, inzicht recorded the largest rating increase compared to last month

Last updated: October 13, 2026

How Does G2 Rank Analytics Platforms Products?

Why You Can Trust G2's Software Rankings:

  • 30 Analysts and Data Experts
  • 29,800+ Authentic Reviews
  • 607+ Products
  • Unbiased Rankings

G2's software rankings are built on verified user reviews, rigorous moderation, and a consistent research methodology maintained by a team of analysts and data experts. Each product is measured using the same transparent criteria, with no paid placement or vendor influence. While reviews reflect real user experiences, which can be subjective, they offer valuable insight into how software performs in the hands of professionals. Together, these inputs power the G2 Score, a standardized way to compare tools within every category.

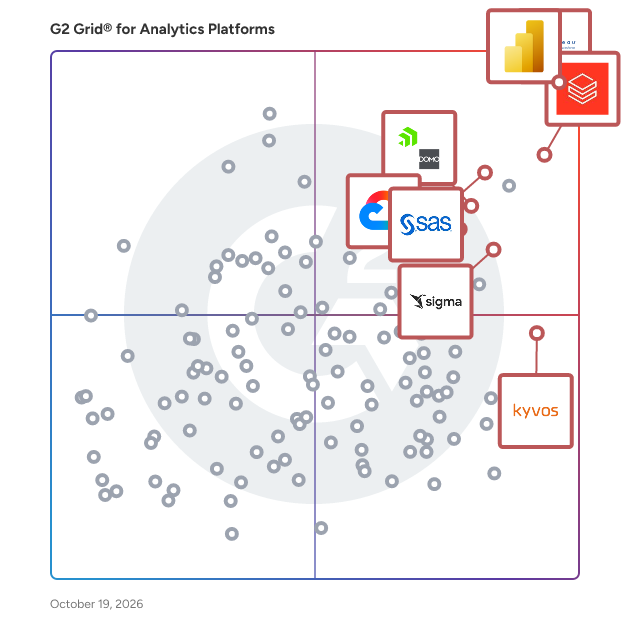
G2 Grid® for Analytics Platforms

G2 Grid® for Analytics Platforms plotting products by satisfaction and market presence

Highlighted products: Tableau, Microsoft Power BI, Databricks, Domo, Sigma, Looker, SAS Viya, and Kyvos Semantic Layer.

Underlying data: [Grid® JSON](https://www.g2.com/categories/analytics-platforms/grids.json?focus%5B%5D=tableau&focus%5B%5D=microsoft-microsoft-power-bi&focus%5B%5D=databricks&focus%5B%5D=domo&focus%5B%5D=sigma-computing-sigma&focus%5B%5D=looker&focus%5B%5D=sas-sas-viya&focus%5B%5D=kyvos-semantic-layer&segment=mid-market)

Bold BI

Bold BI® by Syncfusion® is a modern, flexible analytics platform that empowers everyone—from business users to developers—to turn raw data into meaningful insights, fast. Whether you're embedding analytics into your application or building dashboards from scratch, Bold BI makes it easy to deliver powerful, interactive data experiences without compromising on performance or security. With an intuitive no-code, drag-and-drop interface, even non-technical users can create stunning dashboards in minutes. Meanwhile, developers enjoy deep customization through robust APIs, SDKs, and white-labeling options, making it simple to integrate analytics seamlessly into any application. With support for 130+ data sources, including Microsoft SQL Server, Azure SQL Data Warehouse, Oracle, REST APIs, Bold Datahub, and more, Bold BI offers unmatched data flexibility and connectivity. Designed for secure, scalable deployments, the platform’s multi-tenant architecture and enterprise-grade security features single sign-on (SSO) via OAuth2 and OpenID and role-based access control to ensure data protection and simplified user management. Real-time dashboard sharing, scheduled alerts, and export options make collaboration effortless, helping teams stay aligned and make faster, data-driven decisions. Backed by Syncfusion, Bold BI offers end-to-end expert support, ideal for organizations looking to scale their analytics. Customers benefit from 24/5 assistance through free scheduled support calls, live chat, and email—from onboarding to full implementation. NOTE: Older reviews may reference the historical product name, "Syncfusion Dashboard Platform."

Average Rating: 4.4/5.0

Total Reviews: 89

How Do G2 Users Rate Bold BI?

  • Has the product been a good partner in doing business?: 8.9/10 (Category avg: 9.2/10)
  • Steps to Answer: 7.9/10 (Category avg: 8.4/10)
  • Reports Interface: 8.4/10 (Category avg: 8.8/10)
  • Calculated Fields: 8.3/10 (Category avg: 8.5/10)

Who Is the Company Behind Bold BI?

  • Seller: Syncfusion
  • Company Website:
  • Year Founded: 2001
  • HQ Location: Morrisville, North Carolina
  • Twitter: @Syncfusion
    11,907 Twitter followers
  • LinkedIn® Page: www.linkedin.com
    2,739 employees on LinkedIn®

Who Uses This Product?

  • Top Industries: Computer Software, Information Technology and Services
  • Company Size: 51% Small, 32% Medium

What Do G2 Reviewers Say About Bold BI?

AI-generated summary from verified user reviews

Pros
  • Users highlight the exceptional customer support from Bold BI, noting quick resolutions and expert guidance throughout the process.
  • Users value the ease of use of Bold BI, enjoying a seamless experience for all skill levels.
  • Users value the easy integration with numerous data sources, enhancing their analytics capabilities effortlessly.
  • Users praise the drag-and-drop dashboard customization, enabling quick and impressive dashboard creation without coding skills.
  • Users value the seamless embedding capabilities of Bold BI, facilitating integration within various applications and portals.
Cons
  • Users frequently encounter bugs with Bold BI, particularly evident during version updates and when using Docker and Kubernetes.
  • Users find the learning curve steep, requiring technical knowledge and tutorials for effective setup and usage.
  • Users find the difficult setup of Bold BI time-consuming, requiring tutorials and technical knowledge for advanced features.
  • Users report encountering numerous software bugs in Bold BI, especially during updates and with Docker and Kubernetes integrations.
  • Users note the dashboard issues with lengthy setup times and a complex learning curve for advanced features.

What Are Recent G2 Reviews of Bold BI?

What Are G2 Users Discussing About Bold BI?

Teradata Autonomous Knowledge Platform

Teradata Autonomous Knowledge Platform activates enterprise intelligence by unifying data, knowledge and business context to achieve tangible outcomes. With Teradata, organizations can provide agents with full context for impact when it matters. Our solution lets businesses connect and scale on premises, in the cloud, or through a hybrid approach. Teradata delivers real business value with AI. Learn more at Teradata.com.

Average Rating: 4.3/5.0

Total Reviews: 354

How Do G2 Users Rate Teradata Autonomous Knowledge Platform?

  • Has the product been a good partner in doing business?: 8.2/10 (Category avg: 9.2/10)
  • Steps to Answer: 8.1/10 (Category avg: 8.4/10)
  • Reports Interface: 7.7/10 (Category avg: 8.8/10)
  • Calculated Fields: 8.4/10 (Category avg: 8.5/10)

Who Is the Company Behind Teradata Autonomous Knowledge Platform?

Who Uses This Product?

  • Who Uses This: Data Engineer, Software Engineer
  • Top Industries: Information Technology and Services, Financial Services
  • Company Size: 69% Large, 22% Medium

What Do G2 Reviewers Say About Teradata Autonomous Knowledge Platform?

AI-generated summary from verified user reviews

Pros
  • Users highlight the extreme performance of Teradata Autonomous Knowledge Platform, emphasizing its speed in processing large data volumes.
  • Users value the high performance and scalability of Teradata for handling complex queries and data integration.
  • Users value the scalability of Teradata Autonomous Knowledge Platform, seamlessly integrating and managing vast data resources efficiently.
  • Users commend the extreme performance of Teradata, highlighting its speed in processing large datasets seamlessly.
  • Users value the fast processing of large datasets in Teradata, appreciating its stability and integration capabilities.
Cons
  • Users identify a steep learning curve for Teradata Autonomous Knowledge Platform, hindering new user adaptation and productivity.
  • Users find the steep learning curve of Teradata Autonomous Knowledge Platform challenging, especially for those less technically inclined.
  • Users find the complexity of the Teradata platform challenging, especially for non-technical users and new adopters.
  • Users struggle with the cost transparency of Teradata Autonomous Knowledge Platform, needing close management to avoid issues.
  • Users express concerns about the high cost of the Teradata Autonomous Knowledge Platform, highlighting affordability issues.

What Are Recent G2 Reviews of Teradata Autonomous Knowledge Platform?

What Are G2 Users Discussing About Teradata Autonomous Knowledge Platform?

Cloudera

Cloudera is the only hybrid data and AI platform company that large organizations trust to bring AI to their data anywhere it lives. Unlike other providers, Cloudera delivers a consistent cloud experience that converges public clouds, on-prem data centers, and the edge, leveraging a proven open-source foundation. As the pioneer in big data, Cloudera empowers businesses to apply AI and assert control over 100% of their data, in all forms, improving security, governance, and real-time and predictive insights. The world’s largest brands across all industries rely on Cloudera to transform decision-making and ultimately boost bottom lines, safeguard against threats, and save lives. Cloudera Anywhere Cloud™: Build and scale applications across any environment. The modular hybrid data and AI platform engineered for the agentic era empowers teams to deploy production-grade data and AI workloads across multi-cloud, on-premises, and sovereign environments while maintaining digital sovereignty. The Cloudera data and AI platform includes: Cloudera AI: Deploy and scale any AI model, anywhere. Cloudera brings compute to governed data where it lives for Private AI anywhere by design. Complete control, security, and governance of mission-critical data, models, agents, and inference ensure faster sovereign AI deployments. Cloudera Data-in-Motion: Make fast decisions from real-time data anywhere. Move data with any structure from any source to any destination seamlessly across hybrid environments, enabling in-the-moment business-critical decisions by processing and analyzing real-time data anywhere, from the edge to AI, as business happens. Cloudera Open Data Lakehouse: Process any data, anywhere, for actionable insights. Make smart decisions with an open data lakehouse powered by Apache Iceberg that delivers trusted, reliable, and unified data to fuel agents, AI applications, and analytics, improving collaboration, breaking silos, and simplifying sharing. Cloudera Unified Data Fabric: Unify security and governance across the entire data estate. Move beyond fragmented data management: Break down silos and connect disparate data sources intelligently and securely to provide a unified view of all organizational data and centralized end-to-end control across complex hybrid data environments.

Average Rating: 4.2/5.0

Total Reviews: 199

How Do G2 Users Rate Cloudera?

  • Has the product been a good partner in doing business?: 8.5/10 (Category avg: 9.2/10)
  • Steps to Answer: 6.1/10 (Category avg: 8.4/10)
  • Reports Interface: 7.1/10 (Category avg: 8.8/10)
  • Calculated Fields: 6.2/10 (Category avg: 8.5/10)

Who Is the Company Behind Cloudera?

  • Seller: Cloudera
  • Company Website:
  • Year Founded: 2008
  • HQ Location: Santa Clara, CA
  • Twitter: @cloudera
    106,442 Twitter followers
  • LinkedIn® Page: www.linkedin.com
    3,505 employees on LinkedIn®

Who Uses This Product?

  • Who Uses This: Data Engineer, Software Engineer
  • Top Industries: Information Technology and Services, Banking
  • Company Size: 38% Large, 34% Small

What Do G2 Reviewers Say About Cloudera?

AI-generated summary from verified user reviews

Pros
  • Users praise the user-friendly interface of Cloudera, highlighting its simplicity in managing big data efficiently.
  • Users value the easy scalability of Cloudera, enabling efficient management of large amounts of data effortlessly.
  • Users value the robust security features of Cloudera, ensuring safe and reliable data management across platforms.
  • Users value the comprehensive suite of tools in Cloudera for effective data management and analytics.
  • Users find Cloudera's scalability and centralized administration invaluable for efficient monitoring and management of data processes.
Cons
  • Users express concerns over the high costs of Cloudera, noting it's expensive for its complexity and maintenance.
  • Users find Cloudera's database to be complex, making it challenging for inexperienced professionals to utilize effectively.
  • Users find Cloudera's setup difficult to learn, particularly challenging for beginners without adequate tutorials or guidance.
  • Users find the poor documentation of Cloudera frustrating, complicating navigation and setup for complex data configurations.
  • Users often face access issues with Cloudera, particularly with unauthorized errors in Airflow tasks and limited documentation.

What Are Recent G2 Reviews of Cloudera?

What Are G2 Users Discussing About Cloudera?

AI can help you find the answers. G2 helps you trust them.

Connect G2 to Claude or ChatGPT for answers grounded in G2's trusted reviews, comparisons, and pricing from real user insights.

How it works

ThoughtSpot

ThoughtSpot is the Agentic Analytics Platform company for the enterprise. With natural language and AI, ThoughtSpot empowers everyone in an organization to ask data questions, get answers, and take action. Code-first for data teams and code-free for business users, ThoughtSpot is intuitive enough for anyone to use, yet built to handle large, complex cloud data at scale. Customers like Coca-Cola, Hilton Worldwide, and Capital One are unlocking the full potential of their data with ThoughtSpot.

Average Rating: 4.4/5.0

Total Reviews: 331

How Do G2 Users Rate ThoughtSpot?

  • Has the product been a good partner in doing business?: 8.9/10 (Category avg: 9.2/10)
  • Steps to Answer: 8.6/10 (Category avg: 8.4/10)
  • Reports Interface: 8.6/10 (Category avg: 8.8/10)
  • Calculated Fields: 8.2/10 (Category avg: 8.5/10)

Who Is the Company Behind ThoughtSpot?

  • Seller: ThoughtSpot
  • Company Website:
  • Year Founded: 2012
  • HQ Location: Mountain View, CA
  • Twitter: @thoughtspot
    10,975 Twitter followers
  • LinkedIn® Page: www.linkedin.com
    1,781 employees on LinkedIn®

Who Uses This Product?

  • Who Uses This: Data Analyst
  • Top Industries: Information Technology and Services, Computer Software
  • Company Size: 44% Large, 43% Medium

What Do G2 Reviewers Say About ThoughtSpot?

AI-generated summary from verified user reviews

Pros
  • Users appreciate the ease of use of ThoughtSpot, finding it simple to create insights and build visuals.
  • Users value the real-time insights from ThoughtSpot, enhancing organizational growth through accurate and actionable data analysis.
  • Users value ThoughtSpot for its powerful analytics capabilities that enhance data insights and engagement tracking.
  • Users praise the intuitive interface of ThoughtSpot, enabling effortless data exploration and insights for everyone.
  • Users appreciate the excellent data visualization capabilities of ThoughtSpot, making insights easy to understand and validate.
Cons
  • Users acknowledge a steep learning curve for new features, particularly for those unfamiliar with analytics or data visualization.
  • Users note the missing features in ThoughtSpot, such as limited reusability and underwhelming visualization capabilities.
  • Users find the complexity of ThoughtSpot frustrating, with formulas failing and a lack of intuitive guidance.
  • Users face a learning difficulty with ThoughtSpot, finding it non-intuitive and lacking clear guidance for effective use.
  • Users find the limited customization options in ThoughtSpot restrictive, impacting their ability to tailor visualizations effectively.

What Are Recent G2 Reviews of ThoughtSpot?

What Are G2 Users Discussing About ThoughtSpot?

Savant Labs

Savant is an AI workflow automation platform built for enterprise finance, tax, and accounting teams. It turns messy, manual data work like extraction, preparation, reconciliation, and reporting into centrally governed, audit-ready workflows, driving efficiency without sacrificing accuracy, control, or compliance. Savant integrates with your preferred LLM, including Claude, Copilot, ChatGPT, and private LLMs, so you control model choice, data residency, and cost. Ask in plain language for the workflow you want to build, or simply say "run this month's reconciliation," and Savant turns that instruction into a repeatable, governed, auditable workflow. Trusted by Fortune 500 enterprises, Savant catches errors before they're filed, ensures audit readiness without the scramble, and gives finance teams their time back. WHAT SETS SAVANT APART Unlike general-purpose AI tools or legacy analytics platforms, Savant was built specifically for finance workflows where 99% accuracy isn't good enough — because 1% errors at scale become audit findings, restatements, and compliance exposure. Three things make Savant different - Deterministic, not probabilistic: Savant uses rule-based AI agents, not LLM guesses. Consistent inputs produce consistent outputs. - Governance and auditability are built in, not bolted on: Audit trail, data lineage, SOX controls, role-based access, and evidence packs are standard, not add-ons. - Handles the data other tools can't: Native processing for PDFs, scanned documents, and invoices — the unstructured data that breaks legacy workflows. KEY FEATURES - AI-powered workflow automation: Automate any workflow end to end — financial reconciliation, month-end close, tax provisioning, accruals, and more. Works with structured and unstructured data, including PDFs, scanned documents, and ERP extracts. - Reproducible results: AI agents follow step-by-step logic with validation at each stage. Same inputs produce the same outputs, every time — no black boxes, no probabilistic guesses. - Built-in audit trail, data lineage, and evidence packs: Every workflow step is logged automatically. Complete data lineage from source to output. No manual documentation, no reconstructing steps across email chains. - SOX compliance by design: Segregation of duties, version control, approval management, and user activity history are built in from day one. - Human-in-the-loop exception handling: Savant proactively flags exceptions for human review, allowing analysts to catch errors before they reach a filing. The AI learns from human judgments over time. - 500+ enterprise connectors: Connect to your existing ERPs, CRMs, BI platforms, file systems, email, and more out of the box. - Enterprise-grade security: SOC 2 Type II, SOC 1 Type II, ISO 27001. SSO/SAML, role-based access control, private cloud and VPC deployment available. USE CASES - Month-end and year-end close automation - Financial reconciliations and tie-outs - Tax provision preparation - State apportionment calculations - Sales and use tax reconciliation - Data extraction from PDFs, invoices, and scanned documents - ERP data consolidation across multiple systems - Intercompany accounting and multi-entity reporting - Audit evidence package preparation - Recurring reporting and dashboard publishing

Average Rating: 4.7/5.0

Total Reviews: 51

How Do G2 Users Rate Savant Labs?

  • Has the product been a good partner in doing business?: 9.8/10 (Category avg: 9.2/10)
  • Steps to Answer: 8.8/10 (Category avg: 8.4/10)
  • Reports Interface: 8.4/10 (Category avg: 8.8/10)
  • Calculated Fields: 9.3/10 (Category avg: 8.5/10)

Who Is the Company Behind Savant Labs?

  • Seller: Savant Labs
  • Company Website:
  • Year Founded: 2021
  • HQ Location: San Francisco, California
  • LinkedIn® Page: www.linkedin.com
    66 employees on LinkedIn®

Who Uses This Product?

  • Top Industries: Computer Software, Logistics and Supply Chain
  • Company Size: 42% Large, 40% Medium

What Do G2 Reviewers Say About Savant Labs?

AI-generated summary from verified user reviews

Pros
  • Users commend the ease of use in Savant Labs, enabling seamless analytics without requiring extensive knowledge.
  • Users appreciate the friendly customer support from Savant Labs, which provides timely assistance for any issues encountered.
  • Users praise the user-friendly interface of Savant Labs, making complex data analytics accessible to everyone.
  • Users enjoy the easy integration capabilities of Savant Labs, simplifying workflows and enhancing data connectivity effortlessly.
  • Users appreciate the scalability of Savant Labs, enjoying its straightforward integration and user-friendly interface.
Cons
  • Users note a steep learning curve with Savant Labs, often struggling with data source updates and tool integration.
  • Users experience a steep learning curve with Savant Labs, making it challenging to master effectively.
  • Users often face integration issues, struggling with data updates and lacking clear instructions for linking tools effectively.
  • Users face access issues with Savant Labs, struggling to log in and navigate complex features and tools.
  • Users face data management challenges, struggling with updating sources and lack of clear guidance in Savant Labs.

What Are Recent G2 Reviews of Savant Labs?

KNIME

KNIME helps everybody make sense of data. Its free and open source KNIME Analytics Platform enables anyone — whether they come from a business, technical or data background — to intuitively work with data, every day. KNIME Business Hub is the commercial complement to KNIME Analytics Platform and enables users to collaborate on data science and share insights across the organization. Together, the products support the complete data science lifecycle, allowing teams at all levels of analytics readiness to support the operationalization of data and to build a scalable data science practice.

Average Rating: 4.5/5.0

Total Reviews: 125

How Do G2 Users Rate KNIME?

  • Has the product been a good partner in doing business?: 8.5/10 (Category avg: 9.2/10)
  • Steps to Answer: 8.2/10 (Category avg: 8.4/10)
  • Reports Interface: 8.3/10 (Category avg: 8.8/10)
  • Calculated Fields: 8.9/10 (Category avg: 8.5/10)

Who Is the Company Behind KNIME?

  • Seller: KNIME
  • Company Website:
  • Year Founded: 2008
  • HQ Location: Zurich, Switzerland
  • Twitter: @knime
    7,998 Twitter followers
  • LinkedIn® Page: www.linkedin.com
    245 employees on LinkedIn®

Who Uses This Product?

  • Top Industries: Information Technology and Services, Higher Education
  • Company Size: 43% Large, 31% Medium

What Do G2 Reviewers Say About KNIME?

AI-generated summary from verified user reviews

Pros
  • Users find KNIME's ease of use enhances productivity, enabling even non-technical individuals to build workflows effortlessly.
  • Users find KNIME's coding ease remarkable, enabling effortless workflows without requiring extensive technical skills.
  • Users find KNIME to be an easy-to-learn platform, enabling quick workflow creation without coding skills.
  • Users find KNIME easy to learn and start delivering results, thanks to its intuitive visual workflow interface.
  • Users love the easy and intuitive data visualization capabilities of KNIME, enhancing understanding and communication of data insights.
Cons
  • Users find the initial learning curve challenging, especially for those unfamiliar with data science concepts and visual programming.
  • Users face memory usage issues with KNIME, leading to slow performance, especially with larger files and operations.
  • Users report storage limitations with KNIME, leading to performance issues and difficulties with large datasets.
  • Users note that data management issues hinder their experience, especially with file handling and certain databases.
  • Users find the lack of learning resources for KNIME to be a significant barrier to effective usage.

What Are Recent G2 Reviews of KNIME?

What Are G2 Users Discussing About KNIME?

Klipfolio

Klipfolio Klips is a dashboard and reporting platform that lets you build real-time, pixel-perfect data visualizations and distribute powerful custom dashboards and reports. It allows teams and businesses to connect, model, and visualize data from multiple sources in one place, helping your team or your clients make informed, data-driven decisions. Product Category Klips falls under the category of business intelligence and dashboard software, specifically designed to create dynamic, customizable data visualizations. It focuses on empowering small and mid-sized businesses with accessible, real-time analytics to unify their data for better insights and performance tracking. Klipfolio Klips is ideal for: - Small and Mid-Sized Businesses: Teams looking for a cost-effective way to gain actionable insights and improve decision-making with custom dashboards. - Data Analysts: Professionals who need flexible tools to model, visualize, and distribute metrics to stakeholders. - Client-Focused Organizations: Agencies or teams who want to create professional, branded dashboards for their clients. Klipfolio Klips helps businesses gain a single source of truth for their data with: - Real-Time Dashboards: Build highly customizable dashboards that update in real-time to track business performance. - Wide Data Integration: Connect to hundreds of services, APIs, databases, and spreadsheets for seamless data aggregation. - Data Modeling Tools: Transform, combine, and format data within Klipfolio to prepare it for analysis. - Customizable Visualizations: Create pixel-perfect charts, graphs, and visualizations tailored to your unique needs. - Accessible Reports: Share insights through PDF reports, scheduled emails, or published dashboard links for external access. - With Klips, teams can centralize their data, ensure consistency, and access insights anytime, anywhere, helping them make smarter, more informed decisions.

Average Rating: 4.5/5.0

Total Reviews: 240

How Do G2 Users Rate Klipfolio?

  • Has the product been a good partner in doing business?: 9.3/10 (Category avg: 9.2/10)
  • Steps to Answer: 8.4/10 (Category avg: 8.4/10)
  • Reports Interface: 8.9/10 (Category avg: 8.8/10)
  • Calculated Fields: 8.5/10 (Category avg: 8.5/10)

Who Is the Company Behind Klipfolio?

  • Seller: Klipfolio
  • Year Founded: 2001
  • HQ Location: Ottawa, ON
  • Twitter: @klipfolio
    4,430 Twitter followers
  • LinkedIn® Page: www.linkedin.com
    21 employees on LinkedIn®

Who Uses This Product?

  • Who Uses This: Data Analyst
  • Top Industries: Marketing and Advertising, Computer Software
  • Company Size: 55% Small, 36% Medium

What Do G2 Reviewers Say About Klipfolio?

AI-generated summary from verified user reviews

Pros
  • Users enjoy the smooth integration capabilities of Klipfolio, enhancing data connectivity and user experience.
  • Users value the responsive customer support of Klipfolio, ensuring quick assistance whenever needed.
  • Users find Klipfolio to be incredibly easy to understand, making data visualization effortless and efficient.
  • Users value the ease of use of Klipfolio, benefiting from quick setup and responsive support.
  • Users appreciate the intuitive design and clean UI of Klipfolio, enhancing their overall experience and integrations.
Cons
  • Users find the limited chart functionality of Klipfolio restricts options compared to more advanced tools like Power BI.

What Are Recent G2 Reviews of Klipfolio?

What Are G2 Users Discussing About Klipfolio?

Spotfire Analytics

Spotfire® is a visual data science platform designed to help organizations address complex, industry-specific challenges by effectively utilizing data. This solution offers a range of flexible packaging options tailored to meet the diverse needs of teams at various stages of their visual data science journey. Turn raw data into real-time decisions with powerful, interactive visual analytics with Spotfire® Analytics. Spotfire Analytics is designed for business agility, enabling every user to explore data visually, uncover patterns quickly, and make confident, data-driven decisions without writing a single line of code. As a self-service visual data science solution, it empowers teams across roles and departments to gain fast, actionable insights that drive impact. With its no-code interactive dashboards and rich visual exploration capabilities, Spotfire Analytics connects natively to hundreds of cloud, on-premises, and real-time data sources. Built-in geoanalytics extend the power of analysis with multi-layer mapping and seamless integration of spatial data, while data wrangling and transformation can be performed directly within the visual interface, making it easy to clean, shape, and blend data as you analyze. AI-assisted recommendations and anomaly detection help uncover hidden patterns, suggest the most meaningful visualizations, and accelerate the path to discovery. Customizable visualizations, workflows, and an intuitive interface ensure that insights are not only easier to create but also easier to share. With seamless collaboration features, Spotfire Analytics enables teams to work together, align on insights, and act decisively. Whether the goal is to analyze trends, detect anomalies, or unlock location-based intelligence, Spotfire Analytics delivers the speed, flexibility, and depth needed to make smarter decisions with confidence. Explore and understand your data visually, uncover hidden insights, and build powerful analytics applications - all without writing a single line of code. Spotfire Analytics combines advanced interactive visualizations and intuitive data wrangling in one environment. Connect to hundreds of data sources, from files to real-time streaming data, and transform messy data directly within your visuals. Built-in AI recommendations help you find patterns, anomalies, and trends faster. With flexible visualizations, spatial analytics, and custom applications, anyone can turn raw data into actionable insights in minutes. Designed for business agility, Spotfire Analytics empowers every user to explore, analyze, and share results confidently - turning questions into decisions. Best for: Analysts, data-savvy professionals, and teams looking to explore and share data visually with maximum flexibility.

Average Rating: 4.2/5.0

Total Reviews: 328

How Do G2 Users Rate Spotfire Analytics?

  • Has the product been a good partner in doing business?: 8.4/10 (Category avg: 9.2/10)
  • Steps to Answer: 7.9/10 (Category avg: 8.4/10)
  • Reports Interface: 8.3/10 (Category avg: 8.8/10)
  • Calculated Fields: 8.5/10 (Category avg: 8.5/10)

Who Is the Company Behind Spotfire Analytics?

Who Uses This Product?

  • Who Uses This: Student, Manager
  • Top Industries: Oil & Energy, Information Technology and Services
  • Company Size: 52% Large, 26% Medium

What Do G2 Reviewers Say About Spotfire Analytics?

AI-generated summary from verified user reviews

Pros
  • Users appreciate the powerful and flexible data visualization capabilities of Spotfire Analytics, enhancing their data exploration experience.
  • Users appreciate the ease of use of Spotfire Analytics, enabling quick insights and effective decision-making with complex data.
  • Users love the transformative interactive visualizations of Spotfire, simplifying complex data for clear understanding across teams.
  • Users appreciate the easy integrations of Spotfire Analytics, enhancing accuracy and enabling robust AI-powered analytics seamlessly.
  • Users rave about Spotfire's powerful analytics capabilities, enabling advanced data handling and insightful visualizations seamlessly.
Cons
  • Users find Spotfire's steep learning curve challenging, particularly for those unfamiliar with data modeling and scripting.
  • Users find the learning difficulty significant, especially for beginners navigating advanced features and options in Spotfire.
  • Users find the licensing costs high, making Spotfire Analytics less accessible for smaller organizations.
  • Users find the steep learning curve of Spotfire Analytics challenging, especially regarding advanced features and user interface.
  • Users often face a steep learning curve with Spotfire Analytics, making initial use challenging for newcomers.

What Are Recent G2 Reviews of Spotfire Analytics?

What Are G2 Users Discussing About Spotfire Analytics?

Discern

Successful businesses are founded on exceptional execution, which is driven by a deep understanding of key performance indicators (KPIs) and data insights. Achieving data clarity is challenging when sales, marketing, customer, billing, and financial data are siloed across disconnected systems and spreadsheets. Enter Discern. We automate the heavy lifting of business performance analytics, such as pipeline tracking, ARR, NRR analytics, and marketing attribution, turning what used to be days of manual reconciliation or years of BI builds into automated, real-time insights. No more wrestling with spreadsheets or questioning your numbers – just clear, consistent performance data you can trust. But we didn't stop there. Because in this new environment, understanding your own performance is only half the story. You also need industry context – and we're not talking about stale benchmarks released annually, but rather straight-from-the-source benchmarks that pick up on market changes just as they begin to manifest. Whether you're running team meetings, fine-tuning your strategy, prepping for a big board meeting, or pitching new investors, Discern helps you operate with confidence. Our combination of automated performance analytics and real-time, system-validated benchmarks gives you the complete story behind your performance, so you can focus on making the decisions that matter.

Average Rating: 4.8/5.0

Total Reviews: 21

How Do G2 Users Rate Discern?

  • Has the product been a good partner in doing business?: 9.9/10 (Category avg: 9.2/10)
  • Steps to Answer: 7.3/10 (Category avg: 8.4/10)
  • Reports Interface: 8.0/10 (Category avg: 8.8/10)
  • Calculated Fields: 7.2/10 (Category avg: 8.5/10)

Who Is the Company Behind Discern?

Who Uses This Product?

  • Top Industries: Computer Software
  • Company Size: 86% Medium, 14% Small

What Do G2 Reviewers Say About Discern?

AI-generated summary from verified user reviews

Pros
  • Users find Discern to be incredibly easy to use, dramatically simplifying marketing funnel reporting and data analysis.
  • Users value the responsive customer support from Discern, enhancing implementation and driving successful outcomes seamlessly.
  • Users commend the implementation ease of Discern, enabling rapid reporting and enhanced efficiency in data handling.
  • Users value the time-saving data handling of Discern, allowing quick insights instead of tedious reporting processes.
  • Users find Discern's analytics capabilities invaluable for real-time performance tracking and data-driven decision-making.
Cons
  • Users find data inaccuracy in Discern, particularly with metrics that confuse executives without proper context.
  • Users find the complexity of metrics in Discern overwhelming, especially for those lacking technical expertise.
  • Users find the complex usage of Discern challenging, especially those lacking technical expertise or data analysis knowledge.
  • Users find the lack of detail in Discern's metrics makes it difficult for executives to comprehend fully.
  • Users find the learning curve steep due to complex metrics and the need for technical knowledge to navigate Discern.

What Are Recent G2 Reviews of Discern?

Knowi

Knowi is the agentic analytics platform for teams whose data does not sit in one warehouse. Dashboards, AI agents, embedded analytics, and apps run in one place, on your data where it already lives, without any data movement. Knowi’s AI agents work inside the data layer, not as a chatbot on top of finished dashboards. They connect directly to schemas and the query engine, allowing teams to build queries, widgets, and dashboards from plain-English questions. What teams use Knowi for: 1. Unified data without ETL: Connect to any datasource- including SQL databases, MongoDB, Elasticsearch, Snowflake, Salesforce, and REST APIs, and join across them in a single query. 2. BI and dashboards: Build using a prompt or the visual builder, then share, schedule, and create alerts. 3. AI agents: Ask questions in plain English against a governed semantic layer controlled by the data team. 4. Embedded analytics: Add multi-tenant dashboards and widgets to your product with row-level access control. 5. Apps: Build operational apps on governed data where teams can see what is happening, understand why, and take action from one place. Knowi runs its own AI by default, with OpenAI and Claude available as optional integrations. It can be deployed in Knowi Cloud, your own VPC, on-premises, or in an air-gapped environment. Customers include Verizon, Telstra, Everbridge, and NJM Insurance.

Average Rating: 4.9/5.0

Total Reviews: 28

How Do G2 Users Rate Knowi?

  • Has the product been a good partner in doing business?: 9.7/10 (Category avg: 9.2/10)
  • Steps to Answer: 9.3/10 (Category avg: 8.4/10)
  • Reports Interface: 9.7/10 (Category avg: 8.8/10)
  • Calculated Fields: 9.0/10 (Category avg: 8.5/10)

Who Is the Company Behind Knowi?

  • Seller: Knowi
  • Company Website:
  • Year Founded: 2015
  • HQ Location: Oakland, California
  • Twitter: @knowico
    2,636 Twitter followers
  • LinkedIn® Page: www.linkedin.com
    22 employees on LinkedIn®

Who Uses This Product?

  • Company Size: 46% Small, 39% Medium

What Do G2 Reviewers Say About Knowi?

AI-generated summary from verified user reviews

Pros
  • Users value the exceptional customer support at Knowi, appreciating their responsiveness and tailored guidance throughout the onboarding process.
  • Users commend Knowi for its exceptional onboarding and proactive support, enhancing business growth and adapting to unique needs.
  • Users highlight Knowi's exceptional AI capabilities that enhance data analytics and reporting, ensuring a tailored experience.
  • Users appreciate the automation capabilities of Knowi, greatly simplifying data management and enhancing reporting efficiency.
  • Users appreciate the intuitive dashboarding features of Knowi, which simplify data management and save valuable time.
Cons
  • Users find the learning curve steep for Knowi, making initial setup challenging for advanced features and API connections.
  • Users feel there is a lack of guidance for API connections with popular platforms, complicating initial setup.
  • Users find a lack of tutorials for API connections, leading to a challenging setup experience with Knowi.

What Are Recent G2 Reviews of Knowi?

Easy Insight

Easy Insight provides affordable, easy to use SaaS business intelligence. Instant connections to other popular SaaS products such as Basecamp, Zendesk, and Salesforce come with prebuilt dashboards to get you up and running with immediate results. A simple report builder helps you quickly adjust or create any new reports from scratch in a variety of visualizations. When you're ready to move beyond connecting to one or two SaaS products, Easy Insight provides robust ETL capabilities within the product itself to help you import flat file or relational database data, transform and join the data with other data sources, and create everything from beautiful executive dashboards to detailed tables. Extensive and easy to use security features make it easy to limit which data your users can see, enabling you to take a single dashboard and present it differently to everyone in your organization. Each sales rep will see his own data and each project manager her own projects, all operating on that same core set of dashboards and dramatically reducing the cost of rework.

Average Rating: 4.8/5.0

Total Reviews: 42

How Do G2 Users Rate Easy Insight?

  • Has the product been a good partner in doing business?: 9.9/10 (Category avg: 9.2/10)
  • Steps to Answer: 8.0/10 (Category avg: 8.4/10)
  • Reports Interface: 8.1/10 (Category avg: 8.8/10)
  • Calculated Fields: 7.9/10 (Category avg: 8.5/10)

Who Is the Company Behind Easy Insight?

  • Seller: Easy Insight
  • Year Founded: 2008
  • HQ Location: Denver, CO
  • Twitter: @easyinsight
    513 Twitter followers
  • LinkedIn® Page: www.linkedin.com
    3 employees on LinkedIn®

Who Uses This Product?

  • Top Industries: Marketing and Advertising, Information Technology and Services
  • Company Size: 68% Small, 25% Medium

What Are Recent G2 Reviews of Easy Insight?

What Are G2 Users Discussing About Easy Insight?

InsightOut

InsightOut is a unified data analytics platform from Treehouse Technology Group that enables business teams to do more with their data. Business users can extract insights and value from their data in context and at scale, with self-service simplicity. Our end-to-end data solution aggregates, cleans, and blends fragmented data across departments — no matter the data source or volume — within a visual command center. With purpose-built dashboards and intuitive visualizations, users have a 360° view of the business and can independently manage and analyze data at the speed of thought, without reliance on IT. Beyond data visualization, automated data discovery surfaces actionable business insights from the underlying data. This enables proactive decision-making to accelerate your time to market, mitigate risk, and enhance your operational efficiency. Designed to support the workflows unique to your organization, InsightOut’s dynamic reporting and native Excel add-in fosters data distribution and collaboration throughout your extended enterprise of internal and external stakeholders. By joining best-in-class solutions in business intelligence and business planning, InsightOut empowers business leaders to drive growth and lead with data. Treehouse Technology Group is a technology and data strategy consulting firm, providing data development and software implementation services since 2014. We are a trusted technology partner to the Fortune 500, world-class innovators, and capital market leaders. Our valued customers include Envision Healthcare, Mars Petcare, Fidelity, Teleflex, Bain Capital, Berkshire Partners, and Wynn Resorts.

Average Rating: 4.6/5.0

Total Reviews: 49

How Do G2 Users Rate InsightOut?

  • Has the product been a good partner in doing business?: 9.5/10 (Category avg: 9.2/10)
  • Steps to Answer: 8.8/10 (Category avg: 8.4/10)
  • Reports Interface: 9.0/10 (Category avg: 8.8/10)
  • Calculated Fields: 8.8/10 (Category avg: 8.5/10)

Who Is the Company Behind InsightOut?

Who Uses This Product?

  • Top Industries: Information Technology and Services, Accounting
  • Company Size: 52% Medium, 38% Small

What Are Recent G2 Reviews of InsightOut?

wynEnterprise

Discover the story behind your data with Wyn Enterprise. Wyn Enterprise is a seamless embedded business intelligence platform that provides BI reporting, interactive dashboards, scheduling, and distribution tools within any internal or commercial app. With easy-to-use designers, designed for self-service BI, Wyn offers limitless visual data exploration, allowing the everyday user to become data-driven while revealing trends and telling the story behind the data. Whether for your business or your commercial SaaS app, Wyn is an ideal solution for both. Embedded BI for your business provides a holistic view of your business and can lead to more insights, increased team collaboration, and overall business growth. Additionally, embedding Wyn in your SaaS app provides white-label reports and dashboards as part of your own app. Embed Wyn and empower your users with a seamless business intelligence solution. Features: • Seamlessly embedded Business Intelligence: Designed for embedded self-service BI, Wyn provides ad hoc reporting, interactive dashboards, scheduling, and distribution tools within any internal or commercial app. Our platform offers flexible deployment and integration. • Embedding BI with Wyn: Once installed, Wyn is 100% web-based. In your application, Wyn is embedded as a port to provide users the ability to easily create, design, share, export, and distribute dashboards and documents. Seamlessly embed Wyn via Rest API and DIV. Wyn also supports OEM installation and embedding. Additionally, you can integrate with development platforms such as Java, PHP, and .NET through GraphQL API. You can also embed inside customized .NET apps as well as JavaScript frameworks (Angular, React, Vue). • Self-service BI dashboard and reports: Eliminate your dependence on the IT departments and data analysts. Offer every end-user (from code-first to code-free) the ability to create custom ad hoc reports and interactive dashboards. Self-service BI allows users to run their own queries and create their own reports, even if they don’t have a background in statistical analysis, allowing them to turn data into valuable insights for better data driven decisions. • Data Monitoring: Create threshold based notifications and establish Wyn Alerts that are always on to monitor your data. Never miss an opportunity for improvement thanks to real-time monitoring and instant alerts. Integrate your push-notifications with the platform you use everyday - Slack, MS Teams, or email - ensuring that you never miss an alert. •Localization Support: With Custom Localization Support, you’re in control of your dashboard and report. Authors have the ability to localize titles and labels, text explanations, and data visualizations. There is more to localization than just translating words and sentences. Wyn’s custom localization also supports right to left (RTL) languages, regional language options, and number and date formats. •NEW! Natural Language Generation Text Scenario: Introducing InsightIQ, a revolutionary addition to our feature set that transforms the way you interact with your data. InsightIQ is a Natural Language Generation Text Scenario that takes data summarization and insights derivation to a whole new level. This powerful tool allows you to seamlessly distill the essence of your visuals into articulate and easy-to-understand natural language text, facilitating quick reviews and automatic insights extraction. • Built-in multi-tenant support: Wyn's multi-tenant capabilities provides a single centrally administered architecture to serve multiple customers (tenants). These tenants can be within an organization or different businesses, with all its data stored in the SaaS system. Data privacy and securing the data from other tenants are both critical in these deployment scenarios • Date governance and modeling: Wyn allows you to secure and model your raw data. With easy-to-use dashboard and report designers in the same web-based application, end-users can develop their own ad-hoc dashboards and reports based on the secured data. Wyn also allows allows admins to model business data in a structure familiar to users. • Extensible security: Wyn provides extensible security to match your access control needs. Filter and segregate your data and limit your tenant-specific data with the configurable role-based security and user-context definitions. User contexts provide row-level data security in a document or database-level security for a data source. User context acts as an additional layer of data security, extending the role-based security. • Specialized web portals: The software comes with three portals, the document portal; for business end-users, dashboard, and report authors, the admin portal; for admins that configure the server, manage account and security settings, and the resource portal; for data administrators or IT teams. • Pixel-perfect reports: For power users and business users, the report designer tools can help in developing pixel-perfect operational reports, as well as in creating invoices, letters, and account statements among many others. The software further allows you to use ad hoc reporting or the standard enterprise reports. • Efficient Report Sharing: The software also allows you to schedule automated delivery of reports to be sent to your team’s emails. File sharing in various document formats is also supported. Additionally, you can collaborate with your team on report and dashboard designs, and you can share the published versions with others in your enterprise. • Centralized storage; Apart from being a secured platform, Wyn Enterprise also provides centralized storage for all your reports, images, datasets, and configuration settings. Other server resources, such as dashboards, themes, models, users, and roles, are also stored in the same place. The software also allows you to compile data from relational databases, local Excel or CSV files, web sources, and NoSQL data sources. Say Goodbye to User Fees You need a scalable BI platform. You also need to know how much it will cost in the long run. Wyn's scalable licensing model allows room for your business to grow without growth in licensing fees. • No per-user fees • No limits on data size 20+ Years in the Industry Unleash the full potential of embedded ad hoc reporting, driven by the same ActiveReports engine that has led the industry for 20+ years.

Average Rating: 4.7/5.0

Total Reviews: 38

How Do G2 Users Rate wynEnterprise?

  • Has the product been a good partner in doing business?: 9.7/10 (Category avg: 9.2/10)
  • Steps to Answer: 9.1/10 (Category avg: 8.4/10)
  • Reports Interface: 9.2/10 (Category avg: 8.8/10)
  • Calculated Fields: 8.7/10 (Category avg: 8.5/10)

Who Is the Company Behind wynEnterprise?

  • Seller: wynEnterprise LLC
  • Company Website:
  • Year Founded: 2018
  • HQ Location: 7400 Beaufont Springs Dr., St 300, Richmond VA 23225
  • LinkedIn® Page: www.linkedin.com
    32 employees on LinkedIn®

Who Uses This Product?

  • Top Industries: Information Technology and Services
  • Company Size: 53% Small, 37% Medium

What Do G2 Reviewers Say About wynEnterprise?

AI-generated summary from verified user reviews

Pros
  • Users appreciate the excellent customer support of wynEnterprise, ensuring effective problem resolution and user satisfaction.
  • Users find wynEnterprise to be easy to use, allowing for quick implementation and impressive data visualizations.
  • Users love the flexibility of wynEnterprise, enabling tailored solutions and easy integration with existing systems.
  • Users value the impressive reporting and analytics capabilities of wynEnterprise, making it effective for various business needs.
  • Users value the high level of customization in wynEnterprise, enabling precise branding and tailored data visuals.
Cons
  • Users find the documentation lacking, making it challenging to navigate the system's in-depth options effectively.
  • Users find the complexity of wynEnterprise challenging, with a steep learning curve and the need for better documentation.
  • Users find the lack of detailed instructions for upgrades frustrating, impacting the overall experience with wynEnterprise.
  • Users express concern over the lack of documentation and features, suggesting it limits the product's potential and usability.
  • Users face challenges with update issues, requiring time-consuming backups before applying updates to Wyn Enterprise.

What Are Recent G2 Reviews of wynEnterprise?

What Are G2 Users Discussing About wynEnterprise?
Qbo

Unscrambl’s 'Qbo' is an AI-powered, personal data analyst that allows business users to have natural language conversations with their data. Key features include NLQ, NLG, Automated Insights, machine initiated conversations, and active collaboration. Unscrambl Qbo is available as a native application on Microsoft Teams, deeply leveraging capabilities to enable remote workers with ‘live’ access to insights, storyboards during their work and meetings.

Average Rating: 4.7/5.0

Total Reviews: 31

How Do G2 Users Rate Qbo?

  • Has the product been a good partner in doing business?: 9.6/10 (Category avg: 9.2/10)
  • Steps to Answer: 8.6/10 (Category avg: 8.4/10)
  • Reports Interface: 8.8/10 (Category avg: 8.8/10)
  • Calculated Fields: 9.1/10 (Category avg: 8.5/10)

Who Is the Company Behind Qbo?

  • Seller: Unscrambl Inc
  • Year Founded: 2013
  • HQ Location: Atlanta, US
  • Twitter: @unscrambl
    163 Twitter followers
  • LinkedIn® Page: www.linkedin.com
    5 employees on LinkedIn®

Who Uses This Product?

  • Top Industries: Accounting
  • Company Size: 69% Medium, 28% Small

What Do G2 Reviewers Say About Qbo?

AI-generated summary from verified user reviews

Pros
  • Users value the efficiency of Qbo, benefiting from seamless integration and reduced manual data entry.
  • Users appreciate the quick report generation and seamless integration with Proconnect in Qbo.
  • Users find Qbo to be easy to learn, appreciating its intuitive interface and seamless integration with third-party software.
  • Users find Qbo to be easy to use, enabling effortless navigation and access to its various features.
  • Users love the easy integrations with Qbo, allowing seamless connections and quick access to reports.
Cons
  • Users feel that bank reconciliation can be more simplified, as the current process is overly complex and challenging.
  • Users find Qbo's confusing pricing challenging, particularly due to higher costs associated with add-ons compared to competitors.
  • Users feel the pricing is higher than competitors, particularly with the additional costs for add-ons.
  • Users find the learning curve challenging as adapting from QB Desktop to Qbo can be difficult.
  • Users feel the user interface needs improvement to enhance attractiveness and overall usability of Qbo.

What Are Recent G2 Reviews of Qbo?

SAP BusinessObjects Business Intelligence (BI)

The SAP® BusinessObjects™ Business Intelligence (BI) platform is a flexible, scalable information infrastructure that helps you more easily discover and share insights for better business decisions. The integrated, unified infrastructure enables scalability from one to many tools and interfaces on premise, in the cloud, or as a hybrid approach.

Average Rating: 3.8/5.0

Total Reviews: 238

How Do G2 Users Rate SAP BusinessObjects Business Intelligence (BI)?

  • Has the product been a good partner in doing business?: 7.6/10 (Category avg: 9.2/10)
  • Steps to Answer: 7.1/10 (Category avg: 8.4/10)
  • Reports Interface: 7.8/10 (Category avg: 8.8/10)
  • Calculated Fields: 7.8/10 (Category avg: 8.5/10)

Who Is the Company Behind SAP BusinessObjects Business Intelligence (BI)?

  • Seller: SAP
  • Year Founded: 1972
  • HQ Location: Walldorf
  • Twitter: @SAP
    297,052 Twitter followers
  • LinkedIn® Page: www.linkedin.com
    149,349 employees on LinkedIn®
  • Ownership: NYSE:SAP

Who Uses This Product?

  • Who Uses This: Account Manager
  • Top Industries: Information Technology and Services, Hospital & Health Care
  • Company Size: 66% Large, 28% Medium

What Do G2 Reviewers Say About SAP BusinessObjects Business Intelligence (BI)?

AI-generated summary from verified user reviews

Pros
  • Users value the enhanced visual capabilities of SAP BI, enabling effective presentation of pharmacy data and metrics.
  • Users appreciate the data visualization capabilities of SAP BI, enabling them to create impactful visuals and dashboards effortlessly.
  • Users appreciate the ease of understanding in SAP BI, as it helps visualize complex data effectively for analysis.
  • Users value the integration of data sources in SAP BI, enhancing visuals and dashboard capabilities for better insights.
  • Users appreciate the effective team collaboration in SAP BI, enabling seamless data integration and impressive visualizations.

What Are Recent G2 Reviews of SAP BusinessObjects Business Intelligence (BI)?

What Are G2 Users Discussing About SAP BusinessObjects Business Intelligence (BI)?

Tian Lin
TL
Researched and written by Tian Lin
Updated