

Embeddable Features
Reports (8)
-
Reports Interface
Reports interface for standard and self-service reports is intuitive and easy to use.
-
Steps to Answer
Requires a minimal number of steps/clicks to answer business question.
-
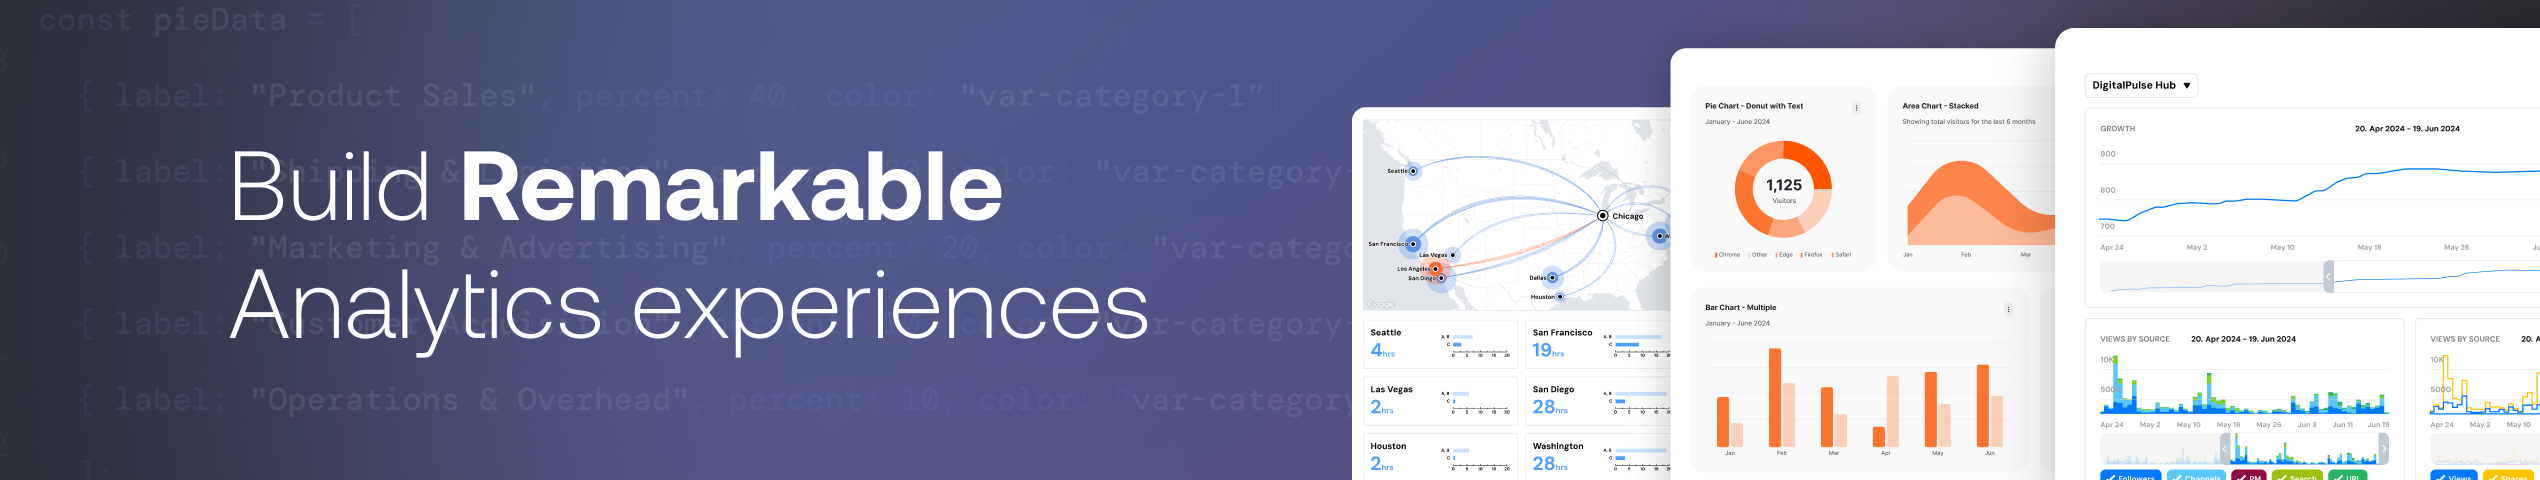
Graphs and Charts
Offers a variety of attractive graph and chart formats.
-
Score Cards
Score cards visually track KPI's.
-
Dashboards
Provides business users an interface to easily design, refine and collaborate on their dashboards
Reports Interface
Reports interface for standard and self-service reports is intuitive and easy to use.
Share Reports
Receive email reports and notifications regarding metrics.
Steps to Answer
Requires a minimal number of steps/clicks to answer business question.
Self Service (6)
-
Calculated Fields
Using formulas based on existing data elements, users can create and calculate new field values.
-
Data Column Filtering
Business users have the ability to filter data in a report based on predefined or automodeled parameters.
-
Data Discovery
Users can drill down and explore data to discover new insights.
-
Search
Ability to search global data set to find and discover data.
-
Collaboration / Workflow
Ability for users to share data and reports they have built within the BI tool and outside the tool through other collaboration platforms.
-
Automodeling
Tool automatically suggests data types, schemas and hierarchies.
Building Reports (4)
Data Transformation
Converts data formats of source data into the format required for the reporting system without mistakes.
Data Modeling
Ability to (re)structure data in a manner that allows extracting insights fast and accurate.
WYSIWYG Report Design
Provides business users an interface to easily design and refine their dashboards and reports. (What You See Is What You Get)
Integration APIs
Application Programming Interface - Specification for how the application communicates with other software. API's typically enable integration of data, logic, objects, etc with other software applications.
Data Updates (5)
Historical Snapshots
Ability to track historical data.
Real-Time Updating
Track metrics in real time with consistent and frequent updates.
Email Reports
Receive email reports and notifications regarding metric.
Historical Snapshots
Ability to track historical data.
-
Real-Time Updating
Track metrics in real time with consistent and frequent updates.
Visualization (4)
Graphs and Charts
Offers a variety of attractive graph and chart formats.
Score Cards
Score cards visually track KPI's.
-
Dashboards
Provides business users an interface to easily design, refine and collaborate on their dashboards
-
Formats
Allows one to create and export visualization into various formats (PNG, JPEG, etc.)
Collaboration (3)
Sharing
Provides the ability to easily share visualizations.
Co-Editing
Allows multiple users to edit and create visualizations together.
Devices
Has the ability to edit visualization across devices and device types (e.g. computer and phone).
Generative AI (2)
AI Text Generation
Allows users to generate text based on a text prompt.
AI Text Summarization
Condenses long documents or text into a brief summary.


