Best Predictive Analytics Tools and Software - Page 5

How Many Predictive Analytics Software Products Does G2 Track?

Total Products under this Category: 367

Category Stats (Sep 2026)

  • Average Rating: 4.44/5 The average rating of products in this category, based on all submitted ratings
  • Top Trending Product: Palantir Foundry (+1.94%) - Among all products in this category, Palantir Foundry recorded the largest rating increase compared to last month

Last updated: September 01, 2026

How Does G2 Rank Predictive Analytics Software Products?

Why You Can Trust G2's Software Rankings:

  • 30 Analysts and Data Experts
  • 30,000+ Authentic Reviews
  • 367+ Products
  • Unbiased Rankings

G2's software rankings are built on verified user reviews, rigorous moderation, and a consistent research methodology maintained by a team of analysts and data experts. Each product is measured using the same transparent criteria, with no paid placement or vendor influence. While reviews reflect real user experiences, which can be subjective, they offer valuable insight into how software performs in the hands of professionals. Together, these inputs power the G2 Score, a standardized way to compare tools within every category.

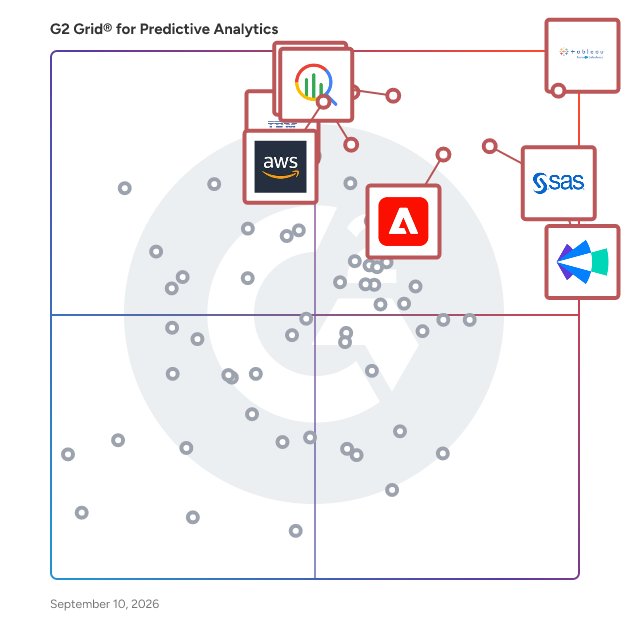
G2 Grid® for Predictive Analytics Software

G2 Grid® for Predictive Analytics Software plotting products by satisfaction and market presence

Highlighted products: Tableau, Clari, SAS Viya, Google Cloud BigQuery, Adobe Analytics, IBM Cognos Analytics, Amazon Quick, and IBM SPSS Statistics.

Underlying data: [Grid® JSON](https://www.g2.com/categories/predictive-analytics/grids.json?focus%5B%5D=tableau&focus%5B%5D=clari&focus%5B%5D=sas-sas-viya&focus%5B%5D=google-cloud-bigquery&focus%5B%5D=adobe-analytics&focus%5B%5D=ibm-cognos-analytics&focus%5B%5D=amazon-quick&focus%5B%5D=ibm-spss-statistics)

Hurree

Hurree is an AI-powered platform that consolidates all your reporting data into a single, easy-to-use command centre. It connects with over 70 popular tools, giving you a single, reliable view of performance across your business. With fully customizable dashboards, Hurree makes it simple for any team to track KPIs, monitor trends, and measure success with no technical skills required. At the heart of the platform is Riva, Hurree's built-in AI assistant. Riva doesn't just show you the numbers; it explains them. From instant summaries to predictive insights and actionable recommendations, Riva helps you understand what’s happening and what to do next. Hurree is built for teams who want better visibility, clearer reporting, and data they can actually use, without the complexity.

Average Rating: 4.8/5.0

Total Reviews: 74

How Do G2 Users Rate Hurree?

  • Has the product been a good partner in doing business?: 9.0/10 (Category avg: 8.9/10)
  • AI Text Summarization: 10.0/10 (Category avg: 8.1/10)
  • Algorithms: 10.0/10 (Category avg: 8.6/10)
  • AI Text Generation: 10.0/10 (Category avg: 8.1/10)

Who Is the Company Behind Hurree?

  • Seller: Hurree
  • Year Founded: 2018
  • HQ Location: Belfast, Antrim
  • Twitter: @Hurree_me
    896 Twitter followers
  • LinkedIn® Page: www.linkedin.com
    52 employees on LinkedIn®

Who Uses This Product?

  • Top Industries: Computer Software, Marketing and Advertising
  • Company Size: 58% Small, 42% Medium

What Do G2 Reviewers Say About Hurree?

AI-generated summary from verified user reviews

Pros
  • Users admire the ease of use of Hurree, simplifying client understanding of lead sources and competition effortlessly.
  • Users value the intuitive interface and customizable dashboards of Hurree for effective data visualization and tracking.
  • Users praise Hurree for its intuitive data visualization that simplifies understanding and enhances team productivity.
  • Users appreciate the efficiency of Hurree, making it easy to understand lead sources and improve client meetings.
  • Users value Hurree's powerful data transformation, enabling insightful analysis and informed decision-making through an intuitive interface.
Cons
  • The initial learning curve can be overwhelming, but support helps users adapt to Hurree's features over time.
  • Users experience limited customization options in Hurree, wishing for more flexibility in tailoring their reports and dashboards.
  • Users find the limited reporting features of Hurree restrict their ability to perform deeper analyses effectively.
  • Users express disappointment over the lack of AI integration, though improvements are reportedly in progress.
  • Users find learning difficulties with data ranges and integration, impacting their overall experience with Hurree.

What Are Recent G2 Reviews of Hurree?

InfiniGrow

InfiniGrow is an AI-driven revenue marketing platform that provides a unified attribution, forecasting, and planning solution to help B2B marketers become revenue leaders. InfiniGrow's platform helps B2B SaaS marketing teams uncover the business impact of any marketing activity, forecast the results of any budget scenario, and continuously hit their KPIs by optimizing their budget allocation towards the best-performing channels. In today's agile marketing landscape, B2B marketers are faced with increasing challenges as they attempt to make their marketing more predictable, measurable, and revenue-driven. InfiniGrow automatically consolidates and analyzes your live Marketing, Sales, and financial data to uncover the exact business impact of your activities, and provides clear visibility and AI-driven recommendations to better allocate your budget so you can continuously hit your KPIs.

Average Rating: 4.7/5.0

Total Reviews: 54

How Do G2 Users Rate InfiniGrow?

  • Has the product been a good partner in doing business?: 9.8/10 (Category avg: 8.9/10)
  • AI Text Summarization: 9.4/10 (Category avg: 8.1/10)
  • Algorithms: 9.7/10 (Category avg: 8.6/10)
  • AI Text Generation: 9.4/10 (Category avg: 8.1/10)

Who Is the Company Behind InfiniGrow?

  • Seller: InfiniGrow
  • Year Founded: 2017
  • HQ Location: Tel Aviv, Israel
  • Twitter: @InfiniGrow
    150 Twitter followers
  • LinkedIn® Page: www.linkedin.com
    8 employees on LinkedIn®

Who Uses This Product?

  • Top Industries: Computer Software, Information Technology and Services
  • Company Size: 93% Medium, 7% Small

What Do G2 Reviewers Say About InfiniGrow?

AI-generated summary from verified user reviews

Pros
  • Users value the structured data insights of InfiniGrow that enhance understanding of marketing impact and ROI.
  • Users value Attribution Accuracy in InfiniGrow, enabling clear insights into event impacts on revenue and pipeline.
  • Users value the intuitive design and structured data of InfiniGrow, enhancing clarity and insights for informed decision-making.
  • Users value the comprehensive reporting capabilities of InfiniGrow, enabling insights into campaign impact and ROI.
  • Users praise the ease of use of InfiniGrow, enjoying its intuitive design and structured data handling.
Cons
  • Users experience a challenging learning curve with InfiniGrow, requiring time to adapt to its features and interface.
  • Users note a learning difficulty with InfiniGrow, requiring time and support to fully understand the platform.
  • Users experience filtering issues that complicate navigation, especially with scrolling and clarity on applied filters.
  • Users find filter navigation cumbersome, often struggling with scrolling and identifying applied filters, which hinders usability.
  • Users find the platform to be not intuitive, often needing assistance to navigate and utilize its full potential.

What Are Recent G2 Reviews of InfiniGrow?

What Are G2 Users Discussing About InfiniGrow?

Knowi

Knowi is the Agentic Analytics Platform. It unifies data from anywhere, adds a governed semantic layer, and deploys AI agents that analyze, monitor, and act on live business data. Traditional BI tools bolt AI onto dashboards. Knowi was built AI-first. The semantic layer defines your metrics, dimensions, and business logic once across every source, so dashboards, queries, and AI agents all reason from the same source of truth. Agents then run continuously: they monitor KPIs, detect anomalies, investigate root causes, and alert your team without anyone opening a dashboard. Connect 70+ sources natively: SQL, NoSQL (MongoDB, Elasticsearch, InfluxDB), REST APIs, cloud warehouses, SaaS applications, and documents. Query and join across them live, with no ETL and no data movement, so teams go from raw data to answers 10X faster. What you get - Semantic layer: governed metric and business-logic definitions across every source - Agentic AI: autonomous monitoring, anomaly detection, root-cause analysis, natural language analytics, AI-generated dashboards - Multi-source analytics: SQL + NoSQL + APIs + docs in one query, no warehouse required - Embedded analytics: white-labeled, multi-tenant dashboards with row-level security inside your own product - Knowi Apps: dashboards inform, apps let you act. Turn a plain-English workflow into a governed web app so users investigate, decide, and take the next step without leaving the experience - Private AI and deployment control: cloud, on-premise, or hybrid. Bring your own LLM, or run Knowi Private AI so no third-party model ever sees your data Enterprise-grade by default: SOC 2 Type II, HIPAA, GDPR, SSO, role-based access, encryption in transit and at rest, full audit logging. Trusted by teams at Lockheed Martin, Verizon, Tata, Paramount, Infosys, and Autodesk. Teams can connect their first sources and build live dashboards within days, not quarters.

Average Rating: 4.9/5.0

Total Reviews: 28

How Do G2 Users Rate Knowi?

  • Has the product been a good partner in doing business?: 9.7/10 (Category avg: 8.9/10)
  • Algorithms: 9.7/10 (Category avg: 8.6/10)

Who Is the Company Behind Knowi?

  • Seller: Knowi
  • Year Founded: 2015
  • HQ Location: Oakland, California
  • Twitter: @knowico
    2,636 Twitter followers
  • LinkedIn® Page: www.linkedin.com
    23 employees on LinkedIn®

Who Uses This Product?

  • Company Size: 46% Small, 39% Medium

What Do G2 Reviewers Say About Knowi?

AI-generated summary from verified user reviews

Pros
  • Users value the exceptional customer support at Knowi, appreciating their responsiveness and tailored guidance throughout the onboarding process.
  • Users commend Knowi for its exceptional onboarding and proactive support, enhancing business growth and adapting to unique needs.
  • Users highlight Knowi's exceptional AI capabilities that enhance data analytics and reporting, ensuring a tailored experience.
  • Users appreciate the automation capabilities of Knowi, greatly simplifying data management and enhancing reporting efficiency.
  • Users appreciate the intuitive dashboarding features of Knowi, which simplify data management and save valuable time.
Cons
  • Users find the learning curve steep for Knowi, making initial setup challenging for advanced features and API connections.
  • Users feel there is a lack of guidance for API connections with popular platforms, complicating initial setup.
  • Users find a lack of tutorials for API connections, leading to a challenging setup experience with Knowi.

What Are Recent G2 Reviews of Knowi?

Neo4j Graph Data Science

Neo4j Graph Data Science is a data science and machine learning engine that uses the relationships in your data to improve predictions. It plugs into enterprise data ecosystems so you can get more data science projects into production quickly. Using a catalog of over 65 pretuned graph algorithms, data scientists can explore billions of data points in seconds to identify hidden connections and generate compelling visualizations that lead to better stakeholder decision making. Practical business applications and operations benefit from the context-first analysis that only graphs can provide across projects like recommendation engines, anomaly and fraud detection, route optimization, marketing, network analysis, and many more.

Average Rating: 4.5/5.0

Total Reviews: 15

How Do G2 Users Rate Neo4j Graph Data Science?

  • Has the product been a good partner in doing business?: 9.4/10 (Category avg: 8.9/10)
  • Algorithms: 9.2/10 (Category avg: 8.6/10)

Who Is the Company Behind Neo4j Graph Data Science?

  • Seller: Neo4j
  • Year Founded: 2007
  • HQ Location: San Mateo, CA
  • Twitter: @neo4j
    47,112 Twitter followers
  • LinkedIn® Page: www.linkedin.com
    1,063 employees on LinkedIn®

Who Uses This Product?

  • Company Size: 44% Medium, 38% Small

What Do G2 Reviewers Say About Neo4j Graph Data Science?

AI-generated summary from verified user reviews

Pros
  • Users find Neo4j GDS easy to use, facilitating smooth onboarding for both technical and non-technical staff.
  • Users appreciate the wide variety of well-designed algorithms offered by Neo4j Graph Data Science for diverse use cases.
  • Users value the effective problem-solving capabilities of Neo4j GDS, enhancing user recommendations and data analysis.
  • Users benefit from the scalable graph algorithms of Neo4j Graph Data Science, enhancing their analytics capabilities significantly.
  • Users value the support for popular machine learning problems in Neo4j Graph Data Science, enhancing user recommendations and analytics.
Cons
  • Users note a significant learning curve in Neo4j Graph Data Science, which can lead to confusion for beginners.
  • Users often face a significant learning curve with Neo4j Graph Data Science, impacting their ability to quickly adopt the tool.
  • Users find the beginner difficulty of Neo4j Graph Data Science challenging, making the learning process time-consuming for newcomers.
  • Users often face a difficult learning curve with Neo4j Graph Data Science, making it challenging for beginners to adapt.
  • Users find Neo4j Graph Data Science to be expensive, with high costs impacting overall accessibility and usage.

What Are Recent G2 Reviews of Neo4j Graph Data Science?

SuperLearner

SuperLearner is a package that implements the super learner prediction method and contains a library of prediction algorithms to be used in the super learner.

Average Rating: 4.5/5.0

Total Reviews: 13

How Do G2 Users Rate SuperLearner?

  • Has the product been a good partner in doing business?: 8.3/10 (Category avg: 8.9/10)
  • Algorithms: 9.4/10 (Category avg: 8.6/10)

Who Is the Company Behind SuperLearner?

Who Uses This Product?

  • Company Size: 38% Small, 31% Large

What Are Recent G2 Reviews of SuperLearner?

What Are G2 Users Discussing About SuperLearner?

Zoho Analytics

Zoho Analytics is a GenAI-powered self-service BI and analytics platform that helps businesses collect, prepare, analyze, and present insights from their data, all within minutes. Integrate with 500+ native data sources, like files, feeds, local and cloud databases, cloud storage, and popular business apps. Clean, transform, enrich, and catalog data with our agentic AI-powered, self-service data preparation and management capabilities. Create and manage complex ETL data pipelines using our visual pipeline builder, process stream data for real-time analytics, and set up a strong metrics layer for quality analysis and management. Zoho Analytics comes with 100+ domain-specific prebuilt reports and dashboards, pre-trained NLQ models, intelligently modeled and blended data across business applications, and lots more. Use our intuitive drag-and-drop visualization builder to build insightful and interactive reports and dashboards using a wide variety of visual components, like charts, widgets, pivot tables, tabular views and more. Generate customized reports and dashboards using simple, natural language with our AI-powered conversational agent, Zia. Ask Zia goes beyond basic reporting; it enables users to perform diagnostic analytics, forecast key metrics, and receive intelligent insights and recommendations. Users can assign tasks and trigger actions just by conversing with our agentic AI, Zia, streamlining their workflows and empowering data-driven decisions. Seamlessly embed Ask Zia into your custom or business applications to deliver contextual insights and actions. Enrich your analysis with automated insights by using our NLG-powered narration engine, Zia Insights. With diagnostic analytics for smarter decision-making, Zia Insights takes automated insights to the next level by bubbling up key drivers for particular business tasks. Enumerate complex business scenarios with what-if analyses, forecast KPIs, uncover trends and patterns with advanced analytical capabilities. Leverage cognitive analysis for keyword extraction and sentiment analysis, and more. Evaluate the best ML models with no-code assistance or develop custom models and functions using Python Code Studio. Zoho Analytics comes with pre-packed ML models (AutoML) that allow you to evaluate and pick the best model for your use case. Alternatively custom models and functions using Python Code Studio Embed our full-fledged analytics platform into other software applications. Craft and present immersive data stories through slideshows or purpose-built analytics portals. Collaborate securely through contextual comment threads and real-time messaging. Zoho Analytics has a robust set of APIs that enables elaborate customization and highly extensible low-code and no-code integration with any technology stack. It also offers a high degree of deployment flexibility (private, public, multi-cloud, and on-premises) and platform extensibility (professional services, partner support, and marketplace). Zoho Analytics is modern and scalable, and it can readily match growing data volumes and usage. Its time-tested and accredited enterprise-grade security features and governance framework ensure continuous data management and stewardship. On top of everything else, the TCO for Zoho Analytics—including licensing, implementation, customization, training, and support—is the lowest in our market.

Average Rating: 4.2/5.0

Total Reviews: 283

How Do G2 Users Rate Zoho Analytics?

  • Has the product been a good partner in doing business?: 8.5/10 (Category avg: 8.9/10)

Who Is the Company Behind Zoho Analytics?

  • Seller: Zoho
  • Year Founded: 1996
  • HQ Location: Austin, TX
  • Twitter: @Zoho
    137,880 Twitter followers
  • LinkedIn® Page: www.linkedin.com
    30,913 employees on LinkedIn®
  • Phone: +1 (888) 900-9646

Who Uses This Product?

  • Who Uses This: Director, Business Analyst
  • Top Industries: Information Technology and Services, Computer Software
  • Company Size: 50% Small, 43% Medium

What Do G2 Reviewers Say About Zoho Analytics?

AI-generated summary from verified user reviews

Pros
  • Users appreciate the ease of use of Zoho Analytics, thanks to its intuitive interface and customizable dashboards.
  • Users value the intuitive interface and customization of Zoho Analytics, enhancing their data reporting experience effortlessly.
  • Users appreciate the seamless integrations of Zoho Analytics, enabling easy data import from various external sources.
  • Users appreciate the user-friendly dashboards of Zoho Analytics, enabling easy customization and efficient data tracking.
  • Users appreciate the intuitive data visualization in Zoho Analytics, making complex analysis accessible and straightforward.
Cons
  • Users experience a steep learning curve with Zoho Analytics, especially for complex reports and advanced features.
  • Users find the limited customization options in Zoho Analytics frustrating compared to other platforms, like Google Analytics.
  • Users experience limited data integration options with Zoho Analytics, hindering seamless connectivity and overall functionality.
  • Users face integration issues with Zoho Analytics, limiting connections to external data sources and complicating functionality.
  • Users feel the missing features in Zoho Analytics limit functionality, especially for advanced data analysis tasks.

What Are Recent G2 Reviews of Zoho Analytics?

What Are G2 Users Discussing About Zoho Analytics?

IFS Copperleaf

Copperleaf is a Decision Analytics software solution for asset-intensive organizations. It empowers organizations to confidently develop, compare, and manage asset programs and projects across the organization to optimize operational performance, meet strategic objectives, and manage risk. Copperleaf is modular, configurable solution that integrates seamlessly with many existing operational systems, including EAM, ERP, and GIS, empowering organizations to turn data into decisions. With Copperleaf you can: - Direct your available funding and resources to the things that deliver the most value to your business. - Understand the risk profile associated with your asset portfolio and how this will change over time. - Demonstrate the business consequences of reducing – or increasing – your capital investment or maintenance budgets. - Justify your planned asset expenditures to external stakeholders. - Identify which projects to defer when there are funding or cash flow constraints.

Average Rating: 3.8/5.0

Total Reviews: 15

How Do G2 Users Rate IFS Copperleaf?

  • Has the product been a good partner in doing business?: 8.8/10 (Category avg: 8.9/10)
  • AI Text Summarization: 10.0/10 (Category avg: 8.1/10)
  • Algorithms: 10.0/10 (Category avg: 8.6/10)
  • AI Text Generation: 9.2/10 (Category avg: 8.1/10)

Who Is the Company Behind IFS Copperleaf?

  • Seller: IFS
  • Year Founded: 1983
  • HQ Location: Linkoping , Sweden
  • Twitter: @ifs
    18,002 Twitter followers
  • LinkedIn® Page: www.linkedin.com
    9,233 employees on LinkedIn®
  • Ownership: STO: IFS

Who Uses This Product?

  • Company Size: 67% Medium, 27% Small

What Do G2 Reviewers Say About IFS Copperleaf?

AI-generated summary from verified user reviews

Pros
  • Users value how Copperleaf enhances business growth through effective project prioritization, resource allocation, and risk management.
  • Users appreciate the ease of use of IFS Copperleaf, which enhances project prioritization and resource allocation.
  • Users value the efficient project prioritization and resource allocation provided by IFS Copperleaf, enhancing overall management effectiveness.
  • Users value the efficient resource allocation and risk management tools of IFS Copperleaf, enhancing project prioritization and transparency.
  • Users value how Copperleaf enhances time management by prioritizing projects and optimizing resource allocation effectively.
Cons
  • Users find the cost issues of IFS Copperleaf a barrier, especially for smaller organizations facing budget constraints.
  • Users find the cost of implementing and maintaining Copperleaf quite high, especially for smaller organizations.
  • Users find the learning curve steep, requiring regular use to effectively understand all the features of IFS Copperleaf.

What Are Recent G2 Reviews of IFS Copperleaf?

What Are G2 Users Discussing About IFS Copperleaf?

Palantir Foundry

Foundry is a transformative data platform built to help solve the modern enterprise’s most critical problems by creating a central operating system for an organization’s data, while securely integrating siloed data sources into a common analytics and operations picture. Palantir works with commercial companies and government organizations alike to close the operational loop, feeding real-time data into your data science models and updating source systems. With a breadth of industry-leading capabilities, Palantir can help enterprises traverse and operationalize data to enable and scale decision-making, alongside best-in-class security, data protection, and governance. Foundry was named by Forrester as a leader in the The Forrester Wave™: AI/ML Platforms, Q3 2022. Scoring the highest marks possible in product vision, performance, market approach, and applications criteria. As a Dresner-Award winning platform, Foundry is the overall leader in the BI and Analytics market and rated a perfect 5/5 by its customer base.

Average Rating: 4.2/5.0

Total Reviews: 27

How Do G2 Users Rate Palantir Foundry?

  • Has the product been a good partner in doing business?: 5.6/10 (Category avg: 8.9/10)
  • AI Text Summarization: 9.6/10 (Category avg: 8.1/10)
  • Algorithms: 9.3/10 (Category avg: 8.6/10)
  • AI Text Generation: 9.4/10 (Category avg: 8.1/10)

Who Is the Company Behind Palantir Foundry?

  • Seller: Palantir
  • HQ Location: Denver, US
  • Twitter: @PalantirTech
    425,595 Twitter followers
  • LinkedIn® Page: www.linkedin.com
    6,022 employees on LinkedIn®
  • Ownership: PLTR (NYSE)

Who Uses This Product?

  • Top Industries: Information Technology and Services, Computer Software
  • Company Size: 44% Large, 30% Small

What Do G2 Reviewers Say About Palantir Foundry?

AI-generated summary from verified user reviews

Pros
  • Users appreciate the integration of AI workflows in Palantir Foundry, enhancing their tech stack and data ecosystem.
  • Users value the AI workflow integration of Palantir Foundry, enhancing their tech stack and data ecosystem effectively.
  • Users appreciate the seamless AI integration in Palantir Foundry, enhancing their tech and data workflows significantly.
  • Users value the integration of AI workflows in Palantir Foundry, enhancing their tech stack and data ecosystem.
  • Users benefit from the efficient analysis capabilities of Palantir Foundry, streamlining their data processes and insights.
Cons
  • Users note that Palantir Foundry is not cheap, but they appreciate the value received for the cost.
  • Users find the limited customization options in Palantir Foundry restrictive compared to other open-source alternatives.
  • Users find the limited customization options of Palantir Foundry restrictive compared to other open-source platforms.
  • Users find the limited customization options of Palantir Foundry restrict their ability to tailor the platform to their needs.

What Are Recent G2 Reviews of Palantir Foundry?

SAS Visual Forecasting

SAS Visual Forecasting allows users to generate large numbers of trustworthy forecasts, quickly and automatically, using time series, machine learning and deep learning techniques. It comes with a no/low-code user interface, as well as a programmatic interface where users can code in SAS and open-source languages such as Python and R. Key features include: automatic data preparation, hierarchical forecasting, automatic segmentation of time series, incorporation of external drivers and events in a simple manner, hybrid forecasting techniques, interactive modeling capabilities, a framework to scale open-source algorithms in the cloud, a user friendly way for flexible overrides, and easy deployment of forecasting pipelines.

Average Rating: 4.5/5.0

Total Reviews: 12

How Do G2 Users Rate SAS Visual Forecasting?

  • Has the product been a good partner in doing business?: 8.3/10 (Category avg: 8.9/10)
  • AI Text Summarization: 8.3/10 (Category avg: 8.1/10)
  • Algorithms: 8.9/10 (Category avg: 8.6/10)
  • AI Text Generation: 7.5/10 (Category avg: 8.1/10)

Who Is the Company Behind SAS Visual Forecasting?

  • Seller: SAS Institute Inc.
  • Year Founded: 1976
  • HQ Location: Cary, NC
  • Twitter: @SASsoftware
    60,863 Twitter followers
  • LinkedIn® Page: www.linkedin.com
    15,122 employees on LinkedIn®
  • Phone: 1-800-727-0025

Who Uses This Product?

  • Company Size: 38% Large, 31% Medium

What Do G2 Reviewers Say About SAS Visual Forecasting?

AI-generated summary from verified user reviews

Pros
  • Users appreciate the ease of use in SAS Visual Forecasting, highlighting its intuitive design and fast setup process.
  • Users highly value the seamless integrations of SAS Visual Forecasting, enhancing efficiency and ease of use.
  • Users appreciate the ease of use and data generation features of SAS Visual Forecasting, enhancing their workflow efficiency.
  • Users value the time-saving capabilities of SAS Visual Forecasting, enhancing efficiency in model development and data handling.
  • Users value the accurate analytics provided by SAS Visual Forecasting, enhancing their decision-making process significantly.
Cons
  • Users find SAS Visual Forecasting to be too complex, requiring extensive support for implementation to navigate its features.
  • Users find the complex setup of SAS Visual Forecasting requires extensive support and resources to implement effectively.
  • Users find the high licensing costs of SAS Visual Forecasting challenging, especially for small businesses and startups.
  • Users find the licensing costs expensive, making SAS Visual Forecasting less accessible for small businesses and startups.
  • Users find the steep learning curve of SAS Visual Forecasting challenging, especially without prior experience in the SAS ecosystem.

What Are Recent G2 Reviews of SAS Visual Forecasting?

What Are G2 Users Discussing About SAS Visual Forecasting?

Tango

Tango IWMS Tango is a unified IWMS spanning the full real estate and workplace lifecycle, from site selection and lease management to capital projects, maintenance, energy, and workplace tools like occupancy and space, all built on one shared data platform instead of disconnected systems. The suite has evolved from simply recording and reporting on real estate data (dashboards, forecasts, natural-language queries) toward AI that acts on it directly: agents that don't just flag an underperforming lease or a low-occupancy floor but initiate the renegotiation, reroute the maintenance ticket, or adjust space and energy use in real time. That's the agentic shift Tango is building toward, moving from "here's what's happening" to "here's what was just done about it," with humans still accountable for oversight rather than out of the loop. Predictive Analytics Tango Predictive Analytics is Tango's location intelligence software for retailers. It uses GIS mapping, machine learning, and diverse data (mobile, social, economic, competitive, psychographic) to help retailers analyze trade areas, forecast site sales, model expansion or relocation scenarios, and optimize their real estate portfolios. It's used by brands like Dunkin' and Captain D's to speed up site selection and forecasting. Portfolio Strategy Tango Portfolio Strategy is Tango's CRE portfolio planning software for corporate real estate teams. It combines occupancy data, lease data, and scenario planning to model workplace strategy changes, like right-sizing, subleasing, or exiting space, and predict their cost and occupancy impacts. It also tracks strategy execution across locations and time, helping teams plan, model, and manage their portfolio in one platform. Transaction Management Tango Transactions is Tango's real estate transaction management software for retailers and enterprises. It manages the full deal lifecycle, new sites, renewals, terminations, relocations, renegotiations, and closures, in one platform. Capabilities include site analysis and scenario modeling, cost estimation, location intelligence mapping (occupancy, drive times, demographics), and centralized collaboration between internal teams, brokers, and vendors, with real-time reporting to track deal pipelines and KPIs. Construction Project Management Tango Projects is Tango's capital program management and construction project management software for enterprises and retailers. It centralizes control over budgets, timelines, and projects across a real estate portfolio, covering new builds, remodels, and rollouts. Features include program oversight, schedule management, bidding/RFI automation, FF&E procurement, vendor collaboration, field access to drawings and documents, and real-time reporting. It also connects to Tango Maintenance, carrying project closeout data forward to trigger preventive maintenance schedules. Lease Administration Tango Lease is Tango's lease management and accounting software, compliant with ASC 842, IFRS 16, and GASB 87. It uses AI agents to handle lease abstraction, AI for document intake, and automated workflows, covering critical dates, clauses, renewals, equipment leases, and subtenant management. On the financial side, it handles rent rolls, percentage rent, expense reconciliation against invoices, and occupancy/space visualization. Clients like Wendy's and Loblaw use it to manage thousands of leases and stay audit-ready at scale. Facilities Maintenance Tango Maintenance is Tango's facility maintenance management software for retailers and enterprises. It centralizes asset data, automates work order management, and coordinates internal and external maintenance teams across a diverse portfolio (offices, stores, warehouses, clinics). Features include mobile service request submission, a centralized call center, vendor portals, automated approvals and invoice management, smart routing of requests to vendors, and scheduled preventive maintenance. It integrates with Tango Projects and Tango Lease to align maintenance decisions with capital plans and lease terms. Energy & Sustainability Management Tango Energy & Sustainability is Tango's software for managing energy consumption, tracking emissions, and reporting on sustainability goals. It centralizes utility, water, waste, and emissions data, automates data collection from meters, and monitors carbon emissions across Scopes 1, 2, and 3. It also supports compliance and disclosures for frameworks like CDP, GRESB, and ENERGY STAR, with audit-ready reporting and goal tracking. Clients like Trace3, Taos Ski Valley, and Southwire use it for ESG reporting and carbon tracking. Space Management Tango Space is Tango's space management software for enterprises, combining scenario planning, move management, and real-time occupancy analytics. It handles stacking and blocking, departmental space allocation, and occupancy tracking by workstation and space type, then uses that data to identify low-usage areas and cut costs. It also centralizes Moves, Adds, and Changes (MAC) planning with drag-and-drop tools and automated occupancy updates. It's part of the Tango Workplace suite, integrating with reservation systems and employee experience tools to support hybrid work. Desk and Conference Room Booking Tango Reserve is Tango's office booking software for hybrid, hoteling, or mixed workplace models. Employees self-service book desks, rooms, and resources with custom rules by location, role, or time, plus team booking, a colleague finder, and calendar integration. It tracks real-time occupancy data by site, team, and workspace type to help right-size office footprints and inform space policy. Clients like CohnReznick and EisnerAmper use it for scalable, flexible workspace booking. Occupancy Management Tango Occupancy is Tango's occupancy analytics software for enterprises. It combines real-time, historical, and forecasted data to show how office space is actually used, from portfolio-level overviews down to floor and zone monitoring, sensor-based room usage, and live seat availability via smart signage. Organizations use it to identify underused space, right-size their footprint, inform lease renewal decisions, and align hybrid work policies with cost and sustainability goals. Clients like Swiss Re, FHNW, and Biogen have used it to cut space costs and make data-backed workplace decisions.

Average Rating: 4.3/5.0

Total Reviews: 15

How Do G2 Users Rate Tango?

  • Has the product been a good partner in doing business?: 8.3/10 (Category avg: 8.9/10)
  • Algorithms: 8.3/10 (Category avg: 8.6/10)

Who Is the Company Behind Tango?

  • Seller: Tango Analytics
  • Year Founded: 2008
  • HQ Location: Dallas, US
  • Twitter: @tangoanalytics
    317 Twitter followers
  • LinkedIn® Page: www.linkedin.com
    277 employees on LinkedIn®

Who Uses This Product?

  • Top Industries: Retail
  • Company Size: 73% Large, 13% Medium

What Do G2 Reviewers Say About Tango?

AI-generated summary from verified user reviews

Pros
  • Users appreciate the ease of use of Tango, benefiting from its intuitive interface and clear layout.
  • Users value the automation in Tango, which reduces human errors and simplifies rent processing and document management.
  • Users value the intuitive design and readability of Tango, enhancing their overall user experience.
  • Users appreciate the automatic sales tax addition in Tango, enhancing accuracy in rent processing and document management.
  • Users value the efficiency of Tango, as it automates sales tax and minimizes errors in rent processing.
Cons
  • Users find the beginner difficulty of Tango frustrating, requiring extensive training and impacting usability for newcomers.
  • Users find the complex implementation of Tango challenging, requiring extensive training and time for effective use.
  • Users find the complex interface of Tango difficult to navigate, requiring significant training and time investment.
  • Users find the complexity of Tango challenging, requiring extensive training to navigate effectively.
  • Users find the complex procedures of Tango challenging, requiring extensive training and causing frustration among new users.
What Are Recent G2 Reviews of Tango?

Verteego

CSR Reporting - Sustainability Reporting - HSE Reporting - Carbon & Energy management - REACh traceability throughout supply chains

Average Rating: 4.3/5.0

Total Reviews: 8

How Do G2 Users Rate Verteego?

  • Has the product been a good partner in doing business?: 8.3/10 (Category avg: 8.9/10)
  • AI Text Summarization: 10.0/10 (Category avg: 8.1/10)
  • Algorithms: 9.3/10 (Category avg: 8.6/10)
  • AI Text Generation: 9.2/10 (Category avg: 8.1/10)

Who Is the Company Behind Verteego?

  • Seller: Verteego
  • Year Founded: 2018
  • HQ Location: Paris
  • Twitter: @Verteego_EN
    348 Twitter followers
  • LinkedIn® Page: www.linkedin.com
    29 employees on LinkedIn®

Who Uses This Product?

  • Company Size: 50% Small, 25% Large

What Do G2 Reviewers Say About Verteego?

AI-generated summary from verified user reviews

Pros
  • Users value the forecasting accuracy of Verteego, enhancing demand prediction and resource optimization effectively.
  • Users benefit from Verteego's predictive analytics and scenario simulation, enhancing demand forecasting and resource optimization.
  • Users find the automation features of Verteego helpful for delivering actionable insights and making informed decisions.
  • Users value Verteego's predictive analytics and scenario simulation, enhancing demand forecasting and resource optimization effectively.
  • Users value the predictive analytics and scenario simulation features of Verteego for effective demand forecasting and resource optimization.
Cons
  • Users face compatibility issues with Verteego, leading to challenges in integration and functionality across different platforms.
  • Users experience complex implementation challenges with Verteego, leading to trust issues regarding its AI functionalities.
  • Users express concerns over the implementation complexities of Verteego, which hinder a smooth user experience.
  • Users face implementation complexity with Verteego, resulting in challenges during setup and integration processes.
  • Users find the limited flexibility of Verteego restricting and seek improved performance optimization for better usability.

What Are Recent G2 Reviews of Verteego?

What Are G2 Users Discussing About Verteego?

Squark

Squark is a Software as a Service (SaaS) platform for AI predictive power with the ease of a spreadsheet. The power of machine learning and large scale computing now make AI accessible for everyone, with absolutely no coding. Squark provides a capability for business users to simply link data and click next to generate the accurate predictive models. Behind the scenes, in minutes, we create thousands of models, compare them, and and apply the best one to your data. No programming. No code. No data scientists needed. Squark your data now and drive success by spotting trends and making moves before others know what happened.

Average Rating: 4.1/5.0

Total Reviews: 6

How Do G2 Users Rate Squark?

  • Algorithms: 7.9/10 (Category avg: 8.6/10)

Who Is the Company Behind Squark?

  • Seller: Squark
  • Year Founded: 2020
  • HQ Location: Burlington, US
  • Twitter: @SquarkAI
    140 Twitter followers
  • LinkedIn® Page: www.linkedin.com
    18 employees on LinkedIn®

Who Uses This Product?

  • Company Size: 67% Medium, 33% Small

What Are Recent G2 Reviews of Squark?

Zepl

Zepl let you use data science to analyze your cloud data warehouse in minutes. Customers use Zepl for all kinds of use cases, including predictive analytics, marketing analytics, preventive maintenance, security, anomaly detection, sales forecasting, product recommendations and more. Zepl is an extensible, cloud-based data science and analytics platform for enterprise teams. With Zepl, teams of data analysts and data scientists can use Python, R, Spark, Scala, and SQL to find insights and make predictions about their most important business challenges, as well as package and present their findings using built-in advanced visualizations.

Average Rating: 4.5/5.0

Total Reviews: 6

How Do G2 Users Rate Zepl?

  • Has the product been a good partner in doing business?: 8.3/10 (Category avg: 8.9/10)
  • AI Text Summarization: 10.0/10 (Category avg: 8.1/10)
  • Algorithms: 9.4/10 (Category avg: 8.6/10)
  • AI Text Generation: 10.0/10 (Category avg: 8.1/10)

Who Is the Company Behind Zepl?

  • Seller: DataRobot
  • Year Founded: 2012
  • HQ Location: Boston, Massachusetts
  • Twitter: @DataRobot
    19,225 Twitter followers
  • LinkedIn® Page: www.linkedin.com
    886 employees on LinkedIn®

Who Uses This Product?

  • Company Size: 67% Medium, 33% Small

What Are Recent G2 Reviews of Zepl?

Aera Technology

At its core, our mission is to help companies transform. We believe in driving beyond digital transformation so that organizations can operate at internet speed and scale in the era of cognitive automation. At Aera, we deliver the cognitive technology that enables the Self-Driving Enterprise with a Cognitive Operating System that connects you with your business and autonomously orchestrates your operations. Aera’s Cognitive OS leverages the best of artificial intelligence, machine learning, natural language processing, big data, and enterprise domain expertise to deliver cognitive automation at scale for some of the world’s largest companies. Aera’s Cognitive Operating System (Aera Cognitive OS) is the platform that delivers cognitive automation at scale. It is the digital brain that connects data, science, process, and change to automate and augment decision making and execution. The platform harmonizes internal and external data across the enterprise, derives insights and recommendations, digitizes decision processes and operationalizes change.

Average Rating: 4.1/5.0

Total Reviews: 5

How Do G2 Users Rate Aera Technology?

  • Has the product been a good partner in doing business?: 8.3/10 (Category avg: 8.9/10)
  • AI Text Summarization: 6.7/10 (Category avg: 8.1/10)
  • Algorithms: 5.8/10 (Category avg: 8.6/10)
  • AI Text Generation: 6.7/10 (Category avg: 8.1/10)

Who Is the Company Behind Aera Technology?

  • Seller: Aera Technology
  • Year Founded: 2017
  • HQ Location: Mountain View, California, United States
  • Twitter: @Aera_Technology
    2,608 Twitter followers
  • LinkedIn® Page: www.linkedin.com
    422 employees on LinkedIn®

Who Uses This Product?

  • Company Size: 60% Large, 40% Medium

What Are Recent G2 Reviews of Aera Technology?

What Are G2 Users Discussing About Aera Technology?

Kumo.AI

Kumo.AI is a SaaS platform that empowers organizations to build and deploy advanced predictive AI models directly from their relational data. By leveraging state-of-the-art Graph Neural Networks , Kumo.AI eliminates the need for manual feature engineering, enabling users to generate accurate predictions efficiently. The platform is designed to be accessible to both technical and non-technical users, facilitating the development of AI models without extensive machine learning expertise. Key Features and Functionality: - Data Integration: Connects seamlessly with existing data sources, allowing users to select relevant tables and define relationships without the need for data migration or complex pipelines. - Automated Model Training: Utilizes deep learning techniques to automatically determine significant attributes and relationships, streamlining the model training process and reducing the time from data to deployment. - Explainability Tools: Provides comprehensive explainability mechanisms, including entity-level insights and global contribution scores, enabling users to understand and trust model predictions. - Flexible Deployment Options: Offers various deployment models, including fully managed cloud services and integrations with platforms like Snowflake and Databricks, ensuring scalability and security. Primary Value and Problem Solved: Kumo.AI addresses the challenges associated with traditional AI model development, such as the need for extensive feature engineering, complex infrastructure, and prolonged development cycles. By automating these processes and providing an intuitive interface, Kumo.AI enables businesses to rapidly develop and deploy predictive models, leading to improved decision-making, enhanced operational efficiency, and significant cost savings. This approach democratizes access to advanced AI capabilities, allowing organizations to harness the full potential of their relational data.

Average Rating: 3.7/5.0

Total Reviews: 5

How Do G2 Users Rate Kumo.AI?

  • AI Text Summarization: 5.0/10 (Category avg: 8.1/10)
  • Algorithms: 6.7/10 (Category avg: 8.6/10)
  • AI Text Generation: 3.3/10 (Category avg: 8.1/10)

Who Is the Company Behind Kumo.AI?

  • Seller: Kumo.AI
  • Year Founded: 2021
  • HQ Location: Mountain View, US
  • Twitter: @Kumo_ai_team
    1,658 Twitter followers
  • LinkedIn® Page: www.linkedin.com
    74 employees on LinkedIn®

Who Uses This Product?

  • Company Size: 80% Small, 20% Large

What Are Recent G2 Reviews of Kumo.AI?

Bijou Barry
BB
Researched and written by Bijou Barry
Updated October 29, 2024