Top Free Log Analysis Software - Page 2

Sponsored content: This content is sponsored.

What problems does Graylog solve as a Log Analysis?

Graylog addresses key Log Analysis challenges by centralizing log management, enabling rapid search and investigation, and supporting alerting and compliance workflows. According to reviewers, it consolidates logs from diverse systems into a single interface, making it easier to debug issues, detect threats, and meet audit requirements—features like automated tagging, anomaly detection, and live tail are highlighted as particularly useful. Users note that Graylog’s dashboards and search tools help quickly pinpoint errors and suspicious activity, and integrations with platforms like AWS and Slack streamline monitoring. However, some reviewers mention a learning curve for new users and note that initial setup and advanced configurations, such as complex alerting or plugin installation, can require extra effort.

What Log Analysis features does Graylog offer?

Graylog offers a comprehensive set of native Log Analysis features, including Automated Tagging, Track Trends, Detect Anomalies, Data Discovery, and Live Tail, along with core capabilities like search, alerts, dashboards, and indexing. Reviewers highlight the value of fast, detailed log searches, real-time alerting, and customizable dashboards for operational visibility and incident response, with the platform scoring 8.8 for meeting requirements. While users appreciate the breadth of features, some note that advanced visualizations, correlation analysis, and certain integrations may require additional configuration or are less intuitive out of the box.

How easy is Graylog to set up, use, and get support for?

Graylog’s ease of use is rated at 8.4, with ease of administration also at 8.4 and setup slightly lower at 7.9, reflecting generally positive experiences with daily operations and configuration. Reviewers describe the UI as intuitive and effective for searching and filtering logs, and many find onboarding and integration straightforward, especially with recent improvements to the collector experience. However, some users report that initial setup and advanced configurations can be complex, and documentation or community support may be necessary to overcome these hurdles, as reflected in the slightly lower setup score of 7.9.

What does Graylog integrate with for Log Analysis workflows?

Graylog integrates most notably with AWS, which reviewers mention as a key platform for log ingestion and monitoring, and also supports integrations with Slack for alerting and collaboration. Additional integrations include Azure Portal, Docker, Kubernetes, Active Directory, and Google Cloud, providing flexibility for diverse environments. While these integrations enable broad connectivity, some reviewers note that integrating with certain third-party applications or security tools can require additional effort or custom configuration, and the marketplace for plugins is described as fragmented and sometimes lacking in quality.

How much does Graylog cost?

Graylog’s entry-level pricing for the Enterprise tier starts at $15,000 per year (USD) with a custom quote model, offering features like guided log ingestion, integrated data lake, prebuilt dashboards, and flexible deployment options. The Security tier begins at $18,000 per year, adding risk-based alerting, built-in threat detection, and security-optimized log retention. Reviewers frequently cite Graylog as cost-effective compared to alternatives like Splunk, appreciating its open-source options and volume-based licensing, though some mention that enterprise support and advanced features can become expensive as needs scale.

Updated August 2026.

How Many Log Analysis Software Products Does G2 Track?

Total Products under this Category: 108

Category Stats (Sep 2026)

  • Average Rating: 4.44/5 The average rating of products in this category, based on all submitted ratings
  • Top Trending Product: Falcon Next-Gen SIEM (+1.01%) - Among all products in this category, Falcon Next-Gen SIEM recorded the largest rating increase compared to last month

Last updated: September 01, 2026

How Does G2 Rank Log Analysis Software Products?

Why You Can Trust G2's Software Rankings:

  • 30 Analysts and Data Experts
  • 9,700+ Authentic Reviews
  • 108+ Products
  • Unbiased Rankings

G2's software rankings are built on verified user reviews, rigorous moderation, and a consistent research methodology maintained by a team of analysts and data experts. Each product is measured using the same transparent criteria, with no paid placement or vendor influence. While reviews reflect real user experiences, which can be subjective, they offer valuable insight into how software performs in the hands of professionals. Together, these inputs power the G2 Score, a standardized way to compare tools within every category.

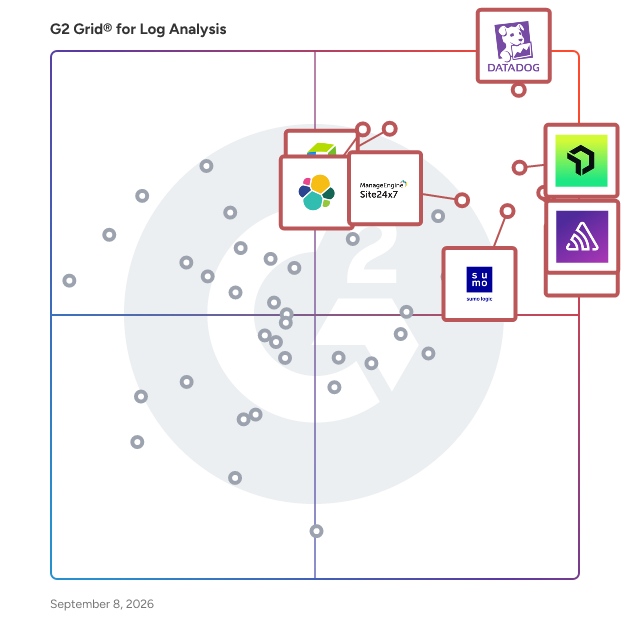
G2 Grid® for Log Analysis Software

G2 Grid® for Log Analysis Software plotting products by satisfaction and market presence

Highlighted products: Datadog, New Relic, Coralogix, Sentry, Sumo Logic, Dynatrace, Site24x7, and Elastic Observability.

Underlying data: [Grid® JSON](https://www.g2.com/categories/log-analysis/grids.json?focus%5B%5D=datadog&focus%5B%5D=new-relic&focus%5B%5D=coralogix&focus%5B%5D=sentry&focus%5B%5D=sumo-logic&focus%5B%5D=dynatrace&focus%5B%5D=site24x7&focus%5B%5D=elastic-observability)

Red Hat Ansible Automation Platform

Red Hat® Ansible® Automation Platform is Red Hat's primary enterprise automation product offering., it includes all of the tooling needed for building, deploying, and managing end-to-end automation at scale. Ansible Automation Platform makes it possible for users across an organization to share, vet, and manage automation content by means of a simple, powerful, and agentless technical implementation. IT managers can provide guidelines on how automation is applied to individual teams. Meanwhile, automation creators retain the freedom to write tasks that use existing knowledge, without the operational overhead of conforming to complex tools and frameworks. It is a more secure and stable foundation for deploying end-to-end automation solutions, from hybrid cloud to the edge. Ansible Automation Platform uses an open source development model of the Ansible project to create an experience tailored to enterprise automation. This open development model connects the engineers behind Ansible Automation Platform to more than a dozen open source Ansible projects in the community. As members work together to identify and elevate the best ideas, Red Hat supports them by contributing to the code and creating products from upstream projects. View more at https://www.ansible.com/compare Ansible Automation Platform simplifies packaging and distribution while providing tested and trusted interoperability between all the components. Combined with an 18-month support life cycle, Ansible Automation Platform takes the complexity, uncertainty, and guesswork out of using upstream open source tools. With a Red Hat subscription, you get certified and validated automation content from our robust partner ecosystem; added security, reporting, and analytics; and life cycle technical support from Red Hat and Red Hat’s technology partners to scale automation across your organization. And you’ll get expert knowledge gained from our success with thousands of customers.

Average Rating: 4.6/5.0

Total Reviews: 369

How Do G2 Users Rate Red Hat Ansible Automation Platform?

  • Alerts: 10.0/10 (Category avg: 8.7/10)
  • Has the product been a good partner in doing business?: 8.8/10 (Category avg: 9.0/10)

Who Is the Company Behind Red Hat Ansible Automation Platform?

  • Seller: Red Hat
  • Year Founded: 1993
  • HQ Location: Raleigh, NC
  • Twitter: @RedHat
    300,769 Twitter followers
  • LinkedIn® Page: www.linkedin.com
    19,487 employees on LinkedIn®

Who Uses This Product?

  • Who Uses This: DevOps Engineer, Software Engineer
  • Top Industries: Information Technology and Services, Financial Services
  • Company Size: 48% Large, 36% Medium

What Do G2 Reviewers Say About Red Hat Ansible Automation Platform?

AI-generated summary from verified user reviews

Pros
  • Users find the seamless automation of Red Hat Ansible Automation Platform enhances efficiency with minimal human interaction.
  • Users value the automation efficiency of Red Hat Ansible Automation Platform, streamlining operations without human intervention.
  • Users value the easy integrations of Red Hat Ansible Automation Platform, streamlining their automation workflows effortlessly.
  • Users value the task automation capabilities of Red Hat Ansible Automation Platform, streamlining processes without human intervention.
  • Users value the ease of use in Red Hat Ansible Automation Platform, making automation accessible even for beginners.
Cons
  • Users experience a steep learning curve with Ansible, requiring adjustments from traditional methods and installation challenges.
  • Users find the learning difficulty of Red Hat Ansible Automation Platform challenging due to its complexity and management issues.
  • Users find the complexity of the environment and licensing overwhelming, complicating management and scaling efforts.
  • Users find the complex setup of Red Hat Ansible Automation Platform challenging, especially with dependency management and installation.
  • Users note automation issues, including difficulties with inventory export and security that need further improvement.

What Are Recent G2 Reviews of Red Hat Ansible Automation Platform?

What Are G2 Users Discussing About Red Hat Ansible Automation Platform?

SolarWinds Observability

SolarWinds® Observability is a comprehensive full-stack observability solution designed to meet the diverse needs of modern organizations, regardless of their size. This solution provides deep visibility into hybrid ecosystems, enabling users to monitor and manage both on-premises and cloud environments effectively. By optimizing performance and ensuring availability across distributed hybrid IT infrastructures, SolarWinds Observability supports organizations in navigating the complexities of their IT environments. Targeted at IT professionals and organizations that require robust monitoring capabilities, SolarWinds Observability caters to a wide range of use cases. It is particularly beneficial for businesses operating in hybrid environments, where the integration of on-premises and cloud resources is essential. The solution allows users to gain a holistic view of their networks, applications, databases, and user experiences, thereby facilitating better decision-making and operational efficiency. This is especially crucial in today’s fast-paced digital landscape, where downtime can significantly impact service reliability and customer satisfaction. One of the standout features of SolarWinds Observability is its built-in intelligence powered by AIOps capabilities. This functionality accelerates issue remediation by enabling users to detect, troubleshoot, and resolve problems more efficiently. The advanced predictive analysis and anomaly-based alerts help organizations proactively address potential issues before they escalate, ultimately reducing downtime and enhancing service reliability. Additionally, the solution's log pattern analysis further streamlines the troubleshooting process, allowing IT teams to focus on strategic initiatives rather than being bogged down by operational challenges. SolarWinds Observability offers flexibility in deployment, providing users with the option to choose between self-hosted and SaaS models. The self-hosted option integrates seamlessly with other SolarWinds services, such as security and storage monitoring, while the SaaS option is tailored for deeper monitoring of custom and cloud-based applications. This adaptability ensures that organizations can select the deployment method that best aligns with their operational needs and infrastructure. Moreover, SolarWinds Observability stands out by consolidating multiple monitoring tools into a single, integrated solution. This not only simplifies the monitoring process but also helps organizations reduce costs associated with managing disparate systems. By offering comprehensive visibility across hybrid IT environments, SolarWinds Observability empowers organizations to optimize their operations and enhance overall performance.

Average Rating: 4.3/5.0

Total Reviews: 826

How Do G2 Users Rate SolarWinds Observability?

  • Alerts: 8.9/10 (Category avg: 8.7/10)
  • Data Sources: 8.8/10 (Category avg: 8.9/10)
  • Has the product been a good partner in doing business?: 8.3/10 (Category avg: 9.0/10)
  • Metric and Event Data: 8.0/10 (Category avg: 8.7/10)

Who Is the Company Behind SolarWinds Observability?

  • Seller: SolarWinds Worldwide LLC
  • Company Website:
  • Year Founded: 1999
  • HQ Location: Austin, TX
  • Twitter: @solarwinds
    19,570 Twitter followers
  • LinkedIn® Page: www.linkedin.com
    2,864 employees on LinkedIn®

Who Uses This Product?

  • Who Uses This: Network Engineer, Network Administrator
  • Top Industries: Information Technology and Services, Hospital & Health Care
  • Company Size: 44% Large, 35% Medium

What Do G2 Reviewers Say About SolarWinds Observability?

AI-generated summary from verified user reviews

Pros
  • Users love the intuitive interface of SolarWinds Observability, making system management and monitoring effortless and efficient.
  • Users appreciate the comprehensive visibility of SolarWinds Observability, simplifying performance monitoring across diverse environments.
  • Users appreciate the intuitive user interface of SolarWinds, enhancing the management and visibility of network performance.
  • Users love the intuitive dashboards and alerts of SolarWinds Observability, enhancing system management and monitoring efficiency.
  • Users love the visibility provided by SolarWinds Observability, thanks to its unified and intuitive dashboards for monitoring.
Cons
  • Users find the complex setup of SolarWinds Observability challenging, requiring significant technical expertise and time investment.
  • Users face a significant learning curve with SolarWinds Observability, complicating the use of advanced features and integrations.
  • Users are frustrated with the poor customer support, often finding it unhelpful for integration and troubleshooting issues.
  • Users experience usability issues with SolarWinds Observability, including a cluttered interface and a steep learning curve.

What Are Recent G2 Reviews of SolarWinds Observability?

What Are G2 Users Discussing About SolarWinds Observability?

EventSentry

EventSentry is a hybrid Security Information and Event Management (SIEM) solution designed to assist users in monitoring and managing their IT infrastructure effectively. By combining real-time event log monitoring with comprehensive system health and network monitoring, EventSentry provides a holistic view of servers and endpoints, enabling organizations to maintain robust security and operational efficiency. This SIEM solution is particularly beneficial for IT security teams, system administrators, and compliance officers who require a centralized platform to oversee their network's security posture. It caters to various industries, including finance, healthcare, and technology, where data integrity and security are paramount. The product is designed for organizations of all sizes, from small businesses to large enterprises, looking to enhance their security monitoring capabilities while ensuring system health. One of the standout features of EventSentry is its security event log normalization and correlation engine. This functionality transforms cryptic Windows security events into easily understandable reports, providing users with valuable insights that go beyond raw event data. The descriptive email alerts generated by the system offer additional context, allowing users to respond swiftly to potential security incidents. This capability is crucial for organizations that need to comply with regulatory requirements and maintain a proactive security stance. Moreover, EventSentry includes 200 compliance and security checks that strengthen security settings and reduce the attack surface - proactively identifying issues before they become liabilities. Malware & Ransomware attacks can be mitigated and detected in real time with innovative process activity monitoring and a flexible anomaly detection engine that can reveal suspicious patterns across any log source. EventSentry supports various integrations, making it adaptable to existing IT environments. This flexibility allows organizations to incorporate the SIEM solution seamlessly into their current systems, enhancing their overall security framework without significant disruption. The multi-tenancy feature further enables organizations to manage multiple clients or departments from a single platform, making it an ideal choice for managed service providers or organizations with diverse operational needs. In summary, EventSentry stands out in the SIEM category by providing a comprehensive approach to security and system monitoring. Its combination of real-time log analysis, health monitoring, and user-friendly reporting equips organizations with the tools necessary to safeguard their digital assets effectively. By leveraging this hybrid SIEM solution, users can achieve a clearer understanding of their security landscape, facilitating informed decision-making and enhancing overall cybersecurity resilience.

Average Rating: 4.6/5.0

Total Reviews: 60

How Do G2 Users Rate EventSentry?

  • Alerts: 9.0/10 (Category avg: 8.7/10)
  • Data Sources: 9.0/10 (Category avg: 8.9/10)
  • Has the product been a good partner in doing business?: 9.6/10 (Category avg: 9.0/10)
  • Metric and Event Data: 8.8/10 (Category avg: 8.7/10)

Who Is the Company Behind EventSentry?

  • Seller: NETIKUS.NET ltd
  • Company Website:
  • Year Founded: 2002
  • HQ Location: Chicago, Illinois
  • Twitter: @netikus
    971 Twitter followers
  • LinkedIn® Page: www.linkedin.com
    4 employees on LinkedIn®

Who Uses This Product?

  • Top Industries: Information Technology and Services, Financial Services
  • Company Size: 51% Medium, 30% Small

What Do G2 Reviewers Say About EventSentry?

AI-generated summary from verified user reviews

Pros
  • Users highlight the exceptional customer support from EventSentry, praising quick responses and helpful, knowledgeable staff.
  • Users value the effective alerting system of EventSentry, ensuring they receive only the most important notifications.
  • Users find implementation simple, with easy deployment and minimal resource requirements, making setup quick and efficient.
  • Users find EventSentry's affordable pricing and performance unmatched, appreciating excellent support and easy implementation.
  • Users highlight the world-class support of EventSentry, ensuring quick resolutions and expert assistance whenever needed.
Cons
  • Users note the steep initial learning curve, but resources are available to help overcome it effectively.
  • Users note a steep initial learning curve, but find helpful resources available to aid in their understanding.
  • Users are frustrated with EventSentry's inadequate handling of Linux logs and outdated log aggregation that hinder its effectiveness.
  • Users face challenges with log management issues in EventSentry, particularly with Linux logs and outdated aggregators.
  • Users note that graphical features for report generation need improvement for easier server management and selection.

What Are Recent G2 Reviews of EventSentry?

What Are G2 Users Discussing About EventSentry?

ManageEngine Log360

ManageEngine Log360 is a unified solution that offers holistic organizational security by bringing together crucial security capabilities like UEBA, DLP, CASB to improve visibility into your organization's network. With a simple UI and quick search and filtering capabilities for your device logs, you can easily gain insights into events on your network and plan automated responses to manage them. ManageEngine Log360 helps you secure your IT environment by detecting unauthorized security changes on your network and alerts the people responsible (admins, helpdesk). Our solution can capture the sensitive changes in your network, and present the changes to you in the form of searchable reports using which you can configure alerts. With support extending to your typical IT setups like Active Directory (AD), Azure, file servers, data storage devices, and other services like Amazon Web Services (AWS), ManageEngine Log360 will seamlessly fit into your existing configuration.

Average Rating: 4.3/5.0

Total Reviews: 16

How Do G2 Users Rate ManageEngine Log360?

  • Alerts: 5.0/10 (Category avg: 8.7/10)
  • Data Sources: 5.0/10 (Category avg: 8.9/10)
  • Has the product been a good partner in doing business?: 8.9/10 (Category avg: 9.0/10)
  • Metric and Event Data: 5.0/10 (Category avg: 8.7/10)

Who Is the Company Behind ManageEngine Log360?

  • Seller: Zoho
  • Year Founded: 1996
  • HQ Location: Austin, TX
  • Twitter: @Zoho
    137,880 Twitter followers
  • LinkedIn® Page: www.linkedin.com
    30,913 employees on LinkedIn®
  • Phone: +1 (888) 900-9646

Who Uses This Product?

  • Top Industries: Information Technology and Services
  • Company Size: 47% Medium, 35% Large

What Do G2 Reviewers Say About ManageEngine Log360?

AI-generated summary from verified user reviews

Pros
  • Users find Log360's ease of use invaluable, integrating multiple features seamlessly for efficient log management and monitoring.
  • Users value the consolidated log management features of Log360, enhancing auditing and real-time monitoring efficiency.
  • Users appreciate the real-time monitoring of Log360, enhancing their ability to detect threats and respond promptly.
  • Users value the real-time alerting in Log360, enabling proactive problem escalation and easy auditing in one platform.
  • Users love the real-time alerting system of Log360, enhancing log monitoring and proactive issue management effortlessly.
Cons
  • Users find complex configuration challenging, especially for cloud integration, leading to bugs and a frustrating experience.
  • Users face configuration difficulties with Log360, particularly when setting up for cloud services like Azure and GCP.
  • Users face data limitations with Log360, struggling to configure it for cloud platforms beyond AWS and needing more storage.
  • Users experience technical issues such as bugs and clunky configurations, affecting their overall satisfaction with Log360.
  • Users report experiencing bugs and a clunky configuration, which can complicate their overall experience with Log360.

What Are Recent G2 Reviews of ManageEngine Log360?

Netdata

Netdata is an AI-driven real-time observability platform that monitors systems, containers, applications, and infrastructure across servers, cloud environments, Kubernetes clusters, and IoT devices. With zero-configuration deployment, Netdata installs instantly, automatically discovers metrics, builds dashboards, and begins monitoring without setup. Netdata AI serves as an intelligent on-call assistant, automatically investigating alerts, correlating anomalies across thousands of metrics, identifying root causes, and explaining incidents with clear, actionable recommendations. By transforming raw telemetry into AI-guided insights, Netdata helps engineering teams move from alert to resolution in minutes instead of hours. The platform collects per-second metrics through 800+ integrations across operating systems, containers, databases, applications, OpenMetrics exporters, StatsD, and logs. Its distributed architecture processes data at the edge, enabling high-resolution monitoring and visibility into short-lived performance issues that traditional monitoring tools often miss. Netdata is available as a scalable SaaS platform with Netdata Cloud or as a private deployment within your own infrastructure, supporting on-prem, private cloud, and air-gapped environments while delivering automated dashboards, ML-based anomaly detection, and real-time troubleshooting.

Average Rating: 4.6/5.0

Total Reviews: 51

How Do G2 Users Rate Netdata?

  • Alerts: 9.2/10 (Category avg: 8.7/10)
  • Data Sources: 9.6/10 (Category avg: 8.9/10)
  • Has the product been a good partner in doing business?: 9.4/10 (Category avg: 9.0/10)
  • Metric and Event Data: 9.2/10 (Category avg: 8.7/10)

Who Is the Company Behind Netdata?

  • Seller: Netdata
  • Year Founded: 2018
  • HQ Location: San Francisco, US
  • Twitter: @netdatahq
    4,040 Twitter followers
  • LinkedIn® Page: www.linkedin.com
    79 employees on LinkedIn®

Who Uses This Product?

  • Top Industries: Information Technology and Services, Computer Software
  • Company Size: 44% Small, 43% Medium

What Do G2 Reviewers Say About Netdata?

AI-generated summary from verified user reviews

Pros
  • Users highlight the ease of use of Netdata, praising its quick setup and intuitive dashboard for monitoring.
  • Users praise the easy setup of Netdata, experiencing quick implementation and immediate access to detailed metrics.
  • Users praise the ease of setup and detailed real-time monitoring provided by Netdata, enabling efficient system management.
  • Users value the real-time monitoring of Netdata, appreciating its detail and immediacy for swift decision-making.
  • Users find the easy installation and user-friendly dashboard of Netdata to be highly beneficial for monitoring systems.
Cons
  • Users note missing APM features and limited documentation, which affect usability and long-term data retention.
  • Users find the insufficient documentation on best practices limits their ability to fully optimize Netdata's capabilities.
  • Users note the limited compatibility with Windows and lack of integrations, impacting their monitoring experience.
  • Users find the limited functionality of Netdata frustrating, especially with scalability and third-party dependencies affecting performance.
  • Users highlight resource limitations in Netdata, struggling with data volume and scalability challenges on their systems.

What Are Recent G2 Reviews of Netdata?

Graylog

Graylog is a log management and security information and event management (SIEM) solution designed to assist security and IT teams in detecting, investigating, and responding to potential threats with increased efficiency. By leveraging advanced technologies such as scalable log management, real-time data correlation, and explainable artificial intelligence (AI), Graylog transforms complex data sets into actionable insights, enabling organizations to make informed decisions swiftly. The platform caters to a diverse range of users, from small businesses to large enterprises, all of whom require enhanced visibility and control over their IT environments. Graylog is particularly beneficial for security analysts and IT professionals who need to sift through vast amounts of log data to identify anomalies, track incidents, and ensure compliance with various regulatory standards. Its user-friendly interface and powerful analytical tools streamline the process of threat detection and response, making it an essential asset for organizations aiming to bolster their cybersecurity posture. Key features of Graylog include automated workflows that simplify repetitive tasks, anomaly detection capabilities that flag unusual patterns in data, and guided investigations that assist users in navigating complex security incidents. The platform also offers AI-driven summaries that distill critical information, allowing analysts to focus on high-priority issues without getting bogged down by excessive data. These features collectively enhance the speed and accuracy of threat responses, ensuring that security teams remain in control of their environments. Graylog's versatility is evident in its range of products, which includes Graylog Security, Enterprise, API Security, and Open solutions. Each product is tailored to meet the specific needs of different organizations, providing clarity and context across various operational landscapes. With a user base of over 60,000 organizations globally, Graylog has established itself as a trusted partner in the realm of cybersecurity and log management, helping teams navigate the complexities of modern threats while maintaining a clear focus on their objectives.

Average Rating: 4.4/5.0

Total Reviews: 106

How Do G2 Users Rate Graylog?

  • Alerts: 8.6/10 (Category avg: 8.7/10)
  • Data Sources: 8.5/10 (Category avg: 8.9/10)
  • Has the product been a good partner in doing business?: 8.4/10 (Category avg: 9.0/10)
  • Metric and Event Data: 9.0/10 (Category avg: 8.7/10)

Who Is the Company Behind Graylog?

  • Seller: Graylog
  • Company Website:
  • Year Founded: 2009
  • HQ Location: Houston, US
  • Twitter: @graylog2
    9,115 Twitter followers
  • LinkedIn® Page: www.linkedin.com
    124 employees on LinkedIn®

Who Uses This Product?

  • Who Uses This: Software Engineer
  • Top Industries: Information Technology and Services, Computer Software
  • Company Size: 45% Medium, 31% Small

What Do G2 Reviewers Say About Graylog?

AI-generated summary from verified user reviews

Pros
  • Users value the cost optimization of Graylog, finding it reliable and compliant with industry standards.
  • Users find the detailed API information essential for effective debugging, enhancing their daily workflow significantly.
  • Users find the detailed API information invaluable for effective debugging, preventing potential dead ends in troubleshooting.
  • Users find the detailed API information provided by Graylog extremely helpful for effective debugging processes.
  • Users praise Graylog for its reliable and cost-effective pricing, aligning well with industry standards and needs.
Cons
  • Users find Graylog's complexity frustrating, as it often leads to wasted time during debugging and review processes.
  • Users face debugging difficulties with Graylog, often leading to wasted time and frustration during troubleshooting.
  • Users experience difficulties with integration issues, limiting the compatibility of Graylog with other platforms.
  • Users find the learning curve to be challenging, leading to time wasted instead of efficient debugging and reviews.
  • Users experience time consumption with Graylog, finding that it complicates workflows and wastes valuable debugging time.

What Are Recent G2 Reviews of Graylog?

What Are G2 Users Discussing About Graylog?

Logz.io

Logz.io is an AI-powered observability platform designed to help teams solve critical log management, monitoring, and troubleshooting challenges. Built for modern environments, Logz.io unifies log management, infrastructure monitoring, and distributed tracing in a single platform to provide deep, actionable insights into system performance and health. At its core, Logz.io’s AI Agent technology automates root cause analysis (RCA) and surfaces insights that accelerate investigations, reduce MTTR, and eliminate the need for time-consuming manual analysis or navigating multiple dashboards. Whether managing microservices or troubleshooting production issues, Logz.io empowers teams to quickly pinpoint issues, de-risk deployments, and focus on innovation. Unlike traditional observability tools that require ever-increasing data volumes and expertise, Logz.io offers a smarter, cost-optimized solution. With the ability to customize data ingestion and optimize telemetry costs, Logz.io ensures you get the insights you need without breaking the budget.

Average Rating: 4.5/5.0

Total Reviews: 163

How Do G2 Users Rate Logz.io?

  • Alerts: 8.8/10 (Category avg: 8.7/10)
  • Data Sources: 8.8/10 (Category avg: 8.9/10)
  • Has the product been a good partner in doing business?: 9.2/10 (Category avg: 9.0/10)
  • Metric and Event Data: 8.3/10 (Category avg: 8.7/10)

Who Is the Company Behind Logz.io?

  • Seller: Logz.io
  • Year Founded: 2014
  • HQ Location: Boston, MA
  • Twitter: @logzio
    3,156 Twitter followers
  • LinkedIn® Page: www.linkedin.com
    103 employees on LinkedIn®

Who Uses This Product?

  • Who Uses This: Software Engineer, Software Developer
  • Top Industries: Computer Software, Information Technology and Services
  • Company Size: 53% Medium, 30% Small

What Do G2 Reviewers Say About Logz.io?

AI-generated summary from verified user reviews

Pros
  • Users value the centralized log management of Logz.io, enabling efficient issue tracking and automated reporting.
  • Users highlight the excellent customer support of Logz.io, noting quick responses and knowledgeable assistance from the team.
  • Users value the ease of implementation of Logz.io, praising its smooth integration and user-friendly dashboards.
  • Users praise the implementation ease of Logz.io, enjoying a smooth integration and user-friendly dashboard.
  • Users value the centralized log collection of Logz.io, enhancing productivity with user-friendly tools and insights.
Cons
  • Users find the dashboard issues in Logz.io cumbersome, with needs for improved chart creation and UI updates.
  • Users face integration issues with Logz.io, citing lag in indexing and complexity in advanced configurations.
  • Users find the limited customization options in Logz.io restrictive, affecting their overall satisfaction with the product.
  • Users find the complex configuration challenging, particularly with alerts and custom parsing rules setup.
  • Users find complex debugging challenging, often needing to deeply analyze data to set up alerts and reports effectively.

What Are Recent G2 Reviews of Logz.io?

What Are G2 Users Discussing About Logz.io?

Checkmk

Checkmk is a full-stack monitoring and observability platform designed to provide unified visibility into hybrid IT infrastructures. With more than 2,000 built-in integrations, it offers broad coverage across networks, servers, cloud workloads, Kubernetes and applications. The platform is highly automated, featuring auto-discovery of hosts and services and rule-based configuration to reduce manual setup. It is highly scalable, capable of efficiently monitoring thousands of hosts and millions of services. A central web-based interface allows users to manage configuration, visualize data with customizable dashboards, and track system performance over time. Checkmk is available as packages for all common Linux distributions, as a virtual or physical appliance, through AWS and Azure Marketplace images, or as SaaS. Checkmk is available in four editions: Checkmk Community offers free and open source monitoring for small infrastructures. Checkmk Pro allows for monitoring at speed and scale for data center infrastructures. Checkmk Ultimate offers full-stack observability for hybrid and cloud-native infrastructures which is also available with multi-tenancy and data segregation to support security and compliance. And Checkmk Cloud for full-stack observability for hybrid and cloud-native infrastructures in a SaaS platform. Available extensions include synthetic monitoring and OpenTelemetry for application monitoring. The Checkmk Relay enables secure data collection for segmented networks using outbound-only communication, supporting fully air-gapped and zero-inbound monitoring deployments. Checkmk supports integration with ITSM tools and third-party platforms, enabling automatic ticket creation and consistent alerting. Features such as forecasting, capacity planning, and asset inventory as well as lifecycle management and auto-registration help teams manage dynamic IT environments. Monitoring capabilities: - Monitoring of hybrid infrastructures: cloud, on-premises, virtual, and container environments. - 2000+ built-in integrations networks, servers, cloud workloads, Kubernetes and applications out-of-the-box dashboards provide key metrics for AWS and Azure environments, Linux and Windows servers, and Kubernetes clusters. - Automated discovery and configuration. - Alerting with native ITSM integrations. Operational benefits: - Provides insights into system health, capacity trends, and future resource needs through built-in assessments and forecasting tools. - Reduces manual effort with auto-discovery, rule-based configuration, and centralized agent management as well as auto-registration and host lifecycle management. - Accelerates incident response time by using custom self-healing workflows via the ‘Alert Handler’. - Allows creation of tailored dashboards and views to focus on the most relevant metrics for each team. - Maintains an up-to-date inventory of hardware and software assets, enriched with live monitoring data. - Supports distributed monitoring and can handle massive amounts of data. Why choose Checkmk? - Cost Efficiency: Transparent pricing model with a strong price-performance ratio - Security: Meets stringent security requirements, including fully air-gapped deployments and zero-inbound monitoring. - Visibility: Delivers broad and deep visibility with flexible deployment options. - Scalability: Scales efficiently to support large, distributed environments with high host and service counts. - Extensibility: Supports custom plug-ins, integrations, synthetic monitoring to monitor you applications from the user’s perspective and OpenTelemetry for application monitoring. Customers include: Adobe, Cloudera, Fujitsu, Siemens, Orange, VW, HP, Zalando, Fitbit, NEC, Continental, NHL, Capgemini, Sixt, Intesa SanPaolo

Average Rating: 4.7/5.0

Total Reviews: 295

How Do G2 Users Rate Checkmk?

  • Alerts: 8.7/10 (Category avg: 8.7/10)
  • Data Sources: 8.1/10 (Category avg: 8.9/10)
  • Has the product been a good partner in doing business?: 9.0/10 (Category avg: 9.0/10)
  • Metric and Event Data: 8.4/10 (Category avg: 8.7/10)

Who Is the Company Behind Checkmk?

  • Seller: Checkmk
  • Company Website:
  • Year Founded: 2007
  • HQ Location: Munich, DE
  • Twitter: @checkmk
    1,755 Twitter followers
  • LinkedIn® Page: www.linkedin.com
    232 employees on LinkedIn®

Who Uses This Product?

  • Who Uses This: IT Engineer, Systemadministrator
  • Top Industries: Information Technology and Services, Computer & Network Security
  • Company Size: 42% Medium, 40% Large

What Do G2 Reviewers Say About Checkmk?

AI-generated summary from verified user reviews

Pros
  • Users appreciate the ease of use of Checkmk, finding it quick to deploy and well-documented.
  • Users commend Checkmk for its flexibility and powerful monitoring capabilities, effectively managing diverse IT infrastructures.
  • Users appreciate the comprehensive monitoring capabilities of Checkmk, enabling effective oversight of diverse IT environments.
  • Users value the flexibility and customization of Checkmk, making it a powerful solution tailored to their needs.
  • Users value Checkmk for its real-time monitoring capabilities, allowing efficient oversight of diverse systems and applications.
Cons
  • Users find the steep learning curve challenging, making onboarding difficult for non-regular users and complicating their experience.
  • Users find difficult learning due to complex customization and limited data insights in Checkmk, affecting usability.
  • Users find the configuration process overly complex, especially during onboarding for new and non-regular users.
  • Users find the learning difficulty steep due to complex configurations and lacking intuitive documentation for advanced features.
  • Users find the complex setup of Checkmk challenging, especially for newcomers unfamiliar with the system.

What Are Recent G2 Reviews of Checkmk?

What Are G2 Users Discussing About Checkmk?

SolarWinds Kiwi Syslog Server

SolarWinds® Kiwi Syslog Server is an affordable, web-based syslog management tool that centralizes log management across network devices and servers. It receives syslog messages, SNMP traps (v1, v2, v3), and Windows® event logs from routers, switches, firewalls, Linux®/Unix® hosts, and more — with support for unlimited devices per installation and throughput of up to two million messages per hour. Filter, search, and view logs from anywhere using the intuitive web console, with up to 21 customizable display views. Built-in actions let you automate responses to incoming messages — send email alerts, run scripts, log to a database, or forward to a SIEM. Log archival and cleanup features help you meet SOX, PCI-DSS, FISMA, and other compliance requirements. Key Features: -Centralized monitoring of syslog messages, SNMP traps, and Windows event logs -Web-based console with customizable views and graphical statistics -Automated responses: email alerts, scripts, database logging, and message forwarding -Unlimited devices per install with IPv4 and IPv6 support -Log retention and archival for regulatory compliance -Integrates with SolarWinds NPM, Security Event Manager, Loggly, and Papertrail

Average Rating: 4.6/5.0

Total Reviews: 14

How Do G2 Users Rate SolarWinds Kiwi Syslog Server?

  • Alerts: 7.5/10 (Category avg: 8.7/10)
  • Data Sources: 10.0/10 (Category avg: 8.9/10)
  • Has the product been a good partner in doing business?: 8.5/10 (Category avg: 9.0/10)
  • Metric and Event Data: 10.0/10 (Category avg: 8.7/10)

Who Is the Company Behind SolarWinds Kiwi Syslog Server?

  • Seller: SolarWinds Worldwide LLC
  • Year Founded: 1999
  • HQ Location: Austin, TX
  • Twitter: @solarwinds
    19,570 Twitter followers
  • LinkedIn® Page: www.linkedin.com
    2,864 employees on LinkedIn®
  • Ownership: NYSE: SWI

Who Uses This Product?

  • Top Industries: Information Technology and Services
  • Company Size: 50% Large, 50% Medium

What Are Recent G2 Reviews of SolarWinds Kiwi Syslog Server?

What Are G2 Users Discussing About SolarWinds Kiwi Syslog Server?

Logmanager

Logmanager is a log management platform enhanced with SIEM capabilities that radically simplifies response to cyberthreats, legal compliance, and troubleshooting. By transforming diverse logs, events, metrics, and traces into actionable insights, it helps security and operations teams respond swiftly to any incident. With unmatched ease of use, peerless functionality, and flexibility, Logmanager ensures control over the entire technology stack. Visit logmanager.com.

Average Rating: 4.7/5.0

Total Reviews: 36

How Do G2 Users Rate Logmanager?

  • Alerts: 8.3/10 (Category avg: 8.7/10)
  • Data Sources: 9.4/10 (Category avg: 8.9/10)
  • Has the product been a good partner in doing business?: 9.8/10 (Category avg: 9.0/10)
  • Metric and Event Data: 8.6/10 (Category avg: 8.7/10)

Who Is the Company Behind Logmanager?

  • Seller: Logmanager a.s.
  • Company Website:
  • Year Founded: 2014
  • HQ Location: Prague 5, CZ
  • LinkedIn® Page: www.linkedin.com
    22 employees on LinkedIn®

Who Uses This Product?

  • Top Industries: Computer & Network Security, Information Technology and Services
  • Company Size: 53% Small, 39% Medium

What Do G2 Reviewers Say About Logmanager?

AI-generated summary from verified user reviews

Pros
  • Users commend the excellent customer support of Logmanager, finding the team responsive and helpful during implementation.
  • Users find Logmanager's ease of use enhances their experience with simple searches and rapid configuration.
  • Users appreciate the centralized log management of Logmanager, simplifying monitoring and enhancing troubleshooting across multiple systems.
  • Users value the efficiency of Logmanager, which simplifies deployment and operates reliably without requiring constant attention.
Cons
  • Users often face slow performance when exporting large reports, which can be frustrating during intensive tasks.
  • Users find difficult customization in Logmanager hampers usability and complicates specific use cases and configurations.
  • Users desire more automation features in Logmanager, as backups and API endpoints require manual setup.
  • Users find the limited customization options frustrating, affecting their ability to tailor Logmanager for specific needs.
  • Users find the difficult setup of Logmanager frustrating, needing manual adjustments for backups that could be automated.

What Are Recent G2 Reviews of Logmanager?

LogicMonitor

LogicMonitor is an AI-first observability platform that helps enterprises protect revenue, brand reputation, and customer experience in a digital-first world. As every customer interaction depends on application and infrastructure performance, downtime is more than an IT issue—it is a business risk. LogicMonitor eliminates blind spots across cloud, infrastructure, applications, and the Internet, giving IT teams unified visibility from user experience to code-level performance. With AI-powered insights, intelligent alerting, and automation, LogicMonitor helps organizations detect, prioritize, and prevent issues before they impact customers. By enabling teams to move from reactive incident response to autonomous IT operations, LogicMonitor helps modern enterprises reduce disruption, operate efficiently at scale, and keep digital services performing reliably. For more information, visit  www.logicmonitor.com and our blog, or follow us on LinkedIn, X, Facebook, and YouTube.

Average Rating: 4.5/5.0

Total Reviews: 587

How Do G2 Users Rate LogicMonitor?

  • Alerts: 8.9/10 (Category avg: 8.7/10)
  • Data Sources: 8.4/10 (Category avg: 8.9/10)
  • Has the product been a good partner in doing business?: 9.0/10 (Category avg: 9.0/10)
  • Metric and Event Data: 8.5/10 (Category avg: 8.7/10)

Who Is the Company Behind LogicMonitor?

  • Seller: LogicMonitor
  • Company Website:
  • Year Founded: 2007
  • HQ Location: Santa Barbara, CA
  • Twitter: @logicmonitor
    12,430 Twitter followers
  • LinkedIn® Page: www.linkedin.com
    1,258 employees on LinkedIn®

Who Uses This Product?

  • Who Uses This: Infrastructure Manager, IT Manager
  • Top Industries: Information Technology and Services, Computer Software
  • Company Size: 52% Medium, 30% Large

What Do G2 Reviewers Say About LogicMonitor?

AI-generated summary from verified user reviews

Pros
  • Users value the ease of use in LogicMonitor, benefiting from its intuitive navigation and simple management features.
  • Users praise the implementation ease of LogicMonitor, appreciating its fast setup and intuitive platform navigation.
  • Users value the broad range of monitoring features in LogicMonitor, enhancing both infrastructure and application oversight.
  • Users value the comprehensive monitoring of LogicMonitor, providing deep insights into applications and infrastructure effortlessly.
  • Users commend the excellent customer support of LogicMonitor, facilitating enhanced monitoring and problem management effortlessly.
Cons
  • Users find the steep learning curve challenging due to the need for advanced skills and internet reliance.
  • Users note limited features, facing challenges like integrations, training needs, and an expensive licensing model.
  • Users find LogicMonitor to be expensive, especially for small teams without a free tier or affordable licenses.
  • Users find the inadequate monitoring capabilities of LogicMonitor frustrating, especially with traditional server workloads and configuration demands.
  • Users find the complexity of integrations and setup challenging, often requiring external tools and training for effective use.

What Are Recent G2 Reviews of LogicMonitor?

What Are G2 Users Discussing About LogicMonitor?

Mezmo

Mezmo built an AI SRE agent that helps SRE and platform teams manage production environments with greater context, control, and trust. It supports autonomous incident detection, investigates incidents, identifies likely root causes, generates post-mortems, and turns repeatable operations work into governed agentic workflows on-call teams can rely on. The agent runs on AURA, Mezmo’s open-source agent harness, and is grounded by Mezmo’s real-time telemetry pipeline. Together, they give the agent task-ready context from logs, metrics, and traces instead of raw data dumps. Mezmo keeps production AI inspectable and controlled. Teams can connect their own models, integrate existing tools through MCP, run workflows on their own infrastructure, and audit every plan, prompt, and tool call. Mezmo is built for SRE and platform teams that want to bring AI into production operations without giving up control, context, or trust.

Average Rating: 4.6/5.0

Total Reviews: 213

How Do G2 Users Rate Mezmo?

  • Alerts: 8.7/10 (Category avg: 8.7/10)
  • Data Sources: 8.9/10 (Category avg: 8.9/10)
  • Has the product been a good partner in doing business?: 9.2/10 (Category avg: 9.0/10)
  • Metric and Event Data: 8.7/10 (Category avg: 8.7/10)

Who Is the Company Behind Mezmo?

  • Seller: Mezmo
  • Year Founded: 2015
  • HQ Location: San Jose, California
  • Twitter: @mezmodata
    1,733 Twitter followers
  • LinkedIn® Page: www.linkedin.com
    62 employees on LinkedIn®

Who Uses This Product?

  • Who Uses This: Software Engineer, CTO
  • Top Industries: Computer Software, Information Technology and Services
  • Company Size: 64% Small, 32% Medium

What Do G2 Reviewers Say About Mezmo?

AI-generated summary from verified user reviews

Pros
  • Users enjoy the ease of use of Mezmo, highlighting its intuitive UI and efficient log analysis capabilities.
  • Users appreciate the ease of log collection and analysis with Mezmo, enhancing incident response efficiency significantly.
  • Users value the real-time monitoring capabilities of Mezmo, streamlining log management and incident response efficiency.
  • Users appreciate the real-time monitoring capabilities of Mezmo, enhancing incident response and simplifying log analysis.
  • Users value the efficiency improvement with Mezmo, significantly enhancing productivity and streamlining log analysis.
Cons
  • Users find the UX improvement necessary, citing complexity and design issues that hinder first-time navigation.
  • Users find the complex setup of Mezmo requires specialized knowledge and significant resources for effective maintenance.
  • Users are concerned about the high costs of Mezmo, especially with rising prices based on log volume.
  • Users find learning Mezmo tricky at first, but appreciate the team's continuous improvements and support.
  • Users are frustrated by the limitation of log levels, missing support for regular console logging and poor documentation.

What Are Recent G2 Reviews of Mezmo?

What Are G2 Users Discussing About Mezmo?

Splunk Infrastructure Monitoring

SignalFx is the only real-time cloud monitoring platform for infrastructure, microservices, and applications. The platform discovers and collects metrics across every component in your cloud environment, replacing traditional point tools and providing real-time predictive analytics. The massively scalable SignalFx architecture is optimized for cloud infrastructure and microservices-based applications, It provides powerful visualization, proactive alerting, and collaborative triage capabilities for organizations of all sizes. SignalFx is used by leading enterprises across high tech, financial services, consumer products, retail, communications, media, entertainment, and web-scale players like Yelp, HubSpot, Acquia, and Kayak. SignalFx is venture-funded by Andreessen Horowitz, Charles River Ventures, and General Catalyst

Average Rating: 4.3/5.0

Total Reviews: 49

How Do G2 Users Rate Splunk Infrastructure Monitoring?

  • Alerts: 8.5/10 (Category avg: 8.7/10)
  • Data Sources: 8.3/10 (Category avg: 8.9/10)
  • Has the product been a good partner in doing business?: 9.2/10 (Category avg: 9.0/10)
  • Metric and Event Data: 8.3/10 (Category avg: 8.7/10)

Who Is the Company Behind Splunk Infrastructure Monitoring?

  • Seller: Cisco
  • Year Founded: 1984
  • HQ Location: San Jose, CA
  • Twitter: @Cisco
    720,366 Twitter followers
  • LinkedIn® Page: www.linkedin.com
    95,294 employees on LinkedIn®
  • Ownership: NASDAQ:CSCO

Who Uses This Product?

  • Who Uses This: Software Engineer
  • Top Industries: Computer Software, Information Technology and Services
  • Company Size: 45% Large, 37% Medium

What Do G2 Reviewers Say About Splunk Infrastructure Monitoring?

AI-generated summary from verified user reviews

Pros
  • Users value the real-time monitoring capabilities of Splunk Infrastructure Monitoring for ensuring seamless performance and uptime.
  • Users appreciate the real-time alerting systems in Splunk, ensuring smooth performance and minimal downtime across all environments.
  • Users value the versatile cloud monitoring capabilities of Splunk Infrastructure Monitoring, facilitating quick insights and alerts.
  • Users value the comprehensive monitoring capabilities of Splunk Infrastructure Monitoring, enhancing insights and operational efficiency.
Cons
  • Users find the difficult learning curve of Splunk Infrastructure Monitoring challenging, impacting their ability to utilize its features effectively.
  • Users face a steep learning curve with Splunk Infrastructure Monitoring, making it challenging to master the application.
  • Users criticize the complex pricing structure based on data volume, making it costly for large enterprises.
  • Users find the cost increase concerning, especially for large enterprises with high log data volumes.
  • Users raise concerns about data limitations, as costs escalate with high volumes of logs processed by Splunk.

What Are Recent G2 Reviews of Splunk Infrastructure Monitoring?

What Are G2 Users Discussing About Splunk Infrastructure Monitoring?

Middleware

Middleware is a full-stack observability platform designed to help users monitor and debug their applications by consolidating all metrics, logs, and traces into a single unified timeline. This solution is particularly beneficial for developers and DevOps teams, as it allows them to identify root causes of issues and resolve them in real time. By breaking down data silos, Middleware enhances visibility across various components of an application, ultimately leading to reduced downtime and improved user experiences. The target audience for Middleware includes businesses of all sizes, from startups to large enterprises, that rely on complex software infrastructures. These organizations often face challenges in monitoring their applications effectively, especially when dealing with multiple data sources. Middleware addresses these challenges by providing a comprehensive suite of monitoring tools that cater to diverse use cases. For instance, teams can leverage log monitoring to track application performance, while real-time monitoring capabilities ensure that any anomalies are detected and addressed promptly. Key features of Middleware include log monitoring, application performance management (APM), infrastructure monitoring, and synthetic monitoring. The unified dashboard is a standout feature, allowing users to view all relevant data—metrics, logs, and traces—consolidated in one place. This holistic view simplifies the debugging process, enabling teams to quickly pinpoint issues and implement solutions. Additionally, Middleware offers alerting and notification functionalities that keep users informed of critical events, ensuring that they can respond to potential problems before they escalate. Root-cause analysis is another essential aspect of Middleware, empowering teams to investigate and understand the underlying factors contributing to application issues. This feature not only aids in immediate problem resolution but also helps in preventing similar issues from arising in the future. Furthermore, the integration of LLM observability enhances the platform's capabilities, providing deeper insights into application behavior and performance. Overall, Middleware stands out in the observability landscape by offering a comprehensive, user-friendly platform that integrates various monitoring tools into a cohesive experience. Its focus on real-time insights and root-cause analysis makes it a valuable asset for organizations looking to optimize their software performance and enhance user satisfaction.

Average Rating: 4.7/5.0

Total Reviews: 55

How Do G2 Users Rate Middleware?

  • Alerts: 9.2/10 (Category avg: 8.7/10)
  • Data Sources: 8.2/10 (Category avg: 8.9/10)
  • Has the product been a good partner in doing business?: 9.2/10 (Category avg: 9.0/10)
  • Metric and Event Data: 9.3/10 (Category avg: 8.7/10)

Who Is the Company Behind Middleware?

  • Seller: Middleware
  • Company Website:
  • Year Founded: 2014
  • HQ Location: San Francisco, California
  • Twitter: @middleware_labs
    301 Twitter followers
  • LinkedIn® Page: linkedin.com
    50 employees on LinkedIn®

Who Uses This Product?

  • Top Industries: Computer Software, Information Technology and Services
  • Company Size: 71% Small, 16% Large

What Do G2 Reviewers Say About Middleware?

AI-generated summary from verified user reviews

Pros
  • Users value the unified, real-time monitoring of Middleware, streamlining issue resolution across diverse environments efficiently.
  • Users appreciate the ease of use of Middleware, with a modern UI that simplifies onboarding and daily workflows.
  • Users value the real-time monitoring capabilities of Middleware, enhancing issue resolution and overall operational efficiency.
  • Users value the unified, real-time dashboard of Middleware, enabling fast diagnostics across diverse environments effortlessly.
  • Users commend the easy setup of Middleware, simplifying integration and enhancing efficiency in DevOps workflows.
Cons
  • Users face integration issues requiring additional configuration, especially with advanced features and legacy systems.
  • Users find the configuration complexity initially challenging, particularly with advanced options and integrations, causing a steep learning curve.
  • Users find the steep learning curve of Middleware challenging, especially for those new to APM concepts and integrations.
  • Users experience a slight learning curve with Middleware, particularly affecting those new to advanced observability tools.
  • Users find the complex setup of Middleware challenging, especially due to manual configurations and a steep learning curve.

What Are Recent G2 Reviews of Middleware?

Sematext Cloud

Sematext Cloud is an innovative, unified platform with all-in-one solutions for infrastructure monitoring, application performance monitoring, log management, real user monitoring, and synthetic monitoring to provide unified, real-time observability of your entire technology stack. It's used by organizations of all sizes and across a wide range of industries, with the goal of driving collaboration between engineering and business teams, reduce the time of root-cause-analysis, understand user behavior and track key business metrics.

Average Rating: 4.7/5.0

Total Reviews: 38

How Do G2 Users Rate Sematext Cloud?

  • Alerts: 8.7/10 (Category avg: 8.7/10)
  • Data Sources: 8.9/10 (Category avg: 8.9/10)
  • Has the product been a good partner in doing business?: 9.5/10 (Category avg: 9.0/10)
  • Metric and Event Data: 8.3/10 (Category avg: 8.7/10)

Who Is the Company Behind Sematext Cloud?

  • Seller: Sematext
  • Year Founded: 2007
  • HQ Location: Brooklyn, NY
  • Twitter: @sematext
    3,758 Twitter followers
  • LinkedIn® Page: www.linkedin.com
    16 employees on LinkedIn®

Who Uses This Product?

  • Top Industries: Information Technology and Services
  • Company Size: 47% Medium, 45% Small

What Are Recent G2 Reviews of Sematext Cloud?

What Are G2 Users Discussing About Sematext Cloud?