Best Enterprise Predictive Analytics Software - Page 2

How Many Predictive Analytics Software Products Does G2 Track?

Total Products under this Category: 425

Category Stats (Oct 2026)

  • Average Rating: 4.44/5 The average rating of products in this category, based on all submitted ratings
  • Top Trending Product: Salesloft (+1.52%) - Among all products in this category, Salesloft recorded the largest rating increase compared to last month

Last updated: October 15, 2026

How Does G2 Rank Predictive Analytics Software Products?

Why You Can Trust G2's Software Rankings:

  • 30 Analysts and Data Experts
  • 32,200+ Authentic Reviews
  • 425+ Products
  • Unbiased Rankings

G2's software rankings are built on verified user reviews, rigorous moderation, and a consistent research methodology maintained by a team of analysts and data experts. Each product is measured using the same transparent criteria, with no paid placement or vendor influence. While reviews reflect real user experiences, which can be subjective, they offer valuable insight into how software performs in the hands of professionals. Together, these inputs power the G2 Score, a standardized way to compare tools within every category.

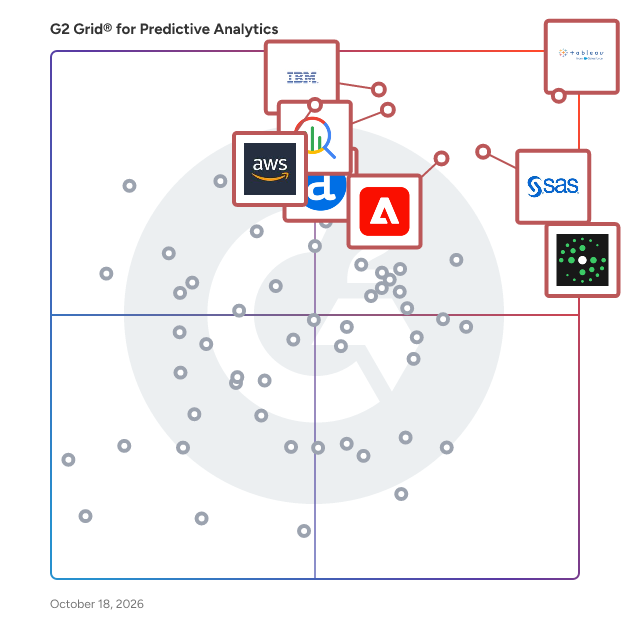
G2 Grid® for Predictive Analytics Software

G2 Grid® for Predictive Analytics Software plotting products by satisfaction and market presence

Highlighted products: Tableau, Salesloft, IBM Cognos Analytics, SAS Viya, Alteryx, Google Cloud BigQuery, Adobe Analytics, and Amazon Quick.

Underlying data: [Grid® JSON](https://www.g2.com/categories/predictive-analytics/grids.json?focus%5B%5D=tableau&focus%5B%5D=salesloft&focus%5B%5D=ibm-cognos-analytics&focus%5B%5D=sas-sas-viya&focus%5B%5D=alteryx&focus%5B%5D=google-cloud-bigquery&focus%5B%5D=adobe-analytics&focus%5B%5D=amazon-quick&segment=enterprise)

IBM SPSS Statistics

IBM SPSS Statistics is an end-to-end statistical solution that simplifies advanced statistical analysis across industries for users of any statistical expertise. It offers comprehensive resources, expert support, and proven reliability to transform complex data into impactful decisions IBM SPSS Statistics recent version 32 release comes up with powerful new features such as AI Output Assistant, Mediation Analysis, Curated Help Designer and many advanced algorithms. IBM SPSS Statistics • offers an easy to use drag and drop interface along with AI Output Assistant to interpret complex statistical output in easy language. • simplifies complex data analysis using advanced statistical techniques that performs data preparation and management, to analysis and reporting. • performs predictive analysis using advanced forecasting procedures to uncover patterns and predict future trends. • creates compelling visual representations to identify trends, derive accurate conclusions and deliver graphs and presentation-ready reports Explore how both individuals and organizations spanning across Industries can simply complex statistical test through an easy to use, accurate ,reliable and secure solution. Use Cases 1. Market Research - Statistical procedures highlighting how to do market research with IBM SPSS 2. Client Acquisition – Emphasizes on how can organizations can acquire more clients and understand consumer behavior 3. Forecasting – Analyze historical sales data, evaluate key trends, predict outcomes relevant to inventory planning 4. Healthcare - Enabling healthcare organizations to improve patient outcomes 5. Government - Empowering Government institutions to take smarter policy decisions 6. Supply Chain - Utilize Statistical Algorithms to make data-driven decisions across procurement, inventory, logistics, and demand planning. Visit here to see what's new in v32 - https://www.ibm.com/products/spss-statistics/whats-new

Average Rating: 4.2/5.0

Total Reviews: 899

G2 Deal: Turn complex data into reliable insights. Get 30% off your first monthly or annual subscriptions. Offer ends 15 April 2026.

Analyze data, forecast trends faster now with AI that interprets results. With IBM SPSS Statistics, you get 30% off your first monthly subscriptions. Offer ends 15 April 2026.

Price: ~~79.00 USD~~ → 55.30 USD

View this exclusive G2 deal

How Do G2 Users Rate IBM SPSS Statistics?

  • Has the product been a good partner in doing business?: 8.0/10 (Category avg: 8.9/10)
  • AI Text Summarization: 10.0/10 (Category avg: 8.1/10)
  • Algorithms: 7.7/10 (Category avg: 8.6/10)
  • AI Text Generation: 10.0/10 (Category avg: 8.1/10)

Who Is the Company Behind IBM SPSS Statistics?

  • Seller: IBM
  • Company Website:
  • Year Founded: 1911
  • HQ Location: Armonk, New York, United States
  • Twitter: @IBMSecurity
    74,660 Twitter followers
  • LinkedIn® Page: www.linkedin.com
    344,328 employees on LinkedIn®

Who Uses This Product?

  • Who Uses This: Research Assistant, Assistant Professor
  • Top Industries: Higher Education, Research
  • Company Size: 43% Large, 30% Medium

What Do G2 Reviewers Say About IBM SPSS Statistics?

AI-generated summary from verified user reviews

Pros
  • Users appreciate the ease of use in SPSS Statistics, enjoying its intuitive interface for complex analyses.
  • Users praise SPSS Statistics for its ease of use in complex statistical analysis, making data handling straightforward and efficient.
  • Users value the strong data management and cleaning capabilities of IBM SPSS Statistics, enhancing accuracy and efficiency in analyses.
  • Users appreciate the intuitive user interface of IBM SPSS Statistics, simplifying complex analysis and saving time.
  • Users value the robust analysis capabilities of IBM SPSS Statistics, enabling data-driven decisions that enhance credibility in UX work.
Cons
  • Users find the high cost of IBM SPSS Statistics to be a significant barrier for smaller teams.
  • Users find the poor visualization in SPSS Statistics hampers usability and complicates data interpretation for stakeholders.
  • Users find the steep learning curve of IBM SPSS Statistics challenging, especially for those new to statistical analysis.
  • Users find the outdated interface of SPSS unappealing and cumbersome compared to modern data analysis tools.
  • Users often experience performance issues with IBM SPSS Statistics, particularly when handling large datasets, impacting usability.

What Are Recent G2 Reviews of IBM SPSS Statistics?

What Are G2 Users Discussing About IBM SPSS Statistics?

IBM SPSS Modeler

The IBM SPSS Modeler is a leading, visual data science and machine learning solution. It helps enterprises accelerate time to value and desired outcome by speeding the operational tasks for data scientists. Leading organizations worldwide rely on IBM for data discovery, predictive analytics, model management and deployment, and machine learning to monetize data assets. The IBM SPSS Modeler empowers organizations to tap data assets and modern applications with complete, out-of-box algorithms and models, suited for hybrid, multi-cloud environments with robust governance and security posture. • Take advantage of open source based innovation including R or Python • Empower data scientists of all skills – programmatic and visual • Exploit multi-cloud approach - on-prem, public or private clouds • Start small and scale to enterprise-wide, governed approach

Average Rating: 4.0/5.0

Total Reviews: 128

How Do G2 Users Rate IBM SPSS Modeler?

  • Has the product been a good partner in doing business?: 8.3/10 (Category avg: 8.9/10)
  • AI Text Summarization: 7.3/10 (Category avg: 8.1/10)
  • Algorithms: 8.0/10 (Category avg: 8.6/10)
  • AI Text Generation: 7.3/10 (Category avg: 8.1/10)

Who Is the Company Behind IBM SPSS Modeler?

  • Seller: IBM
  • Year Founded: 1911
  • HQ Location: Armonk, New York, United States
  • Twitter: @IBMSecurity
    74,660 Twitter followers
  • LinkedIn® Page: www.linkedin.com
    344,328 employees on LinkedIn®
  • Ownership: SWX:IBM

Who Uses This Product?

  • Top Industries: Higher Education, Education Management
  • Company Size: 53% Large, 24% Medium

What Do G2 Reviewers Say About IBM SPSS Modeler?

AI-generated summary from verified user reviews

Pros
  • Users appreciate the robust analytical modeling capabilities of IBM SPSS Modeler, enhancing data manipulation and preparation efficiency.
  • Users value the seamless data manipulation and robust analytical modeling capabilities of IBM SPSS Modeler for BI applications.
  • Users value the seamless data access in IBM SPSS Modeler, enhancing their ability to work with various datasets effectively.
  • Users value the seamless data manipulation capabilities of IBM SPSS Modeler, enhancing efficiency in BI tools integration.
  • Users value the seamless data visualization capabilities of IBM SPSS Modeler, enhancing their analytical precision and efficiency.
Cons
  • Users find the expensive licensing costs of IBM SPSS Modeler to be a significant drawback for individual use.
  • Users find the licensing costs prohibitive, making IBM SPSS Modeler an expensive choice for many.

What Are Recent G2 Reviews of IBM SPSS Modeler?

What Are G2 Users Discussing About IBM SPSS Modeler?

Rapidminer AI Studio

Rapidminer AI Studio is a data science tool that anyone can use to design and prototype highly explainable AI and machine learning models that help build trust throughout an organization. Rapidminer AI Studio includes: - Full generative AI functionality with access to hundreds of large language models (LLMs). - Intuitive and powerful drag-and-drop canvases that give users code-like control without complexity. - Award-winning auto ML with automated clustering, predictive modeling, feature engineering, and time series forecasting. - Data connectivity, exploration, and preparation. - Deploy and manage AI projects and models at enterprise scale. - Collaborate with team members in the same environment without having to worry about overwriting each other's work. - Unify the entire data science lifecycle from data exploration and machine learning to model operations and visualization and deploy in the cloud. Rapidminer AI Studio helps users make powerful insights accessible to the entire organization and can scale seamlessly for users and enterprises. Rapidminer AI studio enables organizations to derive significant value from AI with minimal cost and operational impact.

Average Rating: 4.6/5.0

Total Reviews: 512

How Do G2 Users Rate Rapidminer AI Studio?

  • Has the product been a good partner in doing business?: 8.9/10 (Category avg: 8.9/10)
  • AI Text Summarization: 7.0/10 (Category avg: 8.1/10)
  • Algorithms: 8.6/10 (Category avg: 8.6/10)
  • AI Text Generation: 7.3/10 (Category avg: 8.1/10)

Who Is the Company Behind Rapidminer AI Studio?

Who Uses This Product?

  • Who Uses This: Student, Professor
  • Top Industries: Higher Education, Education Management
  • Company Size: 41% Small, 31% Large

What Do G2 Reviewers Say About Rapidminer AI Studio?

AI-generated summary from verified user reviews

Pros
  • Users praise the ease of use of Altair AI Studio, finding its interface intuitive and beneficial for data tasks.
  • Users value the no-code machine learning capabilities of Altair AI Studio, facilitating easy model creation and analysis.
  • Users value the seamless AI integration of Altair AI Studio, enhancing decision-making and improving efficiency across organizations.
  • Users appreciate the advanced machine learning and data analytics in Altair AI Studio for smarter decision-making and efficiency.
  • Users value the automation capabilities of Altair AI Studio, enhancing efficiency in data processing and decision making.
Cons
  • Users find the complexity of Altair AI Studio challenging, particularly with language support and integrating legacy systems.
  • Users experience slower performance when handling large datasets in Altair AI Studio, affecting their efficiency and experience.
  • Users experience slow performance when handling large datasets, leading to slowdowns or freezing during usage.
  • Users find the complexity issues of Altair AI Studio frustrating, especially due to limited support resources.
  • Users find the complex usage of Altair AI Studio challenging, especially due to limited documentation and steep learning curve.

What Are Recent G2 Reviews of Rapidminer AI Studio?

What Are G2 Users Discussing About Rapidminer AI Studio?

AI can help you find the answers. G2 helps you trust them.

Connect G2 to Claude or ChatGPT for answers grounded in G2's trusted reviews, comparisons, and pricing from real user insights.

How it works

Qlik Sense

Qlik Sense empowers people to make better data-driven decisions and take action. The solution provides augmented analytics for every business need from visualization and dashboards to natural language analytics, custom and embedded analytics, reporting and alerting. Our unique associative technology enhances human intuition with AI-powered insights, offering unmatched capabilities for combining data and exploring information. It indexes the associations in your data, and exposes related and unrelated values as you click, revealing hidden insights that would be missed by query-based tools. And it performs calculations as fast as you can think. Qlik Sense helps users move from passive to active analytics for real-time collaboration and action. And you get robust data integration, application automation and the convenience of SaaS with hybrid multi-cloud capabilities. See why we’ve been named a Gartner Magic Quadrant Leader for Analytics and BI platforms for 11 years in a row. Visit us at https://www.qlik.com/us/

Average Rating: 4.4/5.0

Total Reviews: 762

How Do G2 Users Rate Qlik Sense?

  • Has the product been a good partner in doing business?: 8.5/10 (Category avg: 8.9/10)
  • AI Text Summarization: 8.3/10 (Category avg: 8.1/10)
  • Algorithms: 8.3/10 (Category avg: 8.6/10)
  • AI Text Generation: 8.5/10 (Category avg: 8.1/10)

Who Is the Company Behind Qlik Sense?

  • Seller: Qlik
  • Year Founded: 1993
  • HQ Location: Radnor, PA
  • Twitter: @qlik
    64,130 Twitter followers
  • LinkedIn® Page: www.linkedin.com
    4,399 employees on LinkedIn®
  • Phone: 1 (888) 994-9854

Who Uses This Product?

  • Who Uses This: Consultant, Analyst
  • Top Industries: Information Technology and Services, Computer Software
  • Company Size: 41% Large, 41% Medium

What Do G2 Reviewers Say About Qlik Sense?

AI-generated summary from verified user reviews

Pros
  • Users love the ease of use in Qlik Sense, enhancing their productivity with minimal IT support needed.
  • Users commend the robust data visualization capabilities of Qlik Sense, enhancing insights with its user-friendly interface.
  • Users appreciate the rapid development capabilities of Qlik Sense, enabling quick creation and deployment of analytics applications.
  • Users value the robust data visualization capabilities of Qlik Sense, enhancing their insights and business strategies.
  • Users value the versatile and user-friendly tools in Qlik Sense, enhancing data representation and insights across levels.
Cons
  • Users find the limited features of Qlik Sense restrict their ability to create custom visualizations effectively.
  • Users find the missing features in Qlik Sense restrictive, particularly lacking personal object additions and static report options.
  • Users find Qlik Sense expensive, which limits its accessibility despite its capabilities.
  • Users note the limited automation in data updates and desire better organization and visualization capabilities in Qlik Sense.
  • Users find the learning curve steep, especially with scripting functions and integration challenges for beginners.

What Are Recent G2 Reviews of Qlik Sense?

What Are G2 Users Discussing About Qlik Sense?

APEX

APEX by LeanDNA is the factory-focused platform for AI-powered expert execution to establish command of supply planning and materials management. It powers optimized decisions and operations through materials visibility, predictive insights, supplier collaboration, and recommended actions. APEX synchronizes people, materials, and sites with data centralization, AI, and machine learning to analyze supply conditions, predict risks, connect across suppliers, and outline the best actions to protect and optimize production. With core capabilities spanning data visibility and AI, supply insights, procurement management, and inventory optimization, APEX transforms fragmented data into supply chain intelligence that drives confident, precise execution. Teams eliminate operational guesswork, respond faster to disruption, and improve performance with smarter prioritization and optimized supply strategies.

Average Rating: 4.5/5.0

Total Reviews: 128

How Do G2 Users Rate APEX?

  • Has the product been a good partner in doing business?: 9.0/10 (Category avg: 8.9/10)
  • AI Text Summarization: 6.3/10 (Category avg: 8.1/10)
  • Algorithms: 7.6/10 (Category avg: 8.6/10)
  • AI Text Generation: 6.2/10 (Category avg: 8.1/10)

Who Is the Company Behind APEX?

  • Seller: LeanDNA
  • Company Website:
  • Year Founded: 2014
  • HQ Location: Austin, Texas, United States
  • LinkedIn® Page: www.linkedin.com
    95 employees on LinkedIn®

Who Uses This Product?

  • Who Uses This: Approvisionneur
  • Top Industries: Manufacturing, Aviation & Aerospace
  • Company Size: 51% Medium, 38% Large

What Do G2 Reviewers Say About APEX?

AI-generated summary from verified user reviews

Pros
  • Users find the ease of use of LeanDNA exceptional, enhancing efficiency with intuitive workflows and accessible support.
  • Users commend the phenomenal customer support from LeanDNA, which enhances implementation and addresses business needs effectively.
  • Users value the visibility and structure LeanDNA provides for efficient supplier performance management and communication.
  • Users appreciate the clear logic and task management features of APEX, enhancing collaboration and efficiency.
  • Users find APEX's time-saving features invaluable, enhancing efficiency with intuitive workflows and advanced analytics.
Cons
  • Users experience complex usability challenges, often struggling with frequent changes and feature limitations that hinder daily workflows.
  • Users find the limited customization options frustrating, restricting their ability to tailor the tool to specific needs.
  • Users find the missing filtering options in APEX limiting, impacting their analysis and decision-making capabilities.
  • Users note data inaccuracy in APEX, as updates are not in real-time and depend on external forecasts.
  • Users find the learning curve steep, but support helps navigate the complexity over time.

What Are Recent G2 Reviews of APEX?

TrendMiner

TrendMiner offers a fast, powerful, and intuitive industrial analytics & AI software platform. With a focus on highly digitized manufacturing industries, energy companies, and organizations with operations that need to maintain controlled environments. TrendMiner combines self-service, low-code data analysis for time series and event data with sophisticated machine learning (ML) and Agentic AI tools to deliver industrial data visualization, monitoring, and predictive capabilities. TrendMiner, a Vercore company, was founded in 2008 with a global headquarters located in Belgium, and offices in the U.S., Germany, Spain, and the Netherlands. TrendMiner has strategic partnerships with Amazon, Microsoft, SAP, GE Digital, Siemens, and Aveva, and offers standard integrations with a wide range of data platforms such as AVEVA PI, Yokogawa Exaquantum, AspenTech IP.21, Honeywell PHD, GE Proficy Historian, Canary, and Aveva Historian.

Average Rating: 4.6/5.0

Total Reviews: 197

How Do G2 Users Rate TrendMiner?

  • Has the product been a good partner in doing business?: 9.4/10 (Category avg: 8.9/10)
  • AI Text Summarization: 6.6/10 (Category avg: 8.1/10)
  • Algorithms: 7.8/10 (Category avg: 8.6/10)
  • AI Text Generation: 6.6/10 (Category avg: 8.1/10)

Who Is the Company Behind TrendMiner?

  • Seller: TrendMiner
  • Company Website:
  • Year Founded: 2008
  • HQ Location: Hasselt, Flemish Region
  • Twitter: @TrendMining
    777 Twitter followers
  • LinkedIn® Page: www.linkedin.com
    89 employees on LinkedIn®

Who Uses This Product?

  • Who Uses This: Process Engineer, Process Analytics Engineer
  • Top Industries: Chemicals, Oil & Energy
  • Company Size: 51% Large, 35% Medium

What Do G2 Reviewers Say About TrendMiner?

AI-generated summary from verified user reviews

Pros
  • Users value the intuitive design of TrendMiner, making it easy to navigate and enhancing their overall experience.
  • Users value the speed of TrendMiner, enabling quick insights and efficient data analysis.
  • Users value the quick insights TrendMiner provides, making data-driven decisions easier and enhancing operational monitoring.
  • Users value the real-time monitoring capabilities of TrendMiner, enabling quick checks and insights on production status.
  • Users value the responsive and helpful customer support of TrendMiner, enhancing their overall experience with the product.
Cons
  • Users find complex usability in TrendMiner, struggling with connectivity and inadequate training materials for new users.
  • Users find the difficult learning curve of TrendMiner frustrating, as advanced features demand significant technical expertise.
  • Users find the complexity of advanced functions in TrendMiner necessitating training and cumbersome system administration.
  • Users find the learning curve steep, as mastering TrendMiner's extensive features requires significant time and training.
  • Users note the tool limitations of TrendMiner, including lack of a mobile app and restrictive nesting and calculations.

What Are Recent G2 Reviews of TrendMiner?

What Are G2 Users Discussing About TrendMiner?

Minitab Statistical Software

Minitab Statistical Software is a comprehensive statistical analysis solution designed to assist organizations in understanding their data, identifying opportunities for improvement, and making informed decisions. This software caters to users with varying levels of statistical expertise, offering an intuitive interface that simplifies advanced analysis while providing the necessary depth for analysts to tackle complex questions. With Minitab, users can explore and visualize data, test hypotheses, model relationships, and evaluate process performance through a robust suite of tools, including regression analysis, ANOVA, design of experiments, time series analysis, control charts, capability analysis, and reliability analysis. Targeted at a diverse audience that includes data analysts, quality improvement professionals, and engineers, Minitab is particularly valuable in industries such as manufacturing, healthcare, and R&D. Its guided features, such as the Assistant and Graph Builder, empower users to select the most appropriate analyses for their data and interpret results effectively, making it easier to derive actionable insights. One of the standout features of Minitab is its integration with Minitab Solution Center, a connected, cloud-based platform that enhances the overall analytical process. This platform allows teams to prepare and explore data, conduct statistical analyses, create interactive dashboards, and organize project workflows. By facilitating collaboration and communication, the Solution Center helps teams transition from problem identification to evaluating potential solutions, thus streamlining the entire process of data-driven decision-making. The capabilities offered in Minutab Solution Center work in tandem to provide a cohesive experience for teams engaged in analytical projects. Users can investigate patterns and sources of variation, share insights with stakeholders, and utilize results to inform decisions and drive improvements. Depending on their subscription level, organizations can also access additional tools for process mapping, predictive analytics, and advanced experimentation, further enhancing their analytical capabilities. Minitab Statistical Software stands out in its category by combining user-friendly features with powerful analytical tools, making it an essential resource for organizations aiming to leverage data for strategic decision-making and continuous improvement.

Average Rating: 4.6/5.0

Total Reviews: 221

How Do G2 Users Rate Minitab Statistical Software?

  • Has the product been a good partner in doing business?: 8.6/10 (Category avg: 8.9/10)
  • AI Text Summarization: 7.4/10 (Category avg: 8.1/10)
  • Algorithms: 8.3/10 (Category avg: 8.6/10)
  • AI Text Generation: 7.3/10 (Category avg: 8.1/10)

Who Is the Company Behind Minitab Statistical Software?

  • Seller: Minitab
  • Company Website:
  • Year Founded: 1972
  • HQ Location: State College, Pennsylvania, United States
  • Twitter: @Minitab
    5,017 Twitter followers
  • LinkedIn® Page: www.linkedin.com
    732 employees on LinkedIn®

Who Uses This Product?

  • Who Uses This: Quality Manager
  • Top Industries: Automotive, Manufacturing
  • Company Size: 46% Large, 32% Medium

What Do G2 Reviewers Say About Minitab Statistical Software?

AI-generated summary from verified user reviews

Pros
  • Users appreciate the ease of use of Minitab Statistical Software, enjoying its intuitive interface and efficient setup.
  • Users appreciate the ease of use of Minitab, enhancing their overall data analysis experience significantly.
  • Users value the user-friendly guides in Minitab, enhancing the ease of statistical analysis and improving overall experience.
  • Users find Minitab to have a user-friendly interface that simplifies statistical analysis and methodology selection.
  • Users value the robust analysis capabilities of Minitab, enabling effortless and detailed statistical evaluations for informed decision-making.
Cons
  • Users find Minitab's licensing fees expensive, making it difficult to justify for infrequent use.
  • Users find Minitab's steep learning curve challenging, often requiring more training and clearer guidance for effective use.
  • Users find the complexity of Minitab's interface and functionality hinders ease of use and workflow efficiency.
  • Users find Minitab's interface not user-friendly, citing outdated design and confusing menus that complicate the experience.
  • Users face data management issues in Minitab, complicating dataset handling and analysis processes.

What Are Recent G2 Reviews of Minitab Statistical Software?

What Are G2 Users Discussing About Minitab Statistical Software?

IBM Watson Studio

IBM Watson Studio on IBM Cloud Pak for Data is a leading data science and machine learning solution that helps enterprises accelerate AI-powered digital transformation. It allows businesses to scale trustworthy AI and optimize decisions. Build, run, and manage AI models on any cloud through an automated end-to-end AI lifecycle--simplifying experimentation and deployment, speeding up data exploration and preparation, and improving model development and training. Govern and monitor models to mitigate drift and bias, and manage model risk. Build a ModelOps practice that synchronizes application and model pipelines to operationalize responsible, explainable AI across your enterprise. As a key offering of IBM Cloud Pak for Data, a unified data and AI platform, Watson Studio integrates seamlessly with data management services, data privacy and security capabilities, AI application tooling, open source frameworks, and a robust technology ecosystem. It unites teams and empowers businesses to build the modern information architecture that AI requires and infuse it across the organization. IBM Watson Studio is code-optional, allowing both data scientists and business analysts to work on the same platform by providing the best of open source tools along with visual, drag-and-drop capabilities. It enables organizations to tap into data assets and inject predictions into business processes and modern applications—helping them maximize their business value. It's suited for hybrid multicloud environments that demand mission-critical performance, security, and governance. Features include: • AutoAI that eliminates time-consuming, repetitive tasks by automating data preparation, model development, feature engineering and hyperparameter optimization. • Text Analytics for uncovering insights from unstructured data • Drag-and-drop visual model-building with SPSS Modeler • Broad data access – flat files, spreadsheets, major relational databases • Sophisticated graphics engine for building stunning visualizations • Support for Python 3 Notebooks Watson Studio is available via several deployment options: • IBM Cloud Pak for Data – An open, extensible data and AI platform that runs on any cloud • IBM Cloud Pak for Data System – A hybrid cloud, on-premises platform-in-a-box • IBM Cloud Pak for Data as a Service – A set of IBM Cloud Pak for Data platform services fully managed on the IBM Cloud

Average Rating: 4.2/5.0

Total Reviews: 164

How Do G2 Users Rate IBM Watson Studio?

  • Has the product been a good partner in doing business?: 8.0/10 (Category avg: 8.9/10)
  • AI Text Summarization: 8.3/10 (Category avg: 8.1/10)
  • Algorithms: 8.1/10 (Category avg: 8.6/10)
  • AI Text Generation: 9.3/10 (Category avg: 8.1/10)

Who Is the Company Behind IBM Watson Studio?

  • Seller: IBM
  • Year Founded: 1911
  • HQ Location: Armonk, New York, United States
  • Twitter: @IBMSecurity
    74,660 Twitter followers
  • LinkedIn® Page: www.linkedin.com
    344,328 employees on LinkedIn®
  • Ownership: SWX:IBM

Who Uses This Product?

  • Who Uses This: Software Engineer, CEO
  • Top Industries: Information Technology and Services, Computer Software
  • Company Size: 49% Large, 31% Small

What Do G2 Reviewers Say About IBM Watson Studio?

AI-generated summary from verified user reviews

Pros
  • Users admire the Auto AI capability of IBM Watson Studio, significantly reducing manual work and streamlining data projects.
  • Users appreciate the Auto AI capability of IBM Watson Studio, significantly reducing time spent on manual data tasks.
  • Users appreciate the user-friendly interface of IBM Watson Studio, facilitating seamless integration and efficient project collaboration.
  • Users appreciate the Auto AI capability of IBM Watson Studio, significantly reducing manual work in data preprocessing.
  • Users appreciate the easy AI integration in IBM Watson Studio, significantly enhancing their data science and ML workflows.
Cons
  • Users find the high cost of IBM Watson Studio challenging, especially for individuals and small startups.
  • Users find the steep learning curve of IBM Watson Studio challenging, making it difficult for beginners to navigate.
  • Users experience a steep learning curve with IBM Watson Studio, making it challenging for beginners to navigate its features.
  • Users find the complex interface of IBM Watson Studio challenging, particularly for those just starting out.
  • Users find the steep learning curve of IBM Watson Studio challenging, particularly for beginners navigating its complex features.

What Are Recent G2 Reviews of IBM Watson Studio?

What Are G2 Users Discussing About IBM Watson Studio?

DataRobot

DataRobot’s enterprise AI platform democratizes data science with end-to-end automation for building, deploying, and managing machine learning models. This platform maximizes business value by delivering AI at scale and continuously optimizing performance over time. The company’s proven combination of cutting edge software and world-class AI implementation, training, and support services, empowers any organization – regardless of size, industry, or resources – to drive better business outcomes with AI.

Average Rating: 4.4/5.0

Total Reviews: 51

How Do G2 Users Rate DataRobot?

  • Has the product been a good partner in doing business?: 8.4/10 (Category avg: 8.9/10)
  • AI Text Summarization: 10.0/10 (Category avg: 8.1/10)
  • Algorithms: 8.9/10 (Category avg: 8.6/10)
  • AI Text Generation: 8.3/10 (Category avg: 8.1/10)

Who Is the Company Behind DataRobot?

  • Seller: DataRobot
  • Year Founded: 2012
  • HQ Location: Boston, Massachusetts
  • Twitter: @DataRobot
    19,225 Twitter followers
  • LinkedIn® Page: www.linkedin.com
    886 employees on LinkedIn®

Who Uses This Product?

  • Top Industries: Computer Software, Information Technology and Services
  • Company Size: 48% Small, 39% Medium

What Are Recent G2 Reviews of DataRobot?

KNIME

KNIME helps everybody make sense of data. Its free and open source KNIME Analytics Platform enables anyone — whether they come from a business, technical or data background — to intuitively work with data, every day. KNIME Business Hub is the commercial complement to KNIME Analytics Platform and enables users to collaborate on data science and share insights across the organization. Together, the products support the complete data science lifecycle, allowing teams at all levels of analytics readiness to support the operationalization of data and to build a scalable data science practice.

Average Rating: 4.5/5.0

Total Reviews: 125

How Do G2 Users Rate KNIME?

  • Has the product been a good partner in doing business?: 8.5/10 (Category avg: 8.9/10)
  • AI Text Summarization: 7.6/10 (Category avg: 8.1/10)
  • Algorithms: 8.2/10 (Category avg: 8.6/10)
  • AI Text Generation: 7.6/10 (Category avg: 8.1/10)

Who Is the Company Behind KNIME?

  • Seller: KNIME
  • Company Website:
  • Year Founded: 2008
  • HQ Location: Zurich, Switzerland
  • Twitter: @knime
    7,998 Twitter followers
  • LinkedIn® Page: www.linkedin.com
    245 employees on LinkedIn®

Who Uses This Product?

  • Top Industries: Information Technology and Services, Higher Education
  • Company Size: 43% Large, 31% Medium

What Do G2 Reviewers Say About KNIME?

AI-generated summary from verified user reviews

Pros
  • Users find KNIME's ease of use enhances productivity, enabling even non-technical individuals to build workflows effortlessly.
  • Users find KNIME's coding ease remarkable, enabling effortless workflows without requiring extensive technical skills.
  • Users find KNIME to be an easy-to-learn platform, enabling quick workflow creation without coding skills.
  • Users find KNIME easy to learn and start delivering results, thanks to its intuitive visual workflow interface.
  • Users love the easy and intuitive data visualization capabilities of KNIME, enhancing understanding and communication of data insights.
Cons
  • Users find the initial learning curve challenging, especially for those unfamiliar with data science concepts and visual programming.
  • Users face memory usage issues with KNIME, leading to slow performance, especially with larger files and operations.
  • Users report storage limitations with KNIME, leading to performance issues and difficulties with large datasets.
  • Users note that data management issues hinder their experience, especially with file handling and certain databases.
  • Users find the lack of learning resources for KNIME to be a significant barrier to effective usage.

What Are Recent G2 Reviews of KNIME?

What Are G2 Users Discussing About KNIME?

SAS Enterprise Miner

SAS Enterprise Miner is a comprehensive data mining and predictive analytics software designed to streamline the process of developing descriptive and predictive models. It enables users to analyze vast amounts of data efficiently, uncovering patterns and relationships that inform better decision-making. With an intuitive graphical user interface, SAS Enterprise Miner facilitates the entire data mining process, from data preparation to model assessment, making advanced analytics accessible to both technical and non-technical users. Key Features and Functionality: - User-Friendly Interface: An interactive GUI allows users to build process flow diagrams, simplifying the modeling process. - Advanced Data Preparation: Tools for handling missing values, filtering outliers, and performing data transformations enhance data quality. - Diverse Modeling Techniques: Supports a wide range of algorithms, including decision trees, neural networks, and regression models, catering to various analytical needs. - Open Source Integration: Seamless integration with R enables users to perform data transformations and model training within the platform. - High-Performance Capabilities: Incorporates high-performance data mining nodes to boost processing efficiency. - Automated Scoring: Generates score code in multiple languages (SAS, C, Java, PMML) for deployment across various environments. - Model Comparison and Management: Features for comparing multiple models using lift curves and statistical diagnostics to identify the best-performing models. Primary Value and Solutions Provided: SAS Enterprise Miner empowers organizations to harness the full potential of their data by providing a robust platform for developing accurate predictive models. It addresses challenges such as fraud detection, risk minimization, resource demand forecasting, and customer attrition reduction. By automating and simplifying complex data mining tasks, it enables users to make informed, data-driven decisions, ultimately enhancing operational efficiency and competitive advantage.

Average Rating: 4.2/5.0

Total Reviews: 185

How Do G2 Users Rate SAS Enterprise Miner?

  • Has the product been a good partner in doing business?: 8.3/10 (Category avg: 8.9/10)
  • AI Text Summarization: 7.4/10 (Category avg: 8.1/10)
  • Algorithms: 8.0/10 (Category avg: 8.6/10)
  • AI Text Generation: 7.4/10 (Category avg: 8.1/10)

Who Is the Company Behind SAS Enterprise Miner?

  • Seller: SAS Institute
  • Year Founded: 1976
  • HQ Location: Cary, NC
  • Twitter: @SASsoftware
    60,863 Twitter followers
  • LinkedIn® Page: www.linkedin.com
    15,122 employees on LinkedIn®
  • Phone: 1-800-727-0025

Who Uses This Product?

  • Top Industries: Higher Education, Information Technology and Services
  • Company Size: 60% Large, 28% Medium

What Do G2 Reviewers Say About SAS Enterprise Miner?

AI-generated summary from verified user reviews

Pros
  • Users appreciate the ease of installation in SAS Enterprise Miner, allowing for quick node-based analysis setup.
  • Users appreciate the ease of node-based analysis in SAS Enterprise Miner, enhancing their analytical workflow.
  • Users value the ease of creating node-based analyses with SAS Enterprise Miner, enhancing their analytical capabilities.
Cons
  • Users find the learning curve steep, especially when generating output to other SAS products as beginners.
  • Users find SAS Enterprise Miner not user-friendly, especially when generating output without sufficient experience.
  • Users find the steep learning curve of SAS Enterprise Miner challenging, especially when generating output to other SAS products.

What Are Recent G2 Reviews of SAS Enterprise Miner?

What Are G2 Users Discussing About SAS Enterprise Miner?

Qlik Predict

Qlik AutoML (automated machine learning) brings AI-generated machine learning models and predictive analytics directly to your organization’s larger community of analytics users and teams, in a simple user experience focused on augmenting their intuition through machine intelligence. With AutoML, you can easily generate machine learning models, make predictions, and plan decisions – all within an intuitive, code-free user interface. Machine learning (ML) is a branch of artificial intelligence (AI) focused on the process of recognizing patterns in historical data to predict outcomes in the future. ML uses historically observed data as an input, applies a mathematical process against that data, and creates an output called a machine learning model based on patterns in historical data. This model can then be used to make future predictions and test scenarios.

Average Rating: 4.4/5.0

Total Reviews: 78

How Do G2 Users Rate Qlik Predict?

  • Has the product been a good partner in doing business?: 8.9/10 (Category avg: 8.9/10)
  • AI Text Summarization: 6.7/10 (Category avg: 8.1/10)
  • Algorithms: 8.2/10 (Category avg: 8.6/10)
  • AI Text Generation: 6.7/10 (Category avg: 8.1/10)

Who Is the Company Behind Qlik Predict?

  • Seller: Qlik
  • Year Founded: 1993
  • HQ Location: Radnor, PA
  • Twitter: @qlik
    64,130 Twitter followers
  • LinkedIn® Page: www.linkedin.com
    4,399 employees on LinkedIn®
  • Phone: 1 (888) 994-9854

Who Uses This Product?

  • Who Uses This: Data Analyst
  • Top Industries: Information Technology and Services, Computer Software
  • Company Size: 38% Large, 31% Small

What Do G2 Reviewers Say About Qlik Predict?

AI-generated summary from verified user reviews

Pros
  • Users value the automation features of Qlik Predict, enabling seamless machine learning model creation and integration without coding.
  • Users enjoy the ease of use of Qlik Predict, benefiting from a friendly no-code interface and intuitive automation.
  • Users value the intuitive AI integration of Qlik Predict, enabling quick, no-code machine learning model deployment.
  • Users appreciate the user-friendly, no-code approach of Qlik Predict, enabling accessible machine learning for everyone.
  • Users value the user-friendly AI capabilities of Qlik Predict, enabling easy deployment of predictive models without coding.
Cons
  • Users note the limited customization of Qlik Predict, which may hinder advanced users seeking more control over their models.
  • Users experience deployment issues due to limited model flexibility and integration options within Qlik Predict.
  • Users note the lack of features in Qlik Predict, particularly regarding customization and deployment flexibility.
  • Users find the required knowledge of data science a barrier, limiting optimizations and effective model interpretation.
  • Users note the limited flexibility of Qlik Predict, particularly due to its no-code approach and ecosystem restrictions.

What Are Recent G2 Reviews of Qlik Predict?

What Are G2 Users Discussing About Qlik Predict?

Seeq

Seeq is a global leader in industrial AI that brings together operational data, human expertise, and AI to help industrial organizations accelerate better decisions and measurable outcomes. Seeq captures and connects the knowledge of subject matter experts, making proven approaches easier to access, apply, and scale across teams, assets, and sites. With transparent, traceable AI, Seeq helps organizations move from insight to action while keeping human judgment at the center. Trusted by leading industrial companies, Seeq supports improvements in reliability, efficiency, sustainability, workforce productivity, and profitability. Seeq helps every industrial decision benefit from collective knowledge, operational context, and intelligent action.

Average Rating: 4.6/5.0

Total Reviews: 145

How Do G2 Users Rate Seeq?

  • Has the product been a good partner in doing business?: 8.8/10 (Category avg: 8.9/10)
  • AI Text Summarization: 6.9/10 (Category avg: 8.1/10)
  • Algorithms: 7.6/10 (Category avg: 8.6/10)
  • AI Text Generation: 7.2/10 (Category avg: 8.1/10)

Who Is the Company Behind Seeq?

  • Seller: Seeq Corporation
  • Company Website:
  • Year Founded: 2013
  • HQ Location: Seattle, Washington
  • Twitter: @SeeqCorporation
    959 Twitter followers
  • LinkedIn® Page: www.linkedin.com
    334 employees on LinkedIn®

Who Uses This Product?

  • Who Uses This: Process Engineer
  • Top Industries: Oil & Energy, Chemicals
  • Company Size: 58% Large, 32% Medium

What Do G2 Reviewers Say About Seeq?

AI-generated summary from verified user reviews

Pros
  • Users value the capability to analyze and visualize complex data sets effectively with Seeq's user-friendly design.
  • Users appreciate the ease of use of Seeq, as it simplifies data analysis for professionals across various fields.
  • Users value the transformative capabilities of Seeq in delivering actionable insights for enhanced decision-making and performance.
  • Users appreciate the intuitive analysis capabilities of Seeq, making it easy to explore and identify data trends.
  • Users value the automation capabilities of Seeq, significantly improving efficiency and decision-making in data analysis.
Cons
  • Users find the difficult learning curve of Seeq challenging, especially when trying to navigate the tool independently.
  • Users find the complex usability of Seeq challenging, especially when visualizing LIMS and time series data.
  • Users find the learning curve steep, especially when navigating the tool without guidance, requiring engineering knowledge for full usage.
  • Users find the learning difficulty of Seeq to be challenging, especially when trying to master its formula functions.
  • Users find the interface challenging for visualizing data and express a need for improved dashboard features.

What Are Recent G2 Reviews of Seeq?

What Are G2 Users Discussing About Seeq?

TIMi

TIMi is the most efficient Data Science and Data Processing Platform. Since 2007, we have been creating and improving the most powerful framework to push the barriers of analytics, predictive analytics, AI and Big Data, while offering a helpful, fast and friendly environment. The TIMi Suite consists of four tools: 1. Anatella (Analytical ETL, Data Prep & Big Data), 2. Modeler (Auto-ML / Automated Predictive Modelling / Automated-AI), 3. StarDust (3D Segmentation) 4. Kibella (BI Dashboarding solution). TIMi dominates the Data Science market: In the "Summer 2022 - Momentum Report” from G2, in the “Data Science” category, TIMi has the #1 rank: TIMi is the Data Science solution with both the highest market growth and the highest customer-satisfaction! More about this subject here: https://timi.eu/blog/timi-the-number-one-data-science-platform/

Average Rating: 4.8/5.0

Total Reviews: 50

How Do G2 Users Rate TIMi?

  • Has the product been a good partner in doing business?: 9.1/10 (Category avg: 8.9/10)
  • AI Text Summarization: 8.3/10 (Category avg: 8.1/10)
  • Algorithms: 9.1/10 (Category avg: 8.6/10)
  • AI Text Generation: 9.2/10 (Category avg: 8.1/10)

Who Is the Company Behind TIMi?

  • Seller: TIMi SPRL
  • Year Founded: 2007
  • HQ Location: Brussels
  • Twitter: @TIMiSuite
    3,532 Twitter followers
  • LinkedIn® Page: www.linkedin.com
    86 employees on LinkedIn®

Who Uses This Product?

  • Top Industries: Information Technology and Services, Banking
  • Company Size: 40% Small, 32% Large

What Do G2 Reviewers Say About TIMi?

AI-generated summary from verified user reviews

Pros
  • Users highlight the exceptional customer support from the TIMi team, noting their quick response times and helpfulness.
  • Users find TIMi easy to use, thanks to its intuitive design and quick learning curve.
  • Users appreciate TIMi's user-friendly interface and exceptional support, making data transformation quick and efficient.
  • Users value the fast and intuitive automation capabilities of TIMi, streamlining data transformations and analyses effectively.
  • Users value the intuitive charting features of TIMi, enabling efficient data visualization and analysis.

What Are Recent G2 Reviews of TIMi?

What Are G2 Users Discussing About TIMi?

Mathematica

Mathematica is a computational software program based on symbolic mathematics, developed by Wolfram Research.

Average Rating: 4.1/5.0

Total Reviews: 86

How Do G2 Users Rate Mathematica?

  • Has the product been a good partner in doing business?: 5.8/10 (Category avg: 8.9/10)

Who Is the Company Behind Mathematica?

  • Seller: Wolfram Research
  • Year Founded: 1987
  • HQ Location: Champaign, US
  • Twitter: @WolframResearch
    68,699 Twitter followers
  • LinkedIn® Page: www.linkedin.com
    629 employees on LinkedIn®

Who Uses This Product?

  • Who Uses This: Research Assistant
  • Top Industries: Research, Information Technology and Services
  • Company Size: 45% Large, 31% Small

What Are Recent G2 Reviews of Mathematica?

What Are G2 Users Discussing About Mathematica?

Bijou Barry
BB
Researched and written by Bijou Barry
Updated