Best Big Data Analytics Software

How Many Big Data Analytics Software Products Does G2 Track?

Total Products under this Category: 113

Category Stats (Sep 2026)

  • Average Rating: 4.46/5 The average rating of products in this category, based on all submitted ratings
  • Top Trending Product: Querio (+0.37%) - Among all products in this category, Querio recorded the largest rating increase compared to last month

Last updated: September 26, 2026

How Does G2 Rank Big Data Analytics Software Products?

Why You Can Trust G2's Software Rankings:

  • 30 Analysts and Data Experts
  • 8,500+ Authentic Reviews
  • 113+ Products
  • Unbiased Rankings

G2's software rankings are built on verified user reviews, rigorous moderation, and a consistent research methodology maintained by a team of analysts and data experts. Each product is measured using the same transparent criteria, with no paid placement or vendor influence. While reviews reflect real user experiences, which can be subjective, they offer valuable insight into how software performs in the hands of professionals. Together, these inputs power the G2 Score, a standardized way to compare tools within every category.

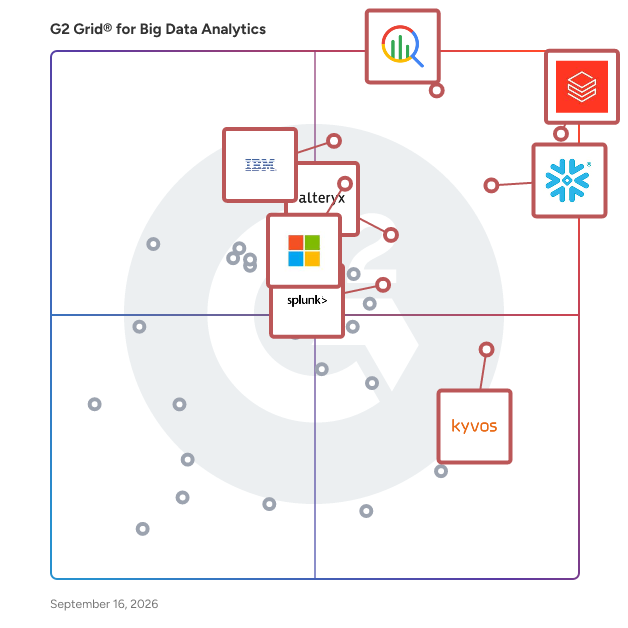
G2 Grid® for Big Data Analytics Software

G2 Grid® for Big Data Analytics Software plotting products by satisfaction and market presence

Highlighted products: Databricks, Google Cloud BigQuery, Snowflake, IBM watsonx.data, Azure Databricks, Alteryx, Kyvos Semantic Layer, and Splunk Enterprise.

Underlying data: [Grid® JSON](https://www.g2.com/categories/big-data-analytics/grids.json?focus%5B%5D=databricks&focus%5B%5D=google-cloud-bigquery&focus%5B%5D=snowflake&focus%5B%5D=ibm-watsonx-data&focus%5B%5D=azure-databricks&focus%5B%5D=alteryx&focus%5B%5D=kyvos-semantic-layer&focus%5B%5D=splunk-enterprise)

Databricks

Databricks is the Data and AI company. More than 20,000 organizations worldwide — including adidas, AT&T, Bayer, Block, Mastercard, Rivian, Unilever, and 70% of the Fortune 500 — rely on the Databricks Data + AI Platform to build and scale data and AI apps, analytics, and agents. Headquartered in San Francisco with 30+ offices around the globe, Databricks offers a unified platform that includes Genie, Lakebase, Agent Bricks, Lakeflow, Lakehouse, and Unity Catalog. Founded in 2013 by the original creators of Apache Spark™, Delta Lake, MLflow and Unity Catalog, Databricks is built on an open lakehouse architecture that brings data, analytics and AI together. The platform is used by data engineers, data scientists, analysts, developers, machine learning teams, AI teams and business users to collaborate across the full data and AI lifecycle. Key Databricks capabilities include: - Data engineering: Build, automate and manage reliable batch, streaming and real-time data pipelines. - Analytics and business intelligence: Run SQL analytics, create dashboards and enable business teams to explore data. - Data governance: Discover, secure and manage data and AI assets across teams, clouds and workloads. - Machine learning and AI: Develop models, build generative AI applications and create production-grade AI agents. - Data applications: Build and deploy data-driven applications using governed enterprise data. Available across AWS, Azure and Google Cloud, Databricks helps organizations work across clouds, reduce data silos and simplify collaboration across teams and tools. Customers use Databricks for use cases such as customer personalization, fraud detection, predictive maintenance, real-time analytics, cybersecurity, healthcare research, financial risk management, supply chain optimization and AI-powered decision-making. Databricks is used across industries including financial services, healthcare and life sciences, retail, manufacturing, energy and the public sector. Organizations use the platform to modernize data infrastructure, accelerate AI adoption and turn enterprise data into business value.

Average Rating: 4.6/5.0

Total Reviews: 1,340

How Do G2 Users Rate Databricks?

  • Has the product been a good partner in doing business?: 8.9/10 (Category avg: 8.9/10)
  • Multi-Source Analysis: 9.0/10 (Category avg: 8.5/10)
  • Real-Time Analytics: 8.9/10 (Category avg: 8.5/10)
  • Data Workflow: 8.8/10 (Category avg: 8.5/10)

Who Is the Company Behind Databricks?

  • Seller: Databricks Inc.
  • Company Website:
  • Year Founded: 2013
  • HQ Location: San Francisco, CA
  • Twitter: @databricks
    92,269 Twitter followers
  • LinkedIn® Page: www.linkedin.com
    14,336 employees on LinkedIn®

Who Uses This Product?

  • Who Uses This: Data Engineer, Data Analyst
  • Top Industries: Information Technology and Services, Financial Services
  • Company Size: 47% Large, 38% Medium

What Do G2 Reviewers Say About Databricks?

AI-generated summary from verified user reviews

Pros
  • Users enjoy the ease of use and extensive features of Databricks, streamlining data warehousing and machine learning tasks.
  • Users appreciate the ease of use of Databricks, enhancing their experience with its intuitive interface and efficient features.
  • Users value the seamless integrations with AWS services that enhance efficiency and support diverse business needs.
  • Users value the seamless collaboration provided by Databricks, enhancing teamwork on data projects and insights sharing.
  • Users value the wide array of integrated analytical features in Databricks, enhancing efficiency and collaboration in data projects.
Cons
  • Users face a steep learning curve with Databricks, as its complexity can be confusing for newcomers.
  • Users note that the cost of Databricks can be quite high, particularly for large data projects and limited free options.
  • Users find the steep learning curve of Databricks challenging, particularly for those unfamiliar with big data tools.
  • Users find the complexity of Databricks challenging, especially during initial setup and navigation of advanced features.
  • Users encounter complex setup challenges with Databricks initially, but support helps resolve issues quickly.

What Are Recent G2 Reviews of Databricks?

What Are G2 Users Discussing About Databricks?

Google Cloud BigQuery

BigQuery is an AI-ready, petabyte-scale, and cost-effective data warehouse that lets you run analytics over vast amounts of data in near real time. Store 10 GiB of data and run up to 1 TiB of queries for free per month.

Average Rating: 4.5/5.0

Total Reviews: 1,144

How Do G2 Users Rate Google Cloud BigQuery?

  • Has the product been a good partner in doing business?: 8.6/10 (Category avg: 8.9/10)
  • Multi-Source Analysis: 8.7/10 (Category avg: 8.5/10)
  • Real-Time Analytics: 8.8/10 (Category avg: 8.5/10)
  • Data Workflow: 8.6/10 (Category avg: 8.5/10)

Who Is the Company Behind Google Cloud BigQuery?

  • Seller: Google
  • Year Founded: 1998
  • HQ Location: Mountain View, CA
  • Twitter: @google
    31,899,995 Twitter followers
  • LinkedIn® Page: www.linkedin.com
    301,144 employees on LinkedIn®
  • Ownership: NASDAQ:GOOG

Who Uses This Product?

  • Who Uses This: Data Engineer, Data Analyst
  • Top Industries: Information Technology and Services, Computer Software
  • Company Size: 38% Large, 35% Medium

What Do G2 Reviewers Say About Google Cloud BigQuery?

AI-generated summary from verified user reviews

Pros
  • Users value the ease of use of Google Cloud BigQuery, enabling fast analysis without needing to manage infrastructure.
  • Users appreciate the incredible speed of BigQuery, making data processing effortless and efficient for large datasets.
  • Users value the seamless integrations of Google Cloud BigQuery, enhancing analytics and supporting various data types effortlessly.
  • Users appreciate the fast querying capabilities of Google Cloud BigQuery, enabling quick analysis of massive datasets effortlessly.
  • Users value the query efficiency of BigQuery, enabling fast analysis of massive datasets with minimal effort.
Cons
  • Users find the cost structure expensive, especially with complex queries leading to rapidly escalating charges.
  • Users often face query issues with BigQuery, as inefficient queries can rapidly increase costs and complicate budgeting.
  • Users find the cost management challenging, facing unpredictable pricing and needing strict governance to maintain budgets.
  • Users face cost issues with Google Cloud BigQuery, often leading to unexpectedly high bills and budget management challenges.
  • Users find the steep learning curve for advanced features challenging, requiring significant time and effort to master.

What Are Recent G2 Reviews of Google Cloud BigQuery?

What Are G2 Users Discussing About Google Cloud BigQuery?

Snowflake

Snowflake makes enterprise AI easy, efficient and trusted. Thousands of companies around the globe, including hundreds of the world’s largest, use Snowflake’s AI Data Cloud to share data, build applications, and power their business with AI. The era of enterprise AI is here. Learn more at snowflake.com (NYSE: SNOW).

Average Rating: 4.6/5.0

Total Reviews: 713

How Do G2 Users Rate Snowflake?

  • Has the product been a good partner in doing business?: 9.0/10 (Category avg: 8.9/10)
  • Multi-Source Analysis: 9.1/10 (Category avg: 8.5/10)
  • Real-Time Analytics: 9.2/10 (Category avg: 8.5/10)
  • Data Workflow: 9.2/10 (Category avg: 8.5/10)

Who Is the Company Behind Snowflake?

  • Seller: Snowflake, Inc.
  • Company Website:
  • Year Founded: 2012
  • HQ Location: 135 Constitution Drive, Menlo Park CA
  • Twitter: @SnowflakeDB
    278 Twitter followers
  • LinkedIn® Page: www.linkedin.com
    12,574 employees on LinkedIn®

Who Uses This Product?

  • Who Uses This: Data Engineer, Data Analyst
  • Top Industries: Information Technology and Services, Computer Software
  • Company Size: 45% Medium, 42% Large

What Do G2 Reviewers Say About Snowflake?

AI-generated summary from verified user reviews

Pros
  • Users appreciate the ease of use of Snowflake, which simplifies data sharing and enhances productivity across teams.
  • Users value the reliable features and user-friendly interface of Snowflake, enhancing data management and analytics efficiency.
  • Users appreciate the ease of use and efficient data integration in Snowflake for their warehousing projects.
  • Users value the seamless scalability of Snowflake, enabling efficient handling of large datasets and workload changes without performance loss.
  • Users value the fast and efficient data processing capabilities of Snowflake, enhancing their analysis experience significantly.
Cons
  • Users highlight the high costs of Snowflake, making it less accessible for smaller businesses with limited budgets.
  • Users find feature limitations in Snowflake, such as lack of code blocks and restricted permissions, frustrating.
  • Users find the learning curve steep, requiring training due to its complexity and overwhelming interface for beginners.
  • Users often struggle with high costs due to unoptimized queries and inadequate cost control measures in Snowflake.
  • Users find the cost structure challenging, requiring time to optimize for efficient use of Snowflake.

What Are Recent G2 Reviews of Snowflake?

What Are G2 Users Discussing About Snowflake?

IBM watsonx.data

IBM® watsonx.data® helps you access, integrate and understand all your data —structured and unstructured—across any environment. It optimizes workloads for price and performance while enforcing consistent governance across sources, formats and teams. Watch the demo to learn how watsonx.data empowers you to build gen AI apps and powerful AI agents. Free Trial available: https://ibm.biz/Watsonx-data_Trial

Average Rating: 4.4/5.0

Total Reviews: 169

G2 Deal: Save 30% on your first monthly or annual subscription. Offer ends 15 April 2026.

Get 30% off your new monthly or annual watsonx.data Enterprise subscription. Optimize data workloads at a fraction of the cost. Offer ends 15 April 2026.

Price: ~~61.81~~ → 88.30

View this exclusive G2 deal

How Do G2 Users Rate IBM watsonx.data?

  • Has the product been a good partner in doing business?: 8.8/10 (Category avg: 8.9/10)
  • Multi-Source Analysis: 8.8/10 (Category avg: 8.5/10)
  • Real-Time Analytics: 7.6/10 (Category avg: 8.5/10)
  • Data Workflow: 8.2/10 (Category avg: 8.5/10)

Who Is the Company Behind IBM watsonx.data?

  • Seller: IBM
  • Company Website:
  • Year Founded: 1911
  • HQ Location: Armonk, New York, United States
  • Twitter: @IBMSecurity
    74,660 Twitter followers
  • LinkedIn® Page: www.linkedin.com
    344,328 employees on LinkedIn®

Who Uses This Product?

  • Who Uses This: Software Engineer, Software Developer
  • Top Industries: Computer Software, Information Technology and Services
  • Company Size: 34% Small, 32% Large

What Do G2 Reviewers Say About IBM watsonx.data?

AI-generated summary from verified user reviews

Pros
  • Users appreciate the ease of use of IBM watsonx.data, finding it reliable and efficient for data management.
  • Users value the seamless data integration and user-friendly interface of IBM watsonx.data for efficient analytics.
  • Users appreciate the organized and efficient data management of IBM watsonx.data, simplifying analytics and enhancing team collaboration.
  • Users value the seamless data source integration of IBM watsonx.data, enhancing efficiency and flexibility in their workflows.
  • Users appreciate the flexible analytics capabilities of IBM watsonx.data, enabling faster insights from diverse data sources.
Cons
  • Users find the steep learning curve of IBM watsonx.data challenging, hindering easy adoption for newcomers.
  • Users find the complexity of setting up IBM watsonx.data a barrier, especially for newcomers and small teams.
  • Users find the pricing steep for IBM watsonx.data, especially for smaller businesses with limited resources.
  • Users find the difficult setup process time-consuming, with a steep learning curve and extensive documentation review required.
  • Users find performance tuning difficult with IBM watsonx.data, especially for beginners and teams with limited IT resources.

What Are Recent G2 Reviews of IBM watsonx.data?

Azure Databricks

Azure Databricks is a unified, open analytics platform developed collaboratively by Microsoft and Databricks. Built on the lakehouse architecture, it seamlessly integrates data engineering, data science, and machine learning within the Azure ecosystem. This platform simplifies the development and deployment of data-driven applications by providing a collaborative workspace that supports multiple programming languages, including SQL, Python, R, and Scala. By leveraging Azure Databricks, organizations can efficiently process large-scale data, perform advanced analytics, and build AI solutions, all while benefiting from the scalability and security of Azure. Key Features and Functionality: - Lakehouse Architecture: Combines the best elements of data lakes and data warehouses, enabling unified data storage and analytics. - Collaborative Notebooks: Interactive workspaces that support multiple languages, facilitating teamwork among data engineers, data scientists, and analysts. - Optimized Apache Spark Engine: Enhances performance for big data processing tasks, ensuring faster and more reliable analytics. - Delta Lake Integration: Provides ACID transactions and scalable metadata handling, improving data reliability and consistency. - Seamless Azure Integration: Offers native connectivity to Azure services like Power BI, Azure Data Lake Storage, and Azure Synapse Analytics, streamlining data workflows. - Advanced Machine Learning Support: Includes pre-configured environments for machine learning and AI development, with support for popular frameworks and libraries. Primary Value and Solutions Provided: Azure Databricks addresses the challenges of managing and analyzing vast amounts of data by offering a scalable and collaborative platform that unifies data engineering, data science, and machine learning. It simplifies complex data workflows, accelerates time-to-insight, and enables the development of AI-driven solutions. By integrating seamlessly with Azure services, it ensures secure and efficient data processing, helping organizations make data-driven decisions and innovate rapidly.

Average Rating: 4.5/5.0

Total Reviews: 213

How Do G2 Users Rate Azure Databricks?

  • Has the product been a good partner in doing business?: 8.8/10 (Category avg: 8.9/10)
  • Multi-Source Analysis: 9.0/10 (Category avg: 8.5/10)
  • Real-Time Analytics: 8.9/10 (Category avg: 8.5/10)
  • Data Workflow: 8.7/10 (Category avg: 8.5/10)

Who Is the Company Behind Azure Databricks?

  • Seller: Microsoft
  • Year Founded: 1975
  • HQ Location: Redmond, Washington
  • Twitter: @microsoft
    13,091,739 Twitter followers
  • LinkedIn® Page: www.linkedin.com
    232,750 employees on LinkedIn®
  • Ownership: MSFT

Who Uses This Product?

  • Who Uses This: Data Engineer, Software Engineer
  • Top Industries: Information Technology and Services, Computer Software
  • Company Size: 47% Large, 28% Medium

What Do G2 Reviewers Say About Azure Databricks?

AI-generated summary from verified user reviews

Pros
  • Users appreciate the ease of use of Azure Databricks, enjoying seamless integration and simplified development processes.
  • Users love the continuous feature improvements in Azure Databricks, enhancing integration and performance significantly.
  • Users value the seamless integrations of Azure Databricks with Azure services, enhancing efficiency and reducing complexity.
  • Users highlight the impressive speed of Azure Databricks, facilitating efficient large-scale data processing and analytics.
  • Users appreciate the seamless integration and comprehensive analytics features of Azure Databricks for efficient data processing.
Cons
  • Users find the complexity of setup and configuration challenging, especially for newcomers navigating Azure Databricks.
  • Users find the difficult setup of Azure Databricks challenging, especially for those new to the platform.
  • Users face a steep learning curve with Azure Databricks, especially newcomers navigating its complex features and configurations.
  • Users experience slow performance with Azure Databricks, particularly with cluster startup times and parallel processing efficiency.
  • Users face challenges with workflow issues, particularly in monitoring and managing multiple pipeline executions effectively.

What Are Recent G2 Reviews of Azure Databricks?

What Are G2 Users Discussing About Azure Databricks?

Alteryx

Alteryx is the agentic analytics and automation company that helps organizations turn complex data into trusted insights, decisions, and action. Built for the people closest to the business, the Alteryx One platform is designed to work across an organization’s existing data and technology ecosystem. It enables business users to produce AI-ready datasets and define, maintain, and update business logic into visual workflows that AI uses to automate operations and insights. This business logic stays visible, understandable, repeatable, and auditable (VURA), so that teams can automate data-intensive workflows without coding. Alteryx closes the last-mile gap between data platforms and the decisions and operations that run the business—giving AI the trusted business context it needs to deliver reliable results. Over 8,000 customers worldwide, including more than half of the Global 2000, rely on Alteryx to improve revenue performance, manage costs, increase operational efficiency, and reduce risk. Collectively, they run more than 380 million workflows on Alteryx each year.

Average Rating: 4.6/5.0

Total Reviews: 863

How Do G2 Users Rate Alteryx?

  • Has the product been a good partner in doing business?: 8.8/10 (Category avg: 8.9/10)
  • Multi-Source Analysis: 9.0/10 (Category avg: 8.5/10)
  • Real-Time Analytics: 8.4/10 (Category avg: 8.5/10)
  • Data Workflow: 9.2/10 (Category avg: 8.5/10)

Who Is the Company Behind Alteryx?

  • Seller: Alteryx
  • Company Website:
  • Year Founded: 1997
  • HQ Location: Irvine, CA
  • Twitter: @alteryx
    26,149 Twitter followers
  • LinkedIn® Page: www.linkedin.com
    2,312 employees on LinkedIn®

Who Uses This Product?

  • Who Uses This: Data Analyst, Analyst
  • Top Industries: Financial Services, Accounting
  • Company Size: 63% Large, 21% Medium

What Do G2 Reviewers Say About Alteryx?

AI-generated summary from verified user reviews

Pros
  • Users appreciate the ease of use in Alteryx, finding it simple to automate tasks with drag and drop functionality.
  • Users value the automation capabilities of Alteryx, streamlining data processes and enhancing analytical efficiency.
  • Users find Alteryx to be very intuitive, making it easy for non-technical users to learn and utilize.
  • Users find that Alteryx's interface makes learning technology easy for everyone, even those without a tech background.
  • Users value Alteryx for its efficiency in managing data, streamlining workflows, and enhancing overall productivity.
Cons
  • Users highlight the expensive pricing of Alteryx, making it difficult for small teams or startups to afford licenses.
  • Users face a steep learning curve with Alteryx, requiring time to master its complex features.
  • Users find that Alteryx suffers from missing features, such as lack of direct database access and limited reporting tools.
  • Users find the learning difficulty of Alteryx steep, especially for those unfamiliar with RegEx and SQL.
  • Users experience slow performance with Alteryx, particularly when handling large workflows and during data wrangling tasks.

What Are Recent G2 Reviews of Alteryx?

Kyvos Semantic Layer

Kyvos is a semantic layer for AI and BI. It gives organizations a single, consistent, business-friendly view of their entire data estate. By standardizing how data is defined and understood, Kyvos eliminates metric drift across BI tools and ensures that LLMs and AI agents work with governed business semantics rather than raw tables. Kyvos also delivers lightning-fast analytics at massive scale and high concurrency — including granular multidimensional analysis on the cloud — without the sluggish query times and escalating cloud costs that typically come with it. Why Organizations Use Kyvos Unified Semantic Foundation for AI and BI Kyvos semantic layer standardizes how metrics, KPIs, dimensions, hierarchies, relationships, calculations, and business rules are modelled across the enterprise — so that dashboards, analytics tools, notebooks, and AI systems all operate on the same understanding of the business. Kyvos enables: - Shared semantics — one common data language across every tool, team, and system - Governed access — data exploration within defined security, role, and permission boundaries - Platform interoperability — consistent semantic context across diverse platforms and environments - AI readiness — LLMs and agents work with governed business semantics rather than raw tables or ambiguous schema AI Grounded in Business Context Kyvos grounds AI systems in the governed semantic model, ensuring they operate on established business context rather than raw schemas — improving the accuracy, traceability, and reliability of AI-generated insights. Consistent Metrics Across BI Tools Kyvos centralizes metric and KPI definitions in the semantic layer and applies them consistently across every analytics interface — eliminating metric drift and improving trust in analytics. High-Performance Analytics at Scale Kyvos delivers high-performance analytics that scale with demand, enabling: - Sub-second query performance across massive datasets - High concurrency across thousands of users and workloads - Consistent response times regardless of data volume or concurrency - No performance degradation as adoption grows - Multidimensional Analytics on the Cloud Kyvos enables deep multidimensional analytics, supporting: - Granular analysis across billions of rows - Thousands of measures and dimensions in a single model - Fast drill-down across complex hierarchies - Full analytical depth without sacrificing query speed Cloud Cost Efficiency Kyvos serves analytics through its semantic layer rather than routing every query to the warehouse — reducing compute consumption across analytics and AI workloads. As adoption grows, organizations can scale users, workloads, and analytical complexity without a corresponding rise in warehouse compute costs.

Average Rating: 4.8/5.0

Total Reviews: 267

How Do G2 Users Rate Kyvos Semantic Layer?

  • Has the product been a good partner in doing business?: 9.6/10 (Category avg: 8.9/10)
  • Multi-Source Analysis: 9.2/10 (Category avg: 8.5/10)
  • Real-Time Analytics: 10.0/10 (Category avg: 8.5/10)
  • Data Workflow: 9.6/10 (Category avg: 8.5/10)

Who Is the Company Behind Kyvos Semantic Layer?

  • Seller: Kyvos Insights
  • Year Founded: 2014
  • HQ Location: Los Gatos, CA
  • Twitter: @KyvosInsights
    689 Twitter followers
  • LinkedIn® Page: www.linkedin.com
    145 employees on LinkedIn®

Who Uses This Product?

  • Who Uses This: Senior Software Engineer, Software Engineer
  • Top Industries: Information Technology and Services, Computer Software
  • Company Size: 57% Medium, 38% Large

What Do G2 Reviewers Say About Kyvos Semantic Layer?

AI-generated summary from verified user reviews

Pros
  • Users appreciate the ease of use of Kyvos, allowing quick access to insights and simplifying complex data management.
  • Users appreciate the fast data processing of Kyvos, enabling instant analysis and visualization of large datasets.
  • Users value the remarkable speed and performance of Kyvos, enabling swift data analytics for large datasets.
  • Users appreciate the lightning-fast analytics of Kyvos Semantic Layer, making data processing and visualization seamless and efficient.
  • Users value the fast querying capabilities of Kyvos Semantic Layer, enabling quick analysis of large data volumes.
Cons
  • Users find the learning curve steep for Kyvos, especially with advanced features and MDX queries requiring specialized knowledge.
  • Users find the difficult setup of Kyvos Semantic Layer challenging, despite effective support easing the process.
  • Users find the initial setup and MDX complexity challenging, though support significantly eases the deployment process.
  • Users find feature limitations in Kyvos, particularly lacking advanced analytics and graphical options for data visualization.
  • Users find that learning difficulty can hinder new users' experience, despite abundant training resources available.

What Are Recent G2 Reviews of Kyvos Semantic Layer?

Splunk Enterprise

Find out what is happening in your business and take meaningful action quickly with Splunk Enterprise. Automate the collection, indexing and alerting of machine data that's critical to your operations. Uncover the actionable insights from all your data — no matter the source or format. Leverage artificial intelligence and machine learning for predictive and proactive business decisions.

Average Rating: 4.3/5.0

Total Reviews: 414

How Do G2 Users Rate Splunk Enterprise?

  • Has the product been a good partner in doing business?: 8.7/10 (Category avg: 8.9/10)
  • Multi-Source Analysis: 8.4/10 (Category avg: 8.5/10)
  • Real-Time Analytics: 8.7/10 (Category avg: 8.5/10)
  • Data Workflow: 9.1/10 (Category avg: 8.5/10)

Who Is the Company Behind Splunk Enterprise?

  • Seller: Cisco
  • Year Founded: 1984
  • HQ Location: San Jose, CA
  • Twitter: @Cisco
    720,366 Twitter followers
  • LinkedIn® Page: www.linkedin.com
    95,294 employees on LinkedIn®
  • Ownership: NASDAQ:CSCO

Who Uses This Product?

  • Who Uses This: Software Engineer, Senior Software Engineer
  • Top Industries: Information Technology and Services, Computer Software
  • Company Size: 64% Large, 27% Medium

What Do G2 Reviewers Say About Splunk Enterprise?

AI-generated summary from verified user reviews

Pros
  • Users find Splunk Enterprise's ease of use remarkable, enabling quick access and seamless integration of large datasets.
  • Users value the robust data ingestion capabilities of Splunk Enterprise, efficiently managing diverse data sources.
  • Users commend the great integration capabilities of Splunk Enterprise, facilitating seamless implementation across various networks and systems.
  • Users value the flexibility and visualization capabilities of Splunk Enterprise, enabling effective data analysis and troubleshooting.
  • Users praise the visualization capabilities of Splunk Enterprise dashboards for effective data analysis and decision-making.
Cons
  • Users find Splunk Enterprise to be expensive, with high renewal costs and limitations that affect large organizations.
  • Users find the learning curve steep, struggling to quickly grasp Splunk Enterprise's many features and functionalities.
  • Users experience slow performance with Splunk Enterprise, noting occasional crashes and delays in processing saved searches.
  • Users find the complex configuration of Splunk Enterprise challenging, impacting performance optimization and overall user experience.
  • Users find the pricing issues with Splunk Enterprise burdensome, especially regarding storage costs and data limits.

What Are Recent G2 Reviews of Splunk Enterprise?

What Are G2 Users Discussing About Splunk Enterprise?

Azure Synapse Analytics

Azure Synapse Analytics is a cloud-based Enterprise Data Warehouse (EDW) that leverages Massively Parallel Processing (MPP) to quickly run complex queries across petabytes of data.

Average Rating: 4.4/5.0

Total Reviews: 37

How Do G2 Users Rate Azure Synapse Analytics?

  • Has the product been a good partner in doing business?: 8.3/10 (Category avg: 8.9/10)
  • Multi-Source Analysis: 8.9/10 (Category avg: 8.5/10)
  • Real-Time Analytics: 8.9/10 (Category avg: 8.5/10)
  • Data Workflow: 8.6/10 (Category avg: 8.5/10)

Who Is the Company Behind Azure Synapse Analytics?

  • Seller: Microsoft
  • Year Founded: 1975
  • HQ Location: Redmond, Washington
  • Twitter: @microsoft
    13,091,739 Twitter followers
  • LinkedIn® Page: www.linkedin.com
    232,750 employees on LinkedIn®
  • Ownership: MSFT

Who Uses This Product?

  • Top Industries: Information Technology and Services
  • Company Size: 45% Medium, 32% Large

What Do G2 Reviewers Say About Azure Synapse Analytics?

AI-generated summary from verified user reviews

Pros
  • Users appreciate the unified analytics experience of Azure Synapse Analytics, streamlining data processes and enhancing efficiency.
  • Users value the seamless integration and automation of Azure Synapse Analytics, enhancing efficiency in data analytics solutions.
  • Users value the seamless cloud integration of Azure Synapse Analytics, enhancing workflows and streamlining data analytics solutions.
  • Users value the cost-effective benefits of Azure Synapse Analytics, maximizing efficiency with flexible, on-demand resources.
  • Users value the seamless data integration capabilities of Azure Synapse Analytics, enhancing efficiency and reducing complexity in analytics solutions.
Cons
  • Users find cost estimation complex, especially with serverless queries and various resource management requirements.
  • Users find cost management complex, particularly when optimizing across serverless queries and Spark jobs without proper governance.
  • Users often face debugging issues with complex pipeline failures, resulting in increased troubleshooting time and frustration.
  • Users find difficult debugging issues due to lack of error transparency, complicating troubleshooting and performance tuning.
  • Users find Azure Synapse Analytics to be expensive, with costs complicating monitoring and optimization efforts.

What Are Recent G2 Reviews of Azure Synapse Analytics?

What Are G2 Users Discussing About Azure Synapse Analytics?

Dataiku

Dataiku is the Platform for AI Success: the AI orchestration layer where enterprises build, deploy, and govern analytics, models, and agents at scale. It sits on top of the data platforms, clouds, and AI services you already use, working across all of them without locking you into any one. Dataiku expands who can build production AI, putting the right tools in the hands of data scientists and domain experts alike, from fraud analysts to demand planners. It orchestrates machine learning, rules, LLMs, and agents as one governed system, built on more than a decade of running production AI. Governance is part of the build rather than something bolted on afterward, so teams ship faster while keeping performance, cost, and risk under control. The result: AI that moves from experimentation to trusted, measurable execution now, not in 18 months.

Average Rating: 4.4/5.0

Total Reviews: 223

How Do G2 Users Rate Dataiku?

  • Has the product been a good partner in doing business?: 8.6/10 (Category avg: 8.9/10)
  • Multi-Source Analysis: 8.8/10 (Category avg: 8.5/10)
  • Real-Time Analytics: 8.6/10 (Category avg: 8.5/10)
  • Data Workflow: 9.1/10 (Category avg: 8.5/10)

Who Is the Company Behind Dataiku?

  • Seller: Dataiku
  • Company Website:
  • Year Founded: 2013
  • HQ Location: New York, NY
  • Twitter: @dataiku
    22,917 Twitter followers
  • LinkedIn® Page: www.linkedin.com
    1,605 employees on LinkedIn®

Who Uses This Product?

  • Who Uses This: Data Scientist, Data Analyst
  • Top Industries: Financial Services, Pharmaceuticals
  • Company Size: 59% Large, 23% Medium

What Do G2 Reviewers Say About Dataiku?

AI-generated summary from verified user reviews

Pros
  • Users appreciate how Dataiku simplifies ML development, enabling quick training, evaluation, and understanding of data easily.
  • Users find Dataiku easy to use, simplifying ML development and helping detect opportunities and risks effortlessly.
  • Users value the ease of use in Dataiku, enabling collaboration and simplifying complex data processes for all skill levels.
  • Users appreciate the easy integrations of Dataiku, facilitating collaboration across diverse analytics tools and skill sets.
  • Users commend the productivity improvement brought by Dataiku’s visual recipes and robust tools for analytics projects.
Cons
  • Users find the learning curve steep, making it challenging for beginners to fully utilize Dataiku's advanced features.
  • Users find the steep learning curve challenging, especially for beginners navigating Dataiku's advanced features.
  • Users find the difficult learning curve challenging for beginners, impacting their ability to maximize the platform's potential.
  • Users face slow performance with Dataiku when managing large datasets, impacting efficiency and productivity.
  • Users find the pricing high for small companies and students, impacting accessibility for basic projects.

What Are Recent G2 Reviews of Dataiku?

What Are G2 Users Discussing About Dataiku?

dbt

dbt is a transformation workflow that lets data teams quickly and collaboratively deploy analytics code following software engineering best practices like modularity, portability, CI/CD, and documentation. Now anyone who knows SQL can build production-grade data pipelines.

Average Rating: 4.7/5.0

Total Reviews: 208

How Do G2 Users Rate dbt?

  • Has the product been a good partner in doing business?: 8.6/10 (Category avg: 8.9/10)
  • Multi-Source Analysis: 8.5/10 (Category avg: 8.5/10)
  • Real-Time Analytics: 8.5/10 (Category avg: 8.5/10)
  • Data Workflow: 9.3/10 (Category avg: 8.5/10)

Who Is the Company Behind dbt?

  • Seller: Fivetran
  • Year Founded: 2012
  • HQ Location: Oakland, CA
  • Twitter: @fivetran
    5,767 Twitter followers
  • LinkedIn® Page: www.linkedin.com
    1,902 employees on LinkedIn®

Who Uses This Product?

  • Who Uses This: Data Engineer, Analytics Engineer
  • Top Industries: Information Technology and Services, Computer Software
  • Company Size: 56% Medium, 27% Small

What Do G2 Reviewers Say About dbt?

AI-generated summary from verified user reviews

Pros
  • Users find dbt's ease of use exceptional, with straightforward setup and intuitive features enhancing their data transformation processes.
  • Users appreciate the maintainability and clarity of dbt's SQL code base, enhancing collaboration and data transformations.
  • Users value the automation of data workflows with dbt, enhancing maintainability and collaboration in SQL transformations.
  • Users love the ease of transforming data with dbt, allowing for organized and efficient analytics workflows.
  • Users value the data quality of dbt, praising its effectiveness in ensuring data integrity and operational efficiency.
Cons
  • Users find that dbt has limited functionality due to rigidness and complex debugging, hindering project progress.
  • Users face dependency issues in dbt, as model errors and upstream changes complicate troubleshooting and disrupt workflows.
  • Users find the steep learning curve of dbt daunting, needing mastery of concepts like Jinja and Git.
  • Users encounter poor error handling with unclear messages, making troubleshooting frustrating and complicating the user experience.
  • Users often face confusing error reporting and unclear messages, making troubleshooting and identifying issues challenging.

What Are Recent G2 Reviews of dbt?

What Are G2 Users Discussing About dbt?

Confluent

Today’s customers expect every digital experience to be immediate, connected, and personalized. That takes more than data at rest - it takes trusted data in motion. Confluent is the complete Data Streaming Platform for keeping data in motion from the moment business change occurs through processing, governance, and serving. Built by the original creators of Apache Kafka®, Confluent connects applications, services, and systems; processes streams in real time with Apache Flink®; and serves trusted, always-current data wherever it is needed across cloud, hybrid, and self-managed environments. With deployment options including fully managed Confluent Cloud, self-managed Confluent Platform and Brint-your-own-cloud Confluent WarpStream, teams can power event-driven applications, real-time analytics, AI, and operational workflows while choosing the operating model that fits their environment and turning live data into better customer experiences and business outcomes.

Average Rating: 4.4/5.0

Total Reviews: 111

How Do G2 Users Rate Confluent?

  • Has the product been a good partner in doing business?: 8.5/10 (Category avg: 8.9/10)
  • Multi-Source Analysis: 8.3/10 (Category avg: 8.5/10)
  • Real-Time Analytics: 8.9/10 (Category avg: 8.5/10)
  • Data Workflow: 7.9/10 (Category avg: 8.5/10)

Who Is the Company Behind Confluent?

  • Seller: IBM
  • Company Website:
  • Year Founded: 1911
  • HQ Location: Armonk, New York, United States
  • Twitter: @IBMSecurity
    74,660 Twitter followers
  • LinkedIn® Page: www.linkedin.com
    344,328 employees on LinkedIn®

Who Uses This Product?

  • Who Uses This: Software Engineer, Senior Software Engineer
  • Top Industries: Computer Software, Information Technology and Services
  • Company Size: 36% Large, 33% Small

What Do G2 Reviewers Say About Confluent?

AI-generated summary from verified user reviews

Pros
  • Users appreciate the simplicity and scalability of Confluent's managed cloud services, enhancing real-time data integration.
  • Users appreciate the effortless integration of Confluent's cloud services, enhancing their experience with Kafka and Flink.
  • Users appreciate the wide range of connectors in Confluent, enhancing real-time data integration effortlessly.
  • Users appreciate the effortless data integration offered by Confluent, enhancing real-time processing with robust tools and scalability.
  • Users appreciate the ease of use of Confluent, enjoying simplified data integration and a user-friendly interface.
Cons
  • Users note the high cost estimation with data growth and a steep learning curve for effective use.
  • Users find Confluent expensive as costs rise with data volume, and learning the system can be time-consuming.
  • Users face initial difficulties with a steep learning curve and costly pricing as data volumes increase.
  • Users find a lack of features in Confluent, especially in lower tiers, leading to increased costs and complexity.
  • Users face a steep learning curve with Confluent, requiring significant time to master its workflow and features.

What Are Recent G2 Reviews of Confluent?

What Are G2 Users Discussing About Confluent?

Cloudera

Cloudera is the only hybrid data and AI platform company that large organizations trust to bring AI to their data anywhere it lives. Unlike other providers, Cloudera delivers a consistent cloud experience that converges public clouds, on-prem data centers, and the edge, leveraging a proven open-source foundation. As the pioneer in big data, Cloudera empowers businesses to apply AI and assert control over 100% of their data, in all forms, improving security, governance, and real-time and predictive insights. The world’s largest brands across all industries rely on Cloudera to transform decision-making and ultimately boost bottom lines, safeguard against threats, and save lives. Cloudera Anywhere Cloud™: Build and scale applications across any environment. The modular hybrid data and AI platform engineered for the agentic era empowers teams to deploy production-grade data and AI workloads across multi-cloud, on-premises, and sovereign environments while maintaining digital sovereignty. The Cloudera data and AI platform includes: Cloudera AI: Deploy and scale any AI model, anywhere. Cloudera brings compute to governed data where it lives for Private AI anywhere by design. Complete control, security, and governance of mission-critical data, models, agents, and inference ensure faster sovereign AI deployments. Cloudera Data-in-Motion: Make fast decisions from real-time data anywhere. Move data with any structure from any source to any destination seamlessly across hybrid environments, enabling in-the-moment business-critical decisions by processing and analyzing real-time data anywhere, from the edge to AI, as business happens. Cloudera Open Data Lakehouse: Process any data, anywhere, for actionable insights. Make smart decisions with an open data lakehouse powered by Apache Iceberg that delivers trusted, reliable, and unified data to fuel agents, AI applications, and analytics, improving collaboration, breaking silos, and simplifying sharing. Cloudera Unified Data Fabric: Unify security and governance across the entire data estate. Move beyond fragmented data management: Break down silos and connect disparate data sources intelligently and securely to provide a unified view of all organizational data and centralized end-to-end control across complex hybrid data environments.

Average Rating: 4.2/5.0

Total Reviews: 190

How Do G2 Users Rate Cloudera?

  • Has the product been a good partner in doing business?: 8.5/10 (Category avg: 8.9/10)
  • Multi-Source Analysis: 8.6/10 (Category avg: 8.5/10)
  • Real-Time Analytics: 7.0/10 (Category avg: 8.5/10)
  • Data Workflow: 8.0/10 (Category avg: 8.5/10)

Who Is the Company Behind Cloudera?

  • Seller: Cloudera
  • Company Website:
  • Year Founded: 2008
  • HQ Location: Santa Clara, CA
  • Twitter: @cloudera
    106,442 Twitter followers
  • LinkedIn® Page: www.linkedin.com
    3,505 employees on LinkedIn®

Who Uses This Product?

  • Who Uses This: Data Engineer, Software Engineer
  • Top Industries: Information Technology and Services, Banking
  • Company Size: 39% Large, 35% Small

What Do G2 Reviewers Say About Cloudera?

AI-generated summary from verified user reviews

Pros
  • Users praise the user-friendly interface of Cloudera, highlighting its simplicity in managing big data efficiently.
  • Users value the easy scalability of Cloudera, enabling efficient management of large amounts of data effortlessly.
  • Users value the robust security features of Cloudera, ensuring safe and reliable data management across platforms.
  • Users value the comprehensive suite of tools in Cloudera for effective data management and analytics.
  • Users find Cloudera's scalability and centralized administration invaluable for efficient monitoring and management of data processes.
Cons
  • Users express concerns over the high costs of Cloudera, noting it's expensive for its complexity and maintenance.
  • Users find Cloudera's database to be complex, making it challenging for inexperienced professionals to utilize effectively.
  • Users find Cloudera's setup difficult to learn, particularly challenging for beginners without adequate tutorials or guidance.
  • Users find the poor documentation of Cloudera frustrating, complicating navigation and setup for complex data configurations.
  • Users often face access issues with Cloudera, particularly with unauthorized errors in Airflow tasks and limited documentation.

What Are Recent G2 Reviews of Cloudera?

What Are G2 Users Discussing About Cloudera?

Azure Data Lake Analytics

Azure Data Lake Analytics is a distributed, cloud-based data processing architecture offered by Microsoft in the Azure cloud. It is based on YARN, the same as the open-source Hadoop platform.

Average Rating: 4.2/5.0

Total Reviews: 28

How Do G2 Users Rate Azure Data Lake Analytics?

  • Has the product been a good partner in doing business?: 8.6/10 (Category avg: 8.9/10)
  • Multi-Source Analysis: 7.9/10 (Category avg: 8.5/10)
  • Real-Time Analytics: 8.1/10 (Category avg: 8.5/10)
  • Data Workflow: 8.5/10 (Category avg: 8.5/10)

Who Is the Company Behind Azure Data Lake Analytics?

  • Seller: Microsoft
  • Year Founded: 1975
  • HQ Location: Redmond, Washington
  • Twitter: @microsoft
    13,091,739 Twitter followers
  • LinkedIn® Page: www.linkedin.com
    232,750 employees on LinkedIn®
  • Ownership: MSFT

Who Uses This Product?

  • Top Industries: Information Technology and Services, Computer Software
  • Company Size: 54% Large, 27% Medium

What Are Recent G2 Reviews of Azure Data Lake Analytics?

What Are G2 Users Discussing About Azure Data Lake Analytics?

EXASOL

Exasol is the world’s ​most powerful Analytics Engine, ​purpose-built to handle the most demanding data workloads at an unmatched price / performance ratio​. In-memory architecture Want to process 3 billion rows in 3 seconds, not 3 hours? Exasol manages memory cache automatically, only bringing what's needed into the database for dramatically faster access times. Automatic query tuning Enjoy optimized performance while minimizing data administration overhead. Exasol uses intelligent, proprietary algorithms to self-tune queries on the fly -- adding and removing indices automatically – so you can bring true self-service BI to your organization. User defined functions (UDF) When you need more than a SQL statement, UDF scripts allow you to program your own analysis. Take your unique machine learning and data ingest scripts written in Python, R, and Lua, and run them in our database engine. Through UDF scripts, you'll get a highly flexible interface for nearly every requirement, allowing you to bring in data quickly from wherever it lives. In addition to being the fastest, Exasol also leads in the TPC price-performance metrics, meaning everyone in your organization can take advantage of unrivaled in-memory speed at a low price. And, unlike our competitors, Exasol allows you to choose the deployment destination. Deploy in the cloud, on-premises, or hybrid to meet your organization's unique needs and preferred vendors.

Average Rating: 4.7/5.0

Total Reviews: 23

How Do G2 Users Rate EXASOL?

  • Has the product been a good partner in doing business?: 9.7/10 (Category avg: 8.9/10)
  • Multi-Source Analysis: 9.2/10 (Category avg: 8.5/10)
  • Real-Time Analytics: 9.6/10 (Category avg: 8.5/10)
  • Data Workflow: 6.7/10 (Category avg: 8.5/10)

Who Is the Company Behind EXASOL?

  • Seller: EXASOL
  • Year Founded: 2000
  • HQ Location: Nurnberg, Bayern
  • LinkedIn® Page: www.linkedin.com
    220 employees on LinkedIn®

Who Uses This Product?

  • Company Size: 39% Large, 32% Medium

What Do G2 Reviewers Say About EXASOL?

AI-generated summary from verified user reviews

Pros
  • Users highlight the unmatched query performance of EXASOL, enabling incredibly fast results for large data sets.
  • Users highlight the unparalleled query performance of EXASOL, achieving rapid results even with massive data sets.
  • Users value the unparalleled query performance of EXASOL, enhancing efficiency for analytical workloads with speed and reliability.
  • Users find EXASOL to be cost-effective, appreciating its efficiency and minimal administrative requirements.
  • Users appreciate the fast and competent customer support from EXASOL, enhancing their overall experience with the product.
Cons
  • Users experience complexity in query optimization, which can hinder performance despite available tricks for improvement.
  • Users report challenges with the lack of a robust debugger in EXASOL, making Python code development difficult.
  • Users find the difficult setup of EXASOL requires extensive configuration and DBA involvement for upgrades.
  • Users find the limited visualization capabilities of EXASOL hinder their ability to analyze data effectively.
  • Users experience performance issues with Exasol's optimizer, impacting complex query execution but workaround solutions are available.

What Are Recent G2 Reviews of EXASOL?

What Are G2 Users Discussing About EXASOL?

Bijou Barry
BB
Researched and written by Bijou Barry
Updated April 9, 2026

Learn More About Big Data Analytics Software

What is Big Data Analytics Software?

The huge amount of data that is accessible to businesses today has made it a near necessity for them to implement some type of analytics software to better understand and act on that data. Implementing big data analytics software has been a major initiative for companies undergoing digital transformation, as these tools offer deeper visibility into an organization's data. Companies adopt these solutions to make sense of large data sets collected from big data clusters.

With the ability to visualize and understand business data, employees can make informed decisions. For example, retailers can use these tools to better understand inventory distribution across their channels and make data-driven decisions based on this data. Some big data analytics solutions may offer artificial intelligence or machine learning features, such as natural language processing, as an interface capability to further aid nontechnical users.

What Types of Big Data Analytics Software Exist?

Many types of big data analytics solutions share overlapping functionality, while simultaneously catering to different user personas such as data analysts and financial analysts or providing unique services.

Because of the unstructured nature of big data clusters, these analytics solutions require a query language to pull the data out of the file system. Most commercial table databases allow SQL queries; however, big data analytics tools do not necessarily offer such SQL language capabilities and may require a more intricate knowledge of querying from a data scientist. As an alternative, some solutions may offer self-service features so that the average employee can assemble their own charts and graphs from big data sets.

Self-service big data analytics tools

Self-service big data analytics tools do not require coding knowledge, so end users with limited to no coding knowledge can take advantage of them for data needs. This enables business users like sales representatives, human resource managers, marketers, and other nondata team members to make decisions based on relevant business data. Self-service solutions often provide drag-and-drop functionality for building dashboards, prebuilt templates for querying data, and, occasionally, natural language querying for data discovery. Similar to analytics platforms, organizations use these tools to build interactive dashboards for discovering actionable insights. 

Embedded analytics solutions

Embedded analytics solutions offer the ability to integrate proprietary analytics functionality within other business applications. Commonly, businesses embed analytics solutions in software such as CRMs, ERP, and portals (e.g., intranets or extranets). Businesses may choose an embedded product to promote user adoption; by placing the analytics inside regularly used software, companies enable employees to take advantage of available data. These solutions provide self-service functionality so average business end users can take advantage of data for improved decision making. 

What are the Common Features of Big Data Analytics Software?

Big data analytics software helps companies get a better understanding of their data. The following are some core features of this software: 

Data connectivity: If businesses cannot connect the requisite data, then there is no use for big data analytics software. The methods for connecting data include Hadoop and Spark integration which allows for processing and distribution workflows on top of Apache Hadoop and Apache Spark, respectively. In addition, this software should allow for analyzing data that is stored in data lakes, data warehouses, and data lake houses.

Data transformation: For data to be analyzed, it needs to be properly cleaned and transformed into a usable format. Big data analytics software provides features such as real-time analytics and data querying. With these features, businesses can gain a high-level view of their data in real time, allowing one to query it and better understand it. Through query languages like SQL, users can query their data and dig deeper into particular data sets and data points.

Data operations: Once the data is connected (or integrated) and transformed, it can be analyzed. Firstly, it is important to establish data workflows, which can help in stringing together specific functions and data sets to automate analytics iterations. In addition, big data analytics software provides the ability to visualize data through dashboards, as well as notebooks which can be used to create visualization with predefined or scheduled queries. 

It is not always the case that one will access analytics via a standalone analytics platform. Therefore, some products provide embedded analytics capabilities. This allows users to access analytics inside business applications, which allows for more streamlined work since the users need not switch between applications. 

Other Features of Big Data Analytics Software: Governed Discovery,

What are the Benefits of Big Data Analytics Software?

Data is both common and invaluable and within that data lies insights that could impact an organization's processes and performance. There are seemingly infinite insights a business can pull from their data and numerous reasons to utilize big data analytics software. 

Big data analytics software helps people make decisions easier by allowing teams to gain deeper insight into their data. With increased data literacy, teams across a business, from sales to marketing to finance can become more efficient and better understand how they can improve through data-driven initiatives. 

With big data analytics software, businesses can ingest, integrate, and prepare big data sources. Subsequently, they can connect all company data sources into a single platform to make cross-department connections, visualize and understand company data, encourage data-driven decision making for business optimization, and discover new insights that can enhance the bottom line.

Enable data-driven decision making: Businesses can use big data analytics software to fuel digital transformation by leveraging data to drive business decisions. Companies can leverage analytics and business intelligence (BI) tools to understand all aspects of the business, including hiring forecasts, which marketing campaign should be used to target certain demographics, which sales prospects to target first, supply chain optimization, and many others.

Measure and understand company performance: Organizations often leverage data visualization tools to track company key performance indicators (KPIs) in real time. From there, big data analytics software can be used to determine why the business is either exceeding or falling short of those important company metrics. When stakeholders develop a keen understanding of why the business is performing the way it is, they can make adjustments and pivots; if a team is falling short of a goal, they can examine and adjust processes as needed. It is one thing to simply know the performance of sales or web traffic numbers, but it is another to dig into the reasons behind it and adapt based on what is successful and what is not.

Discover new actionable insights: Analytics tools combine data from a variety of sources, including accounting software, enterprise resource planning (ERP) software, CRM software, marketing automation software, and others. Data analysts can leverage this integrated data to find correlations between different departments, and their processes and actions, to discover previously hidden insights. For example, it is possible that certain sales tactics have varying impacts on the numbers for one specific product versus another. 

Analysts can discover this impact by comparing the list of closed accounts from their company CRM with products shipped in their ERP system. Teams are generally siloed and use disparate software, so these insights that were traditionally more difficult to discover, are now made easier. 

Who Uses Big Data Analytics Software?

Data analysts: Depending on the complexity of the software, it is likely that analysts will be required. They can help set up the requisite queries, dashboards, and notebooks for other employees and teams. They can create complex queries inside the platforms to gather a deeper understanding of business-critical data.

Operations and supply chain teams: A company’s supply chain frequently has many touchpoints, and as a result, many data points. Therefore, employees working in operations and supply chain teams are able to use big data analytics software to gain a better understanding of their departments and the data that is generated, such as from an ERP system. These applications track everything from accounting to supply chain and distribution; by inputting supply chain data into this software, supply chain managers can optimize a number of processes to save time and resources.

Finance teams: Finance teams leverage big data analytics software to gain insight and understanding into the factors that impact an organization's bottom line. Through integrations with financial systems such as accounting software, employees such as chief financial officers (CFOs) can see how well the business is performing. As mentioned above, these employees will likely be accessing the software via self-service dashboards that were set up by data analysts. By integrating financial data with sales, marketing, and other operations data, accounting and finance teams pull actionable insights that might not have been uncovered through the use of traditional tools.

Sales and marketing teams: Sales teams also seek to improve financial metrics and can benefit tremendously from being more data-driven. Through the use of both self-service analytics tools and embedded analytics solutions, they can obtain insights into prospective accounts, sales performance, and pipeline forecasting, among many other use cases. Using analytics tools in a sales team can help businesses optimize their sales processes and influence revenue.

For marketing teams, tracking the performance of campaigns is key. Since they run different types of campaigns, including email marketing, digital advertising, or even traditional advertising campaigns, analytics tools allow marketing teams to track the performance of those campaigns in one central location.

Consultants: Businesses do not always have the luxury to build, develop, and optimize their own analytics solutions. Some businesses opt to employ external consultants, such as business intelligence (BI) consulting providers. These providers seek to understand a business and its goals, interpret data, and offer advice to ensure goals are met. BI consultants frequently have industry-specific knowledge alongside their technical backgrounds, with experience in healthcare, business, and other fields. 

What are the Alternatives to Big Data Analytics Software?

Alternatives to big data analytics software can replace this type of software, either partially or completely:

Analytics platforms: Analytics platforms might include big data integrations, but are broader-focused tools that facilitate the following five elements: data preparation, data modeling, data blending, data visualization, and insights delivery.

Log analysis software: Businesses that are focused on log data might benefit from deploying log analysis software, which is used to analyze log data from applications and systems. It should be kept in mind that this software is much more limited in terms of data types and data sources to which it can be connected to. However, since log analysis software focuses on logs, it frequently provides more granular details around log-related data.

Stream analytics software: When one is looking for tools specifically geared toward analyzing data in real time, stream analytics software is a go-to solution. These tools help users analyze data in transfer through APIs, between applications, and more. This software can be helpful with internet of things (IoT) data, which one frequently wants to analyze in real time.

Predictive analytics software: Broad-purpose big data analytics software allows businesses to conduct various forms of analysis, such as prescriptive, descriptive, and predictive. Businesses that are focused on looking at their past and present data to predict future outcomes can use predictive analytics software for a more finetuned solution. 

Text analysis software: Big data analytics software is focused on structured or numerical data, allowing users to drill down and dig into numbers to inform business decisions. If the user is looking to focus on unstructured or text data, text analysis solutions are the best bet. These tools help users quickly understand and pull sentiment analysis, key phrases, themes, and other insights from unstructured text data.

Software Related to Big Data Analytics Software

Related solutions that can be used together with big data analytics software include:

Data warehouse software: Most companies have a large number of disparate data sources, so to best integrate all their data, they implement a data warehouse. Data warehouses can house data from multiple databases and business applications, which allows BI and analytics tools to pull all company data from a single repository. This organization is critical to the quality of the data that is ingested by analytics software.

Data preparation software: A key solution necessary for easy data analysis is a data preparation tool and other related data management tools. These solutions allow users to discover, combine, clean, and enrich data for simple analysis. Data preparation tools are often used by IT teams or data analysts tasked with using BI tools. Some BI platforms offer data preparation features, but businesses with a wide range of data sources often opt for a dedicated preparation tool.

Challenges with Big Data Analytics Software

Software solutions can come with their own set of challenges. 

Need for skilled employees: Big data analytics software is not necessarily simple. Often, these tools require a dedicated administrator to help implement the solution and assist others with adoption. However, there is a shortage of skilled data scientists and analysts that are equipped to set up such solutions. Additionally, those same data scientists will be tasked with deriving actionable insights from within the data. 

Without people skilled in these areas, businesses cannot effectively leverage the tools or their data. Even the self-service tools, which are to be used by the average business user, require someone to help deploy them. Companies can turn to vendor support teams or third-party consultants to assist if they are unable to bring someone in house.

Data organization: To get the most of analytics solutions, that data needs to be organized. This means that databases should be set up correctly and integrated properly. This may require building a data warehouse, which can store data from a variety of applications and databases in a central location. 

Businesses may need to purchase a dedicated data preparation software as well to ensure that data is joined and is clean for the analytics solution to consume in the right way. In the context of big data, a company might want to specifically consider big data processing and distribution software. This often requires a skilled data analyst, IT employee, or an outside consultant to help ensure data quality is at its finest for easy analysis.

User adoption: It is not always easy to transform a business into a data-driven company. Particularly at more established companies that have done things the same way for years, it is not simple to force analytics tools upon employees, especially if there are ways for them to avoid it. If there are other options, such as spreadsheets or existing tools that employees can use instead of analytics software, they will most likely go that route. However, if managers and leaders ensure that analytics tools are a necessity in an employee’s day to day, then adoption rates will increase.

Which Companies Should Buy Big Data Analytics Software?

As has often been said, data is the fuel that drives modern businesses. Although it is cliche, it no doubt has truth to it. Therefore, businesses across the globe and across industries should consider some sort of analytics solution, such as big data analytics in order to make sense of that data and begin to make data-driven decisions. 

Financial services: Within financial institutions, such as insurance brokerages, banks, and credit unions, it is common for a host of different systems to be used. These companies have data ranging from customer records, to transactions, to market data, and more. With the proliferation of systems comes more data. With a robust analytics solution in place, they can get a better understanding of the data that is being produced from the various systems across the business. As an industry that is heavily regulated, users can benefit from governed access capabilities which can be particularly beneficial, since it can assist in auditing company processes.

Healthcare: Within the space of healthcare, bad data practices might have dire or even deadly consequences. Big data analytics software can help these organizations with having an overarching view of their data, such as patient records, insurance claims, finances, and more. Through the implementation of analytics, healthcare companies can lower risk and costs, and make their billing and collections smarter.

Retail: Retail organizations, whether they be B2C, B2B, D2C, or others, rely on data to make informed decisions. For example, a seller of printers, in order to run a successful business, must keep track of many things such as their inventory, sales, their sales team, and returns. If all of this data is kept siloed within different systems, there is no single source of truth and departments cannot have a conversation around the actual state of the business’ data. With big data analytics software set up and connected to all of the relevant data sources, any retail business can see benefits and make meaningful data-driven decisions.

How to Buy Big Data Analytics Software

Requirements Gathering (RFI/RFP) for Big Data Analytics Software

If a company is just starting out on their analytics journey, g2.com can help in selecting the best software for the particular company and use case. Since the particular solution might vary based on company size and industry, G2 is a great place to sort and filter reviews based on these criteria, along with many more.

As mentioned above, the variety, volume, and velocity of data are vast. Therefore, users should think about how the particular solution fits their particular needs, as well as their future needs as they accumulate more data. 

To find the right solution, buyers should determine pain points and jot them down. These should be used to help create a checklist of criteria. Additionally, the buyer must determine the number of employees who will need to use this software, as this drives the number of licenses they are likely to buy.

Taking a holistic overview of the business and identifying pain points can help the team springboard into creating a checklist of criteria. The checklist serves as a detailed guide that includes both necessary and nice-to-have features including budget, features, number of users, integrations, security requirements, cloud or on-premises solutions, and more.

Depending on the scope of the deployment, it might be helpful to produce a request for information (RFI), a one-page list with a few bullet points describing what is needed from a big data analytics software.

Compare Big Data Analytics Software Products

Create a long list

From meeting the business functionality needs to implementation, vendor evaluations are an essential part of the software buying process. For ease of comparison after all demos are complete, it helps to prepare a consistent list of questions regarding specific needs and concerns to ask each vendor.

Create a short list

From the long list of vendors, it is helpful to narrow down the list of vendors and come up with a shorter list of contenders, preferably no more than three to five. With this list in hand, businesses can produce a matrix to compare the features and pricing of the various solutions.

Conduct demos

To ensure the comparison is thoroughgoing, the user should demo each solution on the shortlist with the same use case and data sets. This will allow the business to evaluate like for like and see how each vendor stacks up against the competition. 

Selection of Big Data Analytics Software

Choose a selection team

As big data analytics software is all about the data, the user must make sure that the selection process is data driven as well. The selection team should compare notes and facts and figures which they noted during the process, such as time to insight, number of visualizations, and availability of advanced analytics capabilities.

Negotiation

Just because something is written on a company’s pricing page, does not mean it is not negotiable (although some companies will not budge). It is imperative to open up a conversation regarding pricing and licensing. For example, the vendor may be willing to give a discount for multi-year contracts or for recommending the product to others.

Final decision

After this stage, and before going all in, it is recommended to roll out a test run or pilot program to test adoption with a small sample size of users. If the tool is well used and well received, the buyer can be confident that the selection was correct. If not, it might be time to go back to the drawing board.

What Does Big Data Analytics Software Cost?

Businesses decide to deploy big data analytics software with the goal of deriving some degree of a return on investment (ROI).

Return on Investment (ROI)

As they are looking to recoup their losses that they spent on the software, it is critical to understand the costs associated with it. As mentioned above, this software is typically billed per user, which is sometimes tiered depending on the company size. More users will typically translate into more licenses, which means more money.

Users must consider how much is spent and compare that to what is gained, both in terms of efficiency as well as revenue. Therefore, businesses can compare processes between pre- and post-deployment of the software to better understand how processes have been improved and how much time has been saved. They can even produce a case study (either for internal or external purposes) to demonstrate the gains they have seen from their use of the big data analytics tool.

Implementation of Big Data Analytics Software

How is Big Data Analytics Software Implemented?

Implementation differs drastically depending on the complexity and scale of the data. In organizations with vast amounts of data in disparate sources (e.g., applications, databases, etc.), it is often wise to utilize an external party, whether that be an implementation specialist from the vendor or a third-party consultancy. With vast experience, they can help businesses understand how to connect and consolidate their data sources and how to use the software efficiently and effectively.

Who is Responsible for Big Data Analytics Software Implementation?

It may require a lot of people, or many teams, to properly deploy an analytics platform. This is because data can cut across teams and functions. As a result, it is rare that one person or even one team has a full understanding of all of a company’s data assets. With a cross-functional team in place, a business can piece together their data and begin the journey of analytics, starting with proper data preparation and management.