Best Analytics Platforms for Medium-Sized Businesses - Page 3

How Many Analytics Platforms Products Does G2 Track?

Total Products under this Category: 607

Category Stats (Oct 2026)

  • Average Rating: 4.52/5 (↑0.01 vs Sep 2026) The average rating of products in this category, based on all submitted ratings
  • Top Trending Product: inzicht (+3.71%) - Among all products in this category, inzicht recorded the largest rating increase compared to last month

Last updated: October 13, 2026

How Does G2 Rank Analytics Platforms Products?

Why You Can Trust G2's Software Rankings:

  • 30 Analysts and Data Experts
  • 29,800+ Authentic Reviews
  • 607+ Products
  • Unbiased Rankings

G2's software rankings are built on verified user reviews, rigorous moderation, and a consistent research methodology maintained by a team of analysts and data experts. Each product is measured using the same transparent criteria, with no paid placement or vendor influence. While reviews reflect real user experiences, which can be subjective, they offer valuable insight into how software performs in the hands of professionals. Together, these inputs power the G2 Score, a standardized way to compare tools within every category.

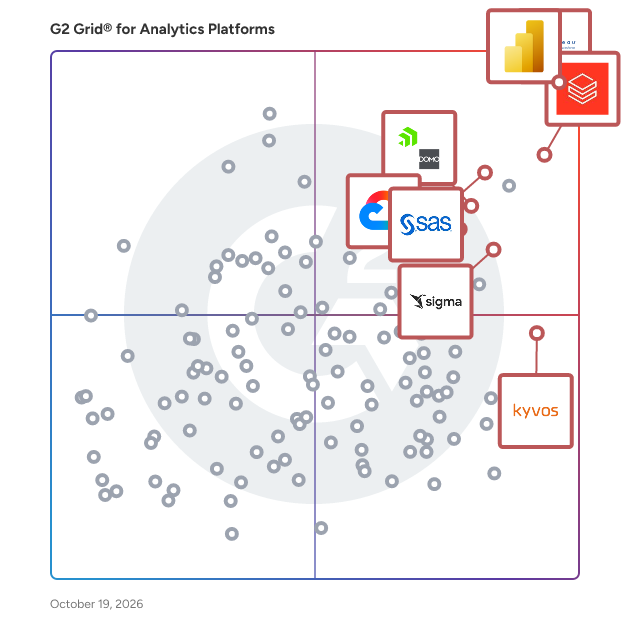
G2 Grid® for Analytics Platforms

G2 Grid® for Analytics Platforms plotting products by satisfaction and market presence

Highlighted products: Tableau, Microsoft Power BI, Databricks, Domo, Sigma, Looker, SAS Viya, and Kyvos Semantic Layer.

Underlying data: [Grid® JSON](https://www.g2.com/categories/analytics-platforms/grids.json?focus%5B%5D=tableau&focus%5B%5D=microsoft-microsoft-power-bi&focus%5B%5D=databricks&focus%5B%5D=domo&focus%5B%5D=sigma-computing-sigma&focus%5B%5D=looker&focus%5B%5D=sas-sas-viya&focus%5B%5D=kyvos-semantic-layer&segment=mid-market)

SAP Analytics Cloud

With the SAP Analytics Cloud solution, you can bring together analytics and planning with unique integration to SAP applications and smooth access to heterogenous data sources. As the analytics and planning solution within SAP Business Technology Platform, SAP Analytics Cloud supports trusted insights and integrated planning processes enterprise-wide to help you make decisions without doubt.

Average Rating: 4.2/5.0

Total Reviews: 748

How Do G2 Users Rate SAP Analytics Cloud?

  • Has the product been a good partner in doing business?: 8.3/10 (Category avg: 9.2/10)
  • Steps to Answer: 8.0/10 (Category avg: 8.4/10)
  • Reports Interface: 8.3/10 (Category avg: 8.8/10)
  • Calculated Fields: 7.9/10 (Category avg: 8.5/10)

Who Is the Company Behind SAP Analytics Cloud?

  • Seller: SAP
  • Year Founded: 1972
  • HQ Location: Walldorf
  • Twitter: @SAP
    297,052 Twitter followers
  • LinkedIn® Page: www.linkedin.com
    149,349 employees on LinkedIn®
  • Ownership: NYSE:SAP

Who Uses This Product?

  • Who Uses This: Senior Consultant, Consultant
  • Top Industries: Information Technology and Services, Computer Software
  • Company Size: 49% Large, 28% Medium

What Do G2 Reviewers Say About SAP Analytics Cloud?

AI-generated summary from verified user reviews

Pros
  • Users value the ease of use in SAP Analytics Cloud, simplifying data understanding for everyday tasks and decision-making.
  • Users value the powerful data analysis capabilities of SAP Analytics Cloud for its seamless integration and advanced planning features.
  • Users value the strong visualization capabilities of SAP Analytics Cloud, enhancing data storytelling and stakeholder communication.
  • Users value the easy integrations of SAP Analytics Cloud, allowing seamless connectivity and enhanced collaboration across tools.
  • Users value the powerful integration and predictive modeling capabilities of SAP Analytics Cloud for efficient project management.
Cons
  • Users experience slow performance with large datasets, affecting efficiency and user satisfaction in SAP Analytics Cloud.
  • Users face a steep learning curve in SAP Analytics Cloud that can hinder effective usage without proper training.
  • Users face a steep learning curve with SAP Analytics Cloud, requiring training to navigate its advanced features effectively.
  • Users often face performance issues with SAP Analytics Cloud, particularly when handling large datasets and complex calculations.
  • Users note that handling large datasets can slow down performance, impacting their overall experience with SAP Analytics Cloud.

What Are Recent G2 Reviews of SAP Analytics Cloud?

What Are G2 Users Discussing About SAP Analytics Cloud?

Strategy One (formerly MicroStrategy ONE)

🚀 Strategy One – the AI+BI Platform for Enterprise Analytics at Scale What is Strategy One? Strategy One is the enterprise AI + BI platform that powers data-driven decision-making at scale. Built for complex enterprises, it unifies business intelligence, advanced analytics, and governed data modeling into a single, open platform. With native AI-powered workflows, pixel-perfect dashboards, modern self-service tools, and seamless integrations with Excel, Power BI, and Tableau, Strategy One delivers trusted insights wherever decisions are made. Why Strategy One? Unlike fragmented BI stacks or limited legacy tools, Strategy One provides an end-to-end platform with one trusted semantic core. Business users get governed self-service. Analysts get powerful modeling tools. Executives get real-time answers they can trust. And IT retains full control over data access, definitions, and lineage. Whether you’re creating executive dashboards, deploying embedded analytics, scaling AI copilots, or consolidating BI tools—Strategy One meets the moment with: ✅ Cloud-native architecture ✅ Open integrations with 200+ data sources ✅ Enterprise-grade security and governance ✅ Industry-leading performance and scale ✅ Built-in support for AI copilots, agents, and models Strategy One is trusted by global enterprises in banking, retail, healthcare, and government to turn data into decisions—fast, securely, and at scale.

Average Rating: 4.2/5.0

Total Reviews: 529

How Do G2 Users Rate Strategy One (formerly MicroStrategy ONE)?

  • Has the product been a good partner in doing business?: 7.7/10 (Category avg: 9.2/10)
  • Steps to Answer: 7.5/10 (Category avg: 8.4/10)
  • Reports Interface: 8.2/10 (Category avg: 8.8/10)
  • Calculated Fields: 8.0/10 (Category avg: 8.5/10)

Who Is the Company Behind Strategy One (formerly MicroStrategy ONE)?

Who Uses This Product?

  • Who Uses This: Business Intelligence Developer, Manager
  • Top Industries: Retail, Financial Services
  • Company Size: 62% Large, 29% Medium

What Do G2 Reviewers Say About Strategy One (formerly MicroStrategy ONE)?

AI-generated summary from verified user reviews

Pros
  • Users find the ease of use in Strategy One enhances data management and visualization, streamlining their workflow effectively.
  • Users value the commitment to innovation in Strategy One, enhancing functionality and keeping it ahead of competitors.
  • Users find the easy setup of Strategy One to be straightforward, enhancing their overall experience with the platform.
  • Users appreciate the customization capabilities of Strategy One, enabling quick and flexible report and dashboard creation.
  • Users value the flexible dashboard customization in Strategy One, enabling easy access to comprehensive data insights.
Cons
  • Users find the learning difficulty of Strategy One overwhelming, with notable challenges for both technical and end users.
  • Users find the product has a steep learning curve, requiring significant training and adjustments to master effectively.
  • Users find the Copilot integration lacking and face issues with slow service and data management difficulties.
  • Users find the complex usage of Strategy One challenging, citing a steep learning curve and integration issues with Excel.
  • Users find access restrictions frustrating, needing the enterprise version for better availability and customization options.

What Are Recent G2 Reviews of Strategy One (formerly MicroStrategy ONE)?

What Are G2 Users Discussing About Strategy One (formerly MicroStrategy ONE)?

Grow.com

Grow is a no-code full-stack business intelligence (BI) platform that empowers everyone in your organization to make data-driven decisions. By combining ETL, data warehousing and visualization in one easy-to-use platform, any organization can connect and explore its data to surface insights. Our unlimited-user license model gives everyone access to the answers they need without waiting in line for an analyst. Now everyone can make great decisions in real-time to accelerate their growth.

Average Rating: 4.3/5.0

Total Reviews: 275

How Do G2 Users Rate Grow.com?

  • Has the product been a good partner in doing business?: 8.8/10 (Category avg: 9.2/10)
  • Steps to Answer: 7.8/10 (Category avg: 8.4/10)
  • Reports Interface: 8.6/10 (Category avg: 8.8/10)
  • Calculated Fields: 8.3/10 (Category avg: 8.5/10)

Who Is the Company Behind Grow.com?

  • Seller: Epicor
  • Company Website:
  • Year Founded: 1972
  • HQ Location: Austin, TX
  • Twitter: @Epicor
    9,286 Twitter followers
  • LinkedIn® Page: www.linkedin.com
    6,161 employees on LinkedIn®

Who Uses This Product?

  • Who Uses This: Data Analyst, Account Manager
  • Top Industries: Marketing and Advertising, Computer Software
  • Company Size: 64% Small, 34% Medium

What Do G2 Reviewers Say About Grow.com?

AI-generated summary from verified user reviews

Pros
  • Users find Grow.com to offer ease of use, enabling clear dashboards and seamless data integration for effective reporting.
  • Users appreciate the simple and user-friendly interface of Grow.com, facilitating easy performance tracking and clear insights.
  • Users value the excellent visual tools of Grow.com for creating accessible and engaging data visualizations effortlessly.
  • Users appreciate the easy integrations with various APIs, enhancing accessibility and data management for better insights.
  • Users value the seamless integrations with various data sources, enhancing their ability to monitor and visualize metrics effectively.
Cons
  • Users find Grow.com to be expensive, particularly challenging for small businesses and startups when managing costs.
  • Users note the missing features that limit flexibility, such as data transformation and advanced visualization options.
  • Users note the slow loading times of Grow.com can hinder efficiency and create frustration during use.
  • Users find that slow performance when syncing data may hinder their overall experience with Grow.com.
  • Users frequently experience performance issues with Grow.com, encountering slow updates and lagging visualizations that hinder usability.

What Are Recent G2 Reviews of Grow.com?

What Are G2 Users Discussing About Grow.com?

AI can help you find the answers. G2 helps you trust them.

Connect G2 to Claude or ChatGPT for answers grounded in G2's trusted reviews, comparisons, and pricing from real user insights.

How it works

BlazeSQL

It is an AI-Native Self-Service BI Platform, centered around an AI Data Analyst chatbot that queries, analyzes and visualizes data from your SQL Database. It enables true self-service analytics by really understanding and learning about your company and Database, so it can reliably answer everyone's questions on demand. Unlike most tools that claim to do the same, BlazeSQL is not only reliable, but it provides intuitive tooling to provide the AI with context, explains its work to non-technical users so it's not a black box, and provides transparency for admins so they have visibility of all chats and can easily monitor accuracy. It helps non-technical people get insights independently, and technical people work faster. Results from the chat can effortlessly be added to dashboards, exported, saved for tracking, or shared. While Blaze can certainly return specific data or graphs on demand (ex. campaign performance), it can fully apply its intelligence and business understanding by taking a user's high level goals (ex. increasing Return on Ad spend) and autonomously conducting a comprehensive analysis to surface the right insights and make actionable suggestions. That way, it fully leverage's the capabilities of the world's most powerful AI models as they continue to become more and more capable. Advanced capabilities include autonomous agent monitoring & reporting, a slack integration, web research, and dynamic AI integrations with any API. Enterprise security features include Role Based Access Control, a desktop client with an "Offline-mode" that only sends metadata to the cloud but leaves query results completely local, SSO, 2FA, and strong encryption in transit and at-rest. Notable customers such as Yamaha have had success using BlazeSQL, and it continues to be successfully adopted by SMEs and Large enterprises alike. Various case studies and testimonials note results like a data team saving 1.5 days a week, data bottlenecks being eliminated so that business stakeholders are able to make data a daily part of their work and thinking, and teams starting to think more strategically and critically with their analysis to deliver real business impact and growth.

Average Rating: 4.4/5.0

Total Reviews: 135

How Do G2 Users Rate BlazeSQL?

  • Has the product been a good partner in doing business?: 9.0/10 (Category avg: 9.2/10)
  • Steps to Answer: 8.8/10 (Category avg: 8.4/10)
  • Reports Interface: 8.6/10 (Category avg: 8.8/10)
  • Calculated Fields: 8.3/10 (Category avg: 8.5/10)

Who Is the Company Behind BlazeSQL?

Who Uses This Product?

  • Who Uses This: Software Engineer
  • Top Industries: Information Technology and Services, Accounting
  • Company Size: 60% Small, 27% Medium

What Do G2 Reviewers Say About BlazeSQL?

AI-generated summary from verified user reviews

Pros
  • Users appreciate the efficient data analytics capabilities of BlazeSQL, enabling quick insights and empowering self-service analysis.
  • Users appreciate the ease of use of BlazeSQL, enabling efficient data analysis and empowering non-technical users.
  • Users appreciate the efficiency and ease of use BlazeSQL offers for data analysis and self-service capabilities.
  • Users value the flexibility of BlazeSQL, enabling quick adjustments and diverse analytical capabilities through natural language queries.
  • Users value the easy integrations of BlazeSQL, enabling efficient data analysis and empowering non-technical users to explore insights.

What Are Recent G2 Reviews of BlazeSQL?

OWOX

OWOX Data Marts is a Free Forever Self-Service Analytics Platform that brings live, trusted data to spreadsheets and dashboards of decision-makers. Ask in plain English or click to build – your trusted reports update in real time with no analyst in the loop. With OWOX Data Marts, companies grow revenue as fast as they collect new data by enabling self-service reporting for everyone. Trusted by 165,000+ users in data teams, but also in marketing, finance, and product teams: from fast-scaling startups to global enterprises, OWOX products powers decisions across every department with data people actually trust. ‍ Self-hosted and Cloud Deployment are available to suit any data stack. Imagine a world where exploring data is as easy as driving a car, without the limitations of public transport (traditional BI dashboards) or the cost of a private driver (data analysts). That's exactly what we assure you!

Average Rating: 4.9/5.0

Total Reviews: 290

How Do G2 Users Rate OWOX?

  • Has the product been a good partner in doing business?: 9.4/10 (Category avg: 9.2/10)
  • Steps to Answer: 5.0/10 (Category avg: 8.4/10)
  • Reports Interface: 5.8/10 (Category avg: 8.8/10)
  • Calculated Fields: 10.0/10 (Category avg: 8.5/10)

Who Is the Company Behind OWOX?

  • Seller: OWOX
  • Year Founded: 2002
  • HQ Location: WALNUT, California
  • Twitter: @owox
    435 Twitter followers
  • LinkedIn® Page: www.linkedin.com
    69 employees on LinkedIn®

Who Uses This Product?

  • Who Uses This: Chief Marketing Officer, CEO
  • Top Industries: Marketing and Advertising, Information Technology and Services
  • Company Size: 48% Small, 43% Medium

What Do G2 Reviewers Say About OWOX?

AI-generated summary from verified user reviews

Pros
  • Users appreciate the ease of use of OWOX, finding it reliable and quick to implement without issues.
  • Users appreciate the excellent support team and flexibility of OWOX in addressing their unique needs.
  • Users value the transparency and accessibility of data ownership with OWOX, enhancing their data management capabilities.
  • Users value the excellent customer support from OWOX, appreciating their responsiveness and ongoing assistance.
  • Users value the ease of use and insightful analytics of OWOX, significantly enhancing their data-driven decisions.
Cons
  • Users face data management issues with OWOX, highlighting bugs and scheduling reliability concerns affecting their experience.
  • Users face error handling challenges with OWOX, often requiring dedicated resources for troubleshooting and issue resolution.
  • Users find the pricing structure expensive, wishing for more affordable options to enhance their experience.
  • Users feel the integration issues with third-party apps hinder the overall functionality of OWOX.
  • Users desire more step-by-step instructions and greater reliability in scheduling features for OWOX.

What Are Recent G2 Reviews of OWOX?

What Are G2 Users Discussing About OWOX?

Toucan

Toucan is an AI-embedded analytics platform designed to assist independent software vendors (ISVs) and SaaS companies in integrating advanced analytics features directly into their products, eliminating the need for building these capabilities from the ground up. This platform is tailored specifically for customer-facing applications, meaning that the end users are the clients of these companies rather than internal analysts. By enabling product and operations teams to configure and deploy analytics features independently, Toucan streamlines the development process and reduces reliance on data engineering resources. The target audience for Toucan primarily includes ISVs and SaaS companies across various industries, such as fintech, HR tech, and marketing technology. These organizations often seek to enhance their product offerings with sophisticated analytics capabilities that provide value to their users. With Toucan, product teams can quickly implement features that allow end users to interact with data in meaningful ways. This is particularly beneficial for companies looking to differentiate themselves in competitive markets by offering robust analytics without the lengthy development cycles typically associated with such features. Toucan's key capabilities include conversational AI analytics, which empowers end users to pose questions in natural language and receive instant data visualizations. This feature is anchored in a governed semantic layer, ensuring that the insights provided are consistent and reliable. Additionally, the platform offers automatic dashboard generation through AI, allowing users to customize layouts, colors, and metrics without requiring technical expertise. The white-label, multi-tenant embedding options ensure that analytics seamlessly integrate into existing products, creating a native experience for users. Security and compliance are paramount in today's data-driven landscape, and Toucan addresses these concerns with row-level security and granular permissions. This ensures that each end user only accesses their specific data, making it suitable for regulated industries where data privacy is critical. Furthermore, Toucan supports connections to modern data infrastructures, such as PostgreSQL, MySQL, and AWS Redshift, and offers both SaaS and self-hosted deployment options to meet various organizational needs. The platform's no-code builder is a standout feature, enabling product and operations teams to create, edit, and publish dashboards without any coding knowledge. This capability significantly reduces dashboard development time—by up to two-thirds compared to traditional in-house builds—allowing ISVs to launch reporting modules in days instead of months. By embedding analytics as a premium feature, organizations can also create new revenue streams, enhancing their overall product value while minimizing additional development overhead. With over 350 clients already leveraging its capabilities, Toucan is positioned as a powerful solution for companies looking to enhance their analytics offerings.

Average Rating: 4.7/5.0

Total Reviews: 179

How Do G2 Users Rate Toucan?

  • Has the product been a good partner in doing business?: 9.4/10 (Category avg: 9.2/10)
  • Steps to Answer: 8.5/10 (Category avg: 8.4/10)
  • Reports Interface: 8.7/10 (Category avg: 8.8/10)
  • Calculated Fields: 8.5/10 (Category avg: 8.5/10)

Who Is the Company Behind Toucan?

  • Seller: Toucan Toco
  • Year Founded: 2015
  • HQ Location: Boston, Massachusetts
  • Twitter: @Toucan_Toco
    2,402 Twitter followers
  • LinkedIn® Page: www.linkedin.com
    74 employees on LinkedIn®

Who Uses This Product?

  • Who Uses This: Data Analyst
  • Top Industries: Computer Software, Banking
  • Company Size: 43% Small, 30% Medium

What Do G2 Reviewers Say About Toucan?

AI-generated summary from verified user reviews

Pros
  • Users love the ease of use in Toucan, appreciating its intuitive setup and seamless integration for daily tasks.
  • Users appreciate the easy integrations with existing tech ecosystems, enhancing their data accessibility and usability.
  • Users love the intuitive data visualization tools in Toucan, making analytics accessible for all skill levels.
  • Users value the flexible integrations of Toucan, enabling seamless connections to various data sources for dynamic dashboards.
  • Users appreciate the no-code dashboard creation feature of Toucan, making data visualization accessible and efficient.
Cons
  • Users find the navigation complex in Toucan, which can hinder the experience for new users.
  • Users find the complex usage of Toucan challenging, especially for new users navigating the interface independently.
  • Users find the learning curve steep with Toucan, struggling to navigate its complex interface effectively.
  • Users note the limited customization options in Toucan, which restricts control over data presentation but simplifies visualizations.
  • Users report that bugs in Toucan can lead to higher maintenance costs and require additional learning for technical development.

What Are Recent G2 Reviews of Toucan?

What Are G2 Users Discussing About Toucan?

Rapidminer AI Studio

Rapidminer AI Studio is a data science tool that anyone can use to design and prototype highly explainable AI and machine learning models that help build trust throughout an organization. Rapidminer AI Studio includes: - Full generative AI functionality with access to hundreds of large language models (LLMs). - Intuitive and powerful drag-and-drop canvases that give users code-like control without complexity. - Award-winning auto ML with automated clustering, predictive modeling, feature engineering, and time series forecasting. - Data connectivity, exploration, and preparation. - Deploy and manage AI projects and models at enterprise scale. - Collaborate with team members in the same environment without having to worry about overwriting each other's work. - Unify the entire data science lifecycle from data exploration and machine learning to model operations and visualization and deploy in the cloud. Rapidminer AI Studio helps users make powerful insights accessible to the entire organization and can scale seamlessly for users and enterprises. Rapidminer AI studio enables organizations to derive significant value from AI with minimal cost and operational impact.

Average Rating: 4.6/5.0

Total Reviews: 512

How Do G2 Users Rate Rapidminer AI Studio?

  • Has the product been a good partner in doing business?: 8.9/10 (Category avg: 9.2/10)
  • Steps to Answer: 10.0/10 (Category avg: 8.4/10)
  • Reports Interface: 10.0/10 (Category avg: 8.8/10)
  • Calculated Fields: 10.0/10 (Category avg: 8.5/10)

Who Is the Company Behind Rapidminer AI Studio?

Who Uses This Product?

  • Who Uses This: Student, Professor
  • Top Industries: Higher Education, Education Management
  • Company Size: 41% Small, 31% Large

What Do G2 Reviewers Say About Rapidminer AI Studio?

AI-generated summary from verified user reviews

Pros
  • Users praise the ease of use of Altair AI Studio, finding its interface intuitive and beneficial for data tasks.
  • Users value the no-code machine learning capabilities of Altair AI Studio, facilitating easy model creation and analysis.
  • Users value the seamless AI integration of Altair AI Studio, enhancing decision-making and improving efficiency across organizations.
  • Users appreciate the advanced machine learning and data analytics in Altair AI Studio for smarter decision-making and efficiency.
  • Users value the automation capabilities of Altair AI Studio, enhancing efficiency in data processing and decision making.
Cons
  • Users find the complexity of Altair AI Studio challenging, particularly with language support and integrating legacy systems.
  • Users experience slower performance when handling large datasets in Altair AI Studio, affecting their efficiency and experience.
  • Users experience slow performance when handling large datasets, leading to slowdowns or freezing during usage.
  • Users find the complexity issues of Altair AI Studio frustrating, especially due to limited support resources.
  • Users find the complex usage of Altair AI Studio challenging, especially due to limited documentation and steep learning curve.

What Are Recent G2 Reviews of Rapidminer AI Studio?

What Are G2 Users Discussing About Rapidminer AI Studio?

SAS Visual Analytics

SAS® Visual Analytics is a single application for reporting, data exploration and analytics that empowers everyone to easily discover and share powerful insights. https://www.youtube.com/watch?v=vWiNNoXYZG8

Average Rating: 4.4/5.0

Total Reviews: 207

How Do G2 Users Rate SAS Visual Analytics?

  • Has the product been a good partner in doing business?: 8.7/10 (Category avg: 9.2/10)
  • Steps to Answer: 8.6/10 (Category avg: 8.4/10)
  • Reports Interface: 8.7/10 (Category avg: 8.8/10)
  • Calculated Fields: 8.5/10 (Category avg: 8.5/10)

Who Is the Company Behind SAS Visual Analytics?

  • Seller: SAS Institute
  • Year Founded: 1976
  • HQ Location: Cary, NC
  • Twitter: @SASsoftware
    60,863 Twitter followers
  • LinkedIn® Page: www.linkedin.com
    15,122 employees on LinkedIn®
  • Phone: 1-800-727-0025

Who Uses This Product?

  • Who Uses This: Student
  • Top Industries: Banking, Higher Education
  • Company Size: 42% Large, 32% Small

What Do G2 Reviewers Say About SAS Visual Analytics?

AI-generated summary from verified user reviews

Pros
  • Users appreciate the ease of use of SAS Visual Analytics, enabling quick insights without technical expertise.
  • Users value the seamless integration of SAS Visual Analytics with various data sources, enhancing their analytical experience.
  • Users find SAS Visual Analytics to be easy to use for data analysis, enabling efficient exploration and insight generation.
  • Users appreciate the dynamics of data visualization in SAS Visual Analytics, simplifying insights and dashboard creation.
  • Users value the dynamic charting features of SAS Visual Analytics, enhancing data exploration and insight sharing easily.
Cons
  • Users experience slow performance with large datasets and complex reports, impacting overall efficiency and responsiveness.
  • Users note that SAS Visual Analytics is expensive, which may deter businesses from adopting its functionalities.
  • Users often face bugs and integration difficulties with other programming languages, impacting their overall experience.
  • Users find the interface complexity of SAS Visual Analytics hinders ease of use and user-friendliness.
  • Users find the complexity of the interface to be a barrier to effective use of SAS Visual Analytics.

What Are Recent G2 Reviews of SAS Visual Analytics?

What Are G2 Users Discussing About SAS Visual Analytics?

Databox

Databox is an agentic analytics platform for people responsible for business performance. It brings data from across the business into one place and organizes it around consistent metrics and the context that explains how the business works. Start with prebuilt metrics and definitions, or prepare your own data and create the custom metrics, calculations, and datasets you need. With that foundation in place, Databox does more of the recurring reporting and analysis. Ask its AI Analyst questions about your business and get clear answers with the reasoning behind them. Use Routines to surface important changes automatically. Turn insights into polished reports that explain what happened and why it matters. Or use Databox MCP to bring your performance data and context into AI tools like Claude, so analysis, decisions, and action can happen where you already work. Because the data, metrics, context, analytical capabilities, and AI-powered workflows are connected in one platform, you do not have to assemble the foundation or repeat the same analysis yourself. Databox helps you understand what is changing, see what deserves attention, and take better-informed action faster, while you remain in control. Try it free today at databox.com.

Average Rating: 4.4/5.0

Total Reviews: 189

How Do G2 Users Rate Databox?

  • Has the product been a good partner in doing business?: 9.0/10 (Category avg: 9.2/10)
  • Steps to Answer: 8.5/10 (Category avg: 8.4/10)
  • Reports Interface: 9.0/10 (Category avg: 8.8/10)
  • Calculated Fields: 8.6/10 (Category avg: 8.5/10)

Who Is the Company Behind Databox?

  • Seller: Databox
  • Year Founded: 2012
  • HQ Location: Boston, MA
  • Twitter: @databoxHQ
    7,310 Twitter followers
  • LinkedIn® Page: www.linkedin.com
    113 employees on LinkedIn®

Who Uses This Product?

  • Who Uses This: Founder, Marketing Manager
  • Top Industries: Marketing and Advertising, Computer Software
  • Company Size: 71% Small, 21% Medium

What Do G2 Reviewers Say About Databox?

AI-generated summary from verified user reviews

Pros
  • Users value the ease of use of Databox, simplifying access to vital business metrics from one platform.
  • Users value the simple integrations in Databox, enabling seamless access to critical business metrics from various platforms.
  • Users value the easy integrations of Databox, seamlessly consolidating metrics from multiple systems into one tool.
  • Users praise the brilliant customer support of Databox, resolving issues promptly and enhancing the overall experience.
  • Users value the impressive AI summary feature of Databox, enhancing reporting with insightful and up-to-date information.
Cons
  • Users feel that Databox has connection issues due to a lack of integrations needed for specific industries.
  • Users note the connectivity issues with Databox, as it lacks integrations for specific industry needs.
  • Users find the pricing of Databox to be excessively high, leading to misunderstandings and customer dissatisfaction.
  • Users express frustration over expensive pricing changes without consent, leading to billing issues and lost trust.
  • Users find that the learning curve of Databox poses initial challenges, but offers long-term efficiency benefits.

What Are Recent G2 Reviews of Databox?

Gathr.ai

Gathr.ai powers AI with complete data context for higher quality intelligence. With day-zero, high-fidelity data discourse, users can get data-backed answers to the ‘why’, ‘what-if’, and ‘how do I’ questions that drive business KPIs forward. This intelligence is delivered natively on top of the organization’s existing data estate — including data warehouses, databases, federated SQL engines, and operational systems. Leading businesses across industries also rely on Gathr.ai to build high-performance data pipelines, bespoke Data+AI solutions, and action-driven analytics experiences. Built for builders, Gathr.ai delivers agility, performance, and control. It snaps into the existing stack — integrating upstream and downstream systems with no extra plumbing. It gives developers starter-kit speed and full extension freedom.

Average Rating: 4.8/5.0

Total Reviews: 33

How Do G2 Users Rate Gathr.ai?

  • Has the product been a good partner in doing business?: 10.0/10 (Category avg: 9.2/10)
  • Steps to Answer: 9.8/10 (Category avg: 8.4/10)
  • Reports Interface: 9.8/10 (Category avg: 8.8/10)
  • Calculated Fields: 9.8/10 (Category avg: 8.5/10)

Who Is the Company Behind Gathr.ai?

  • Seller: Gathr.ai
  • Year Founded: 2022
  • HQ Location: Los Gatos, CA, US
  • LinkedIn® Page: www.linkedin.com
    46 employees on LinkedIn®

Who Uses This Product?

  • Who Uses This: Associate Software Engineer
  • Top Industries: Information Technology and Services, Computer Software
  • Company Size: 79% Medium, 21% Large

What Do G2 Reviewers Say About Gathr.ai?

AI-generated summary from verified user reviews

Pros
  • Users value the seamless integrations of Gathr.ai, enabling quick connections and streamlined data processing for analytics.
  • Users celebrate the user-friendly data management features of Gathr.ai, enabling quick insights and better data quality control.
  • Users appreciate the intuitive drag-and-drop interface of Gathr.ai, enabling quick and easy pipeline creation and integration.
  • Users appreciate the ease of use of Gathr.ai, making data processing quick and efficient with its intuitive interface.
  • Users love the easy integrations with Gathr.ai, enabling swift creation of complex data workflows and analytics.
Cons
  • Users note that access issues arise due to a lack of native connectors, complicating integration workflows.
  • Users report connection issues when configuring connectors for legacy systems, but support can offer timely solutions.
  • Users find the difficult setup of custom connectors a bit challenging, but it's not a major hindrance.
  • Users find the lack of real-time data hinders their ability to effectively monitor or improve pipeline performance.
  • Users find that performance optimization requires technical expertise and lacks visibility into real-time data transfer rates.

What Are Recent G2 Reviews of Gathr.ai?

Yellowfin BI

Yellowfin BI is a data analytics platform that helps users make faster decisions, trusted by over 29,000 organizations and 3 million end-users worldwide for over two decades. Built for both embedded and enterprise BI use cases, with strong data security and governance, it can be deployed on-premise, in the cloud, or in hybrid environments. The platform uses AI to proactively surface trends and outliers, answer questions asked in natural language, and transform data into interactive stories and live reports that decision-makers actually use. The latest release of Yellowfin BI can build verifiable reports from a single question, utilize the AI model of your choice to create actionable analytical stories, and allow users to ask contextual follow-up questions about any surfaced data point, bringing more confidence to critical business decisions.

Average Rating: 4.4/5.0

Total Reviews: 419

How Do G2 Users Rate Yellowfin BI?

  • Has the product been a good partner in doing business?: 8.9/10 (Category avg: 9.2/10)
  • Steps to Answer: 8.0/10 (Category avg: 8.4/10)
  • Reports Interface: 8.6/10 (Category avg: 8.8/10)
  • Calculated Fields: 8.2/10 (Category avg: 8.5/10)

Who Is the Company Behind Yellowfin BI?

  • Seller: Yellowfin
  • Year Founded: 2003
  • HQ Location: Austin, US
  • Twitter: @yellowfinbi
    5,783 Twitter followers
  • LinkedIn® Page: www.linkedin.com
    64 employees on LinkedIn®

Who Uses This Product?

  • Who Uses This: General Manager, Business Analyst
  • Top Industries: Computer Software, Information Technology and Services
  • Company Size: 46% Small, 35% Medium

What Do G2 Reviewers Say About Yellowfin BI?

AI-generated summary from verified user reviews

Pros
  • Users value the user-friendly interface of Yellowfin BI, enabling seamless dashboard creation and data visualization.
  • Users value the user-friendly data visualization capabilities of Yellowfin BI, enabling easy and effective reporting.
  • Users appreciate the intuitive interface of Yellowfin BI, enabling quick setup and easy report creation without technical challenges.
  • Users praise the user-friendly interface of Yellowfin BI, enabling quick dashboard creation and easy data exploration.
  • Users value the quick and easy dashboard customization of Yellowfin BI, enabling rapid and effective data visualization.
Cons
  • Users often experience a steep learning curve with Yellowfin BI, especially for advanced features and customization.
  • Users report challenges with large data handling in Yellowfin BI, noting performance slowdowns and lengthy filter refresh times.
  • Users experience slow performance with large datasets in Yellowfin BI, impacting efficiency and user satisfaction.
  • Users often face performance issues with Yellowfin BI, including slow loading times for large datasets and complex dashboards.
  • Users find limited customization in Yellowfin BI, affecting advanced analytics and the ability to create tailored visualizations.

What Are Recent G2 Reviews of Yellowfin BI?

What Are G2 Users Discussing About Yellowfin BI?

Dataiku

Dataiku is the Platform for AI Success: the AI orchestration layer where enterprises build, deploy, and govern analytics, models, and agents at scale. It sits on top of the data platforms, clouds, and AI services you already use, working across all of them without locking you into any one. Dataiku expands who can build production AI, putting the right tools in the hands of data scientists and domain experts alike, from fraud analysts to demand planners. It orchestrates machine learning, rules, LLMs, and agents as one governed system, built on more than a decade of running production AI. Governance is part of the build rather than something bolted on afterward, so teams ship faster while keeping performance, cost, and risk under control. The result: AI that moves from experimentation to trusted, measurable execution now, not in 18 months.

Average Rating: 4.4/5.0

Total Reviews: 253

How Do G2 Users Rate Dataiku?

  • Has the product been a good partner in doing business?: 8.6/10 (Category avg: 9.2/10)
  • Steps to Answer: 7.7/10 (Category avg: 8.4/10)
  • Reports Interface: 7.8/10 (Category avg: 8.8/10)
  • Calculated Fields: 8.2/10 (Category avg: 8.5/10)

Who Is the Company Behind Dataiku?

  • Seller: Dataiku
  • Company Website:
  • Year Founded: 2013
  • HQ Location: New York, NY
  • Twitter: @dataiku
    22,917 Twitter followers
  • LinkedIn® Page: www.linkedin.com
    1,605 employees on LinkedIn®

Who Uses This Product?

  • Who Uses This: Data Scientist, Data Analyst
  • Top Industries: Financial Services, Pharmaceuticals
  • Company Size: 58% Large, 23% Medium

What Do G2 Reviewers Say About Dataiku?

AI-generated summary from verified user reviews

Pros
  • Users appreciate how Dataiku simplifies ML development, enabling quick training, evaluation, and understanding of data easily.
  • Users find Dataiku easy to use, simplifying ML development and helping detect opportunities and risks effortlessly.
  • Users value the ease of use in Dataiku, enabling collaboration and simplifying complex data processes for all skill levels.
  • Users appreciate the easy integrations of Dataiku, facilitating collaboration across diverse analytics tools and skill sets.
  • Users commend the productivity improvement brought by Dataiku’s visual recipes and robust tools for analytics projects.
Cons
  • Users find the learning curve steep, making it challenging for beginners to fully utilize Dataiku's advanced features.
  • Users find the steep learning curve challenging, especially for beginners navigating Dataiku's advanced features.
  • Users find the difficult learning curve challenging for beginners, impacting their ability to maximize the platform's potential.
  • Users face slow performance with Dataiku when managing large datasets, impacting efficiency and productivity.
  • Users find the pricing high for small companies and students, impacting accessibility for basic projects.

What Are Recent G2 Reviews of Dataiku?

What Are G2 Users Discussing About Dataiku?

Zoho Analytics

Zoho Analytics is a GenAI-powered self-service BI and analytics platform that helps businesses collect, prepare, analyze, and present insights from their data, all within minutes. Integrate with 500+ native data sources, like files, feeds, local and cloud databases, cloud storage, and popular business apps. Clean, transform, enrich, and catalog data with our agentic AI-powered, self-service data preparation and management capabilities. Create and manage complex ETL data pipelines using our visual pipeline builder, process stream data for real-time analytics, and set up a strong metrics layer for quality analysis and management. Zoho Analytics comes with 100+ domain-specific prebuilt reports and dashboards, pre-trained NLQ models, intelligently modeled and blended data across business applications, and lots more. Use our intuitive drag-and-drop visualization builder to build insightful and interactive reports and dashboards using a wide variety of visual components, like charts, widgets, pivot tables, tabular views and more. Generate customized reports and dashboards using simple, natural language with our AI-powered conversational agent, Zia. Ask Zia goes beyond basic reporting; it enables users to perform diagnostic analytics, forecast key metrics, and receive intelligent insights and recommendations. Users can assign tasks and trigger actions just by conversing with our agentic AI, Zia, streamlining their workflows and empowering data-driven decisions. Seamlessly embed Ask Zia into your custom or business applications to deliver contextual insights and actions. Enrich your analysis with automated insights by using our NLG-powered narration engine, Zia Insights. With diagnostic analytics for smarter decision-making, Zia Insights takes automated insights to the next level by bubbling up key drivers for particular business tasks. Enumerate complex business scenarios with what-if analyses, forecast KPIs, uncover trends and patterns with advanced analytical capabilities. Leverage cognitive analysis for keyword extraction and sentiment analysis, and more. Evaluate the best ML models with no-code assistance or develop custom models and functions using Python Code Studio. Zoho Analytics comes with pre-packed ML models (AutoML) that allow you to evaluate and pick the best model for your use case. Alternatively custom models and functions using Python Code Studio Embed our full-fledged analytics platform into other software applications. Craft and present immersive data stories through slideshows or purpose-built analytics portals. Collaborate securely through contextual comment threads and real-time messaging. Zoho Analytics has a robust set of APIs that enables elaborate customization and highly extensible low-code and no-code integration with any technology stack. It also offers a high degree of deployment flexibility (private, public, multi-cloud, and on-premises) and platform extensibility (professional services, partner support, and marketplace). Zoho Analytics is modern and scalable, and it can readily match growing data volumes and usage. Its time-tested and accredited enterprise-grade security features and governance framework ensure continuous data management and stewardship. On top of everything else, the TCO for Zoho Analytics—including licensing, implementation, customization, training, and support—is the lowest in our market.

Average Rating: 4.2/5.0

Total Reviews: 285

How Do G2 Users Rate Zoho Analytics?

  • Has the product been a good partner in doing business?: 8.5/10 (Category avg: 9.2/10)
  • Steps to Answer: 8.0/10 (Category avg: 8.4/10)
  • Reports Interface: 8.1/10 (Category avg: 8.8/10)
  • Calculated Fields: 8.3/10 (Category avg: 8.5/10)

Who Is the Company Behind Zoho Analytics?

  • Seller: Zoho
  • Year Founded: 1996
  • HQ Location: Austin, TX
  • Twitter: @Zoho
    137,880 Twitter followers
  • LinkedIn® Page: www.linkedin.com
    30,913 employees on LinkedIn®
  • Phone: +1 (888) 900-9646

Who Uses This Product?

  • Who Uses This: Director, Business Analyst
  • Top Industries: Information Technology and Services, Computer Software
  • Company Size: 51% Small, 42% Medium

What Do G2 Reviewers Say About Zoho Analytics?

AI-generated summary from verified user reviews

Pros
  • Users appreciate the ease of use of Zoho Analytics, thanks to its intuitive interface and customizable dashboards.
  • Users value the intuitive interface and customization of Zoho Analytics, enhancing their data reporting experience effortlessly.
  • Users appreciate the seamless integrations of Zoho Analytics, enabling easy data import from various external sources.
  • Users appreciate the user-friendly dashboards of Zoho Analytics, enabling easy customization and efficient data tracking.
  • Users appreciate the intuitive data visualization in Zoho Analytics, making complex analysis accessible and straightforward.
Cons
  • Users experience a steep learning curve with Zoho Analytics, especially for complex reports and advanced features.
  • Users find the limited customization options in Zoho Analytics frustrating compared to other platforms, like Google Analytics.
  • Users experience limited data integration options with Zoho Analytics, hindering seamless connectivity and overall functionality.
  • Users face integration issues with Zoho Analytics, limiting connections to external data sources and complicating functionality.
  • Users feel the missing features in Zoho Analytics limit functionality, especially for advanced data analysis tasks.

What Are Recent G2 Reviews of Zoho Analytics?

What Are G2 Users Discussing About Zoho Analytics?

Sisense

Sisense is an API-first analytics platform that modernizes businesses by seamlessly integrating in-context analytics within applications, leading to action-oriented insights that enhance decision intelligence.

Average Rating: 4.2/5.0

Total Reviews: 991

How Do G2 Users Rate Sisense?

  • Has the product been a good partner in doing business?: 8.7/10 (Category avg: 9.2/10)
  • Steps to Answer: 7.7/10 (Category avg: 8.4/10)
  • Reports Interface: 8.3/10 (Category avg: 8.8/10)
  • Calculated Fields: 8.0/10 (Category avg: 8.5/10)

Who Is the Company Behind Sisense?

  • Seller: Sisense, Inc.
  • Company Website:
  • Year Founded: 2004
  • HQ Location: New York
  • Twitter: @Sisense
    6,543 Twitter followers
  • LinkedIn® Page: www.linkedin.com
    534 employees on LinkedIn®

Who Uses This Product?

  • Who Uses This: Data Analyst, Product Manager
  • Top Industries: Information Technology and Services, Computer Software
  • Company Size: 57% Medium, 24% Small

What Do G2 Reviewers Say About Sisense?

AI-generated summary from verified user reviews

Pros
  • Users find Sisense's ease of use exceptional, facilitating clear data visualization and seamless integration for better insights.
  • Users appreciate Sisense's easy dashboard and widget creation, enhancing data insights and user-friendly visualizations.
  • Users value the seamless integrations of Sisense, allowing for efficient data management and user-friendly analytics across platforms.
  • Users praise the amazing customer support of Sisense, highlighting their quick response and effective assistance.
  • Users value the extensive dashboard customization in Sisense, enabling tailored data visualization and improved insights.
Cons
  • Users experience a steep learning curve in implementing Sisense, making setup challenging, especially for the less technical.
  • Users note the missing features in Sisense, including limited query capabilities and insufficient visualization options.
  • Users find Sisense buggy and visually unappealing, with unreliable customer support and CI/CD issues affecting their operations.
  • Users find dashboard setup tedious and complicated, requiring extensive technical knowledge and design skills for effective use.
  • Users find limited customization in Sisense dashboards, making it challenging for non-technical users to optimize their experience.

What Are Recent G2 Reviews of Sisense?

What Are G2 Users Discussing About Sisense?

Board

Board is the most trusted Agentic Planning Platform, combining business context, Continuous Planning, and efficient enterprise AI to deliver confident, aligned, and faster decisions. Built to complement your data and AI strategy, Board brings together enterprise data and external signals with planning models, business logic, domain expertise, and decision context. Continuous Planning continuously senses change, models scenarios and trade-offs, and aligns financial and operational plans. Within a single, governed platform, agentic AI understands how your business makes decisions, reasons effectively, recommends changes, and supports action with human oversight, helping leaders make explainable, accountable decisions that improve business outcomes.

Average Rating: 4.4/5.0

Total Reviews: 305

How Do G2 Users Rate Board?

  • Has the product been a good partner in doing business?: 8.8/10 (Category avg: 9.2/10)
  • Steps to Answer: 8.4/10 (Category avg: 8.4/10)
  • Reports Interface: 8.7/10 (Category avg: 8.8/10)
  • Calculated Fields: 8.5/10 (Category avg: 8.5/10)

Who Is the Company Behind Board?

  • Seller: Board International
  • Company Website:
  • Year Founded: 1994
  • HQ Location: Chiasso, Ticino
  • Twitter: @BoardSoftware
    27,073 Twitter followers
  • LinkedIn® Page: www.linkedin.com
    948 employees on LinkedIn®

Who Uses This Product?

  • Who Uses This: Software Engineer, Group Controller
  • Top Industries: Information Technology and Services, Computer Software
  • Company Size: 57% Medium, 40% Large

What Do G2 Reviewers Say About Board?

AI-generated summary from verified user reviews

Pros
  • Users praise the ease of use of Board, facilitating quick deployment and intuitive self-service interactions.
  • Users value the flexibility of Board, allowing customization to fit diverse business needs seamlessly.
  • Users value the centralized access to information, making board meetings efficient and focused on strategic discussions.
  • Users value the efficiency of Board, benefiting from faster deployment and streamlined meeting management.
  • Users appreciate the highly flexible customization of Board, allowing tailored solutions for diverse business needs.
Cons
  • Users experience slow performance with large datasets on Board, impacting efficiency and complicating the use of advanced features.
  • Users find that the learning curve for Board can be steep, particularly in configuration and advanced features.
  • Users find the missing features like layout exclusions limiting, impacting their overall experience with Board.
  • Users express frustration with poor visualization in Board, highlighting inefficiencies in dashboard design and data handling.
  • Users find the complexity of configuration in Board challenging, especially for new users and smaller teams.

What Are Recent G2 Reviews of Board?

What Are G2 Users Discussing About Board?

Tian Lin
TL
Researched and written by Tian Lin
Updated