Products
(974)
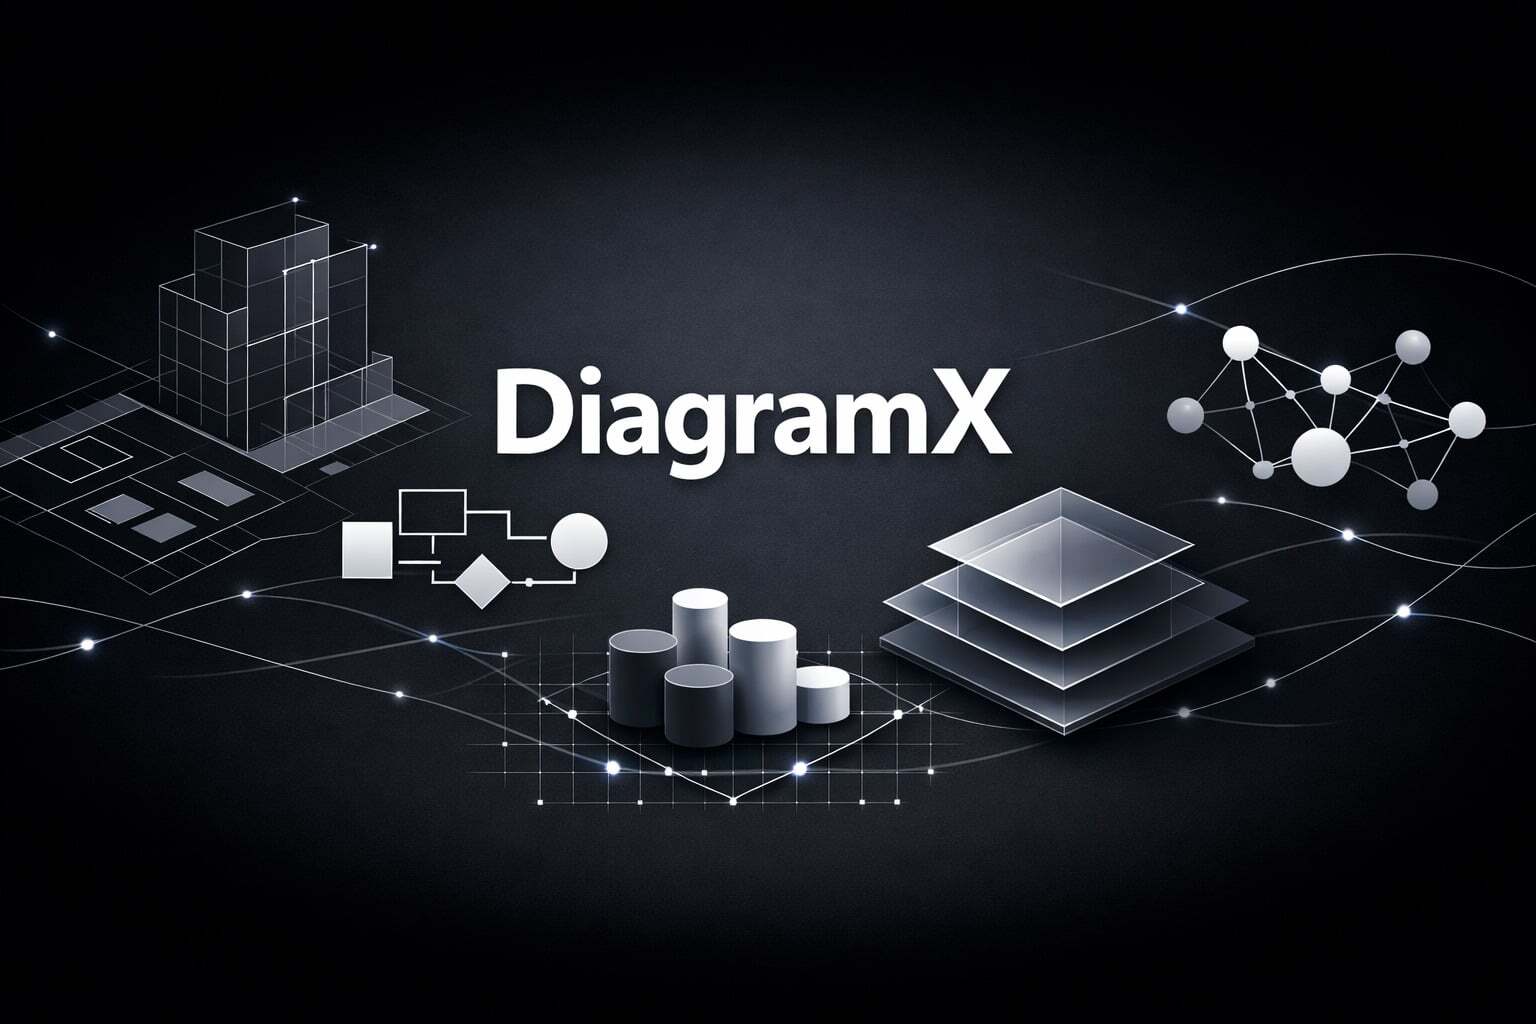
DiagramX is an AI-powered diagram creation and visualization platform that automatically generates enterprise architecture diagrams, system designs and technical documentation.
Aerogram is an AI transformation partner that streamlines the automation of repetitive, error-prone tasks across various business functions, including Operations, Finance, Legal, HR, and Support. By implementing reliable AI agent workflows, Aerogram enables teams to focus on high-priority work, enhancing productivity and reducing manual errors. Key Features and Functionality: - Automated Workflows: Designs and deploys AI-driven workflows to handle routine tasks, minimizing human intervention.
Aiqaramba is an AI-driven testing platform designed for B2B SaaS companies, enabling teams to automate end-to-end testing without the need for scripting. By describing test scenarios in plain language, AI agents execute these tests in real browsers, allowing for daily deployments with confidence and reducing the reliance on manual quality assurance processes. Key Features and Functionality: - Plain Language Test Scenarios: Users can define test cases using natural language, eliminating the nee
diagram.now is a browser-based diagram editor for creating flowcharts, UML diagrams, entity-relationship diagrams, BPMN process diagrams, cloud architecture diagrams, network diagrams, mind maps, and wireframes. It operates directly in web browsers without requiring installation. Users can start with blank canvases or built-in templates for organizational charts, kanban boards, and more. Shape libraries support various diagram types, and imports from Visio, Lucidchart, Gliffy, Mermaid, CSV, and
The Cadmatic plant design solution is dedicated to plant layout, piping design, HVAC design, design review and related tasks such as the 3D modelling of complete industrial projects, the creation of P&IDs (piping and instrumentation diagrams) and the generation of isometric drawings as well as data sharing in different formats.
mdMapper package combines industry-leading UAVs with payloads that were specifically designed for industrial applications like surveying, mapping, inspection, construction, mining, volumetrics, and precision agriculture. These packages and kits provide complete solutions that include aircraft, sensors, accessories, custom mounts, and even an Android tablet app that makes it easy to plan, monitor, adjust, and analyze your missions anywhere.
Jet Partners is a U.S. air charter broker that coordinates on-demand private charter for corporate and business travel through qualified third-party direct air carriers. A dedicated advisor helps define the mission, source aircraft and operator options, review trip-specific terms, and coordinate baggage, ground handling, accessibility, and other disclosed requirements. Jet Partners is not a direct air carrier; licensed third-party carriers perform flights and retain operational control.
Aqua Data Studio is a universal SQL IDE and analytics tool with a workspace environment that enables database developers, DBAs, and data/business analysts to develop, access, manage, and visually analyze data for relational, NoSQL, and cloud DBMS platforms from a single interface. Generate model diagrams, build sophisticated queries, edit table data, develop scripts, and create visual analytics
Create and send smart surveys, forms, questionnaires, decision trees, flow charts and workflows via email, SMS, links and more. Use www.FlowCharts.ai for your own personal, business, company, enterprise, educational or organizational needs to obtain better data from your leads, customers, patients and clients. Common Uses and Examples of FlowCharts.ai •Boost Google, Facebook and Yelp Reviews -- Send text messages to your customers where they can generate positive online reviews which boost you
ZeldDesigner is a simple to use yet powerful 2D vector graphics drawing application for creating illustrations, schematics, diagrams, artwork, and more. Draw, edit, and combine shapes, with a variety of line strokes, fill colors, and fill gradients to create impressive, complex illustrations. Vector drawings are described mathematically, rather than using bitmaps, allowing them to be scaled to any resolution for display and printing.
Octave Facets P&ID (formerly Smart P&ID) is an intelligent, data-centric solution for creating and managing piping and instrumentation diagrams across the full plant lifecycle. Built for engineering teams working on complex industrial facilities, it connects diagram creation, data management and rules-driven validation into a single, asset-focused platform. Unlike traditional CAD tools, Facets P&ID goes beyond drawing diagrams — it links engineering data directly to the plant asset,
JSON Crack is an online data visualization app capable of visualizing data formats such as JSON, YAML, XML, CSV and more, into interactive graphs. It helps you to understand, analyze and debug your data easily. JSON Crack is designed for developers, data analysts, and anyone who works with structured data formats. It's also helpful for creating documentation and presentations for your teams/customers.
Zen Flowchart is the simplest tool to create flowcharts and other diagrams.
Sketchboard for G Suite is a real-time sketch diagramming and concept tool for software teams.
PVSOL is a dynamic simulation software designed for the planning, design, and optimization of photovoltaic (PV) systems. It caters to a wide range of projects, from small residential installations to large commercial and utility-scale systems. The software enables users to model various PV configurations, including grid-connected and off-grid systems, with or without battery storage and electric vehicle integration. By providing detailed performance analyses and financial assessments, PVSOL assi
A .NET Library for Rapidly Building Interactive Diagrams
ToDiagram is a powerful data editor that transforms JSON, YAML, CSV, and other formats into interactive, easy-to-navigate diagrams. Designed for efficiency, ToDiagram allows you to work seamlessly with complex data structures, making it easier to visualize, explore, and modify data instantly. Whether you’re working with design tokens, configurations, or large datasets, ToDiagram provides an intuitive, visual interface that enhances your workflow without sacrificing flexibility. Start working wit
Diagramming AI is an advanced platform that leverages artificial intelligence to streamline the creation, editing, and management of professional-grade diagrams. By simply describing your vision, the AI generates clear and precise visual representations, eliminating the need for manual adjustments. This tool is designed to enhance productivity for professionals across various fields by providing an intuitive and efficient diagramming experience. Key Features and Functionality: - AI-Powered Aut