Best Data Visualization Tools - Page 9

How Many Data Visualization Tools Products Does G2 Track?

Total Products under this Category: 478

Category Stats (Aug 2026)

  • Average Rating: 4.43/5 The average rating of products in this category, based on all submitted ratings
  • Top Trending Product: Supersimple (+0.89%) - Among all products in this category, Supersimple recorded the largest rating increase compared to last month

Last updated: August 04, 2026

How Does G2 Rank Data Visualization Tools Products?

Why You Can Trust G2's Software Rankings:

  • 30 Analysts and Data Experts
  • 26,100+ Authentic Reviews
  • 478+ Products
  • Unbiased Rankings

G2's software rankings are built on verified user reviews, rigorous moderation, and a consistent research methodology maintained by a team of analysts and data experts. Each product is measured using the same transparent criteria, with no paid placement or vendor influence. While reviews reflect real user experiences, which can be subjective, they offer valuable insight into how software performs in the hands of professionals. Together, these inputs power the G2 Score, a standardized way to compare tools within every category.

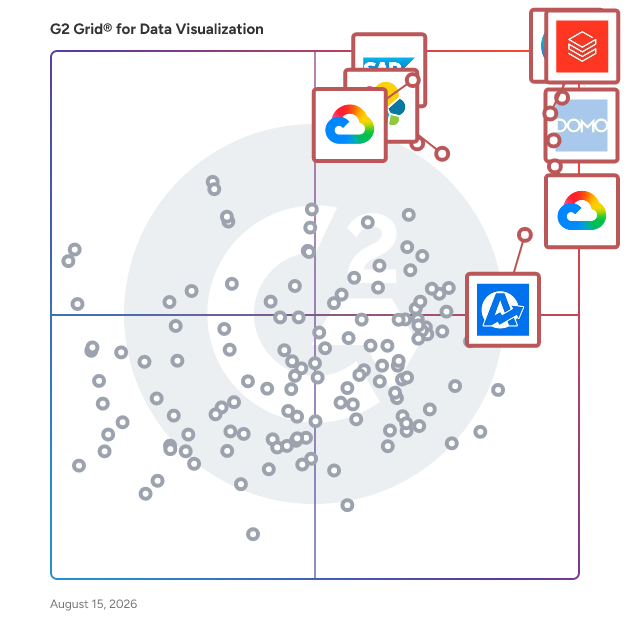
G2 Grid® for Data Visualization Tools

G2 Grid® for Data Visualization Tools plotting products by satisfaction and market presence

Highlighted products: Canva, Databricks, Domo, Looker, Data Studio, Elastic Stack, SAP HANA Cloud, and AgencyAnalytics.

Underlying data: [Grid® JSON](https://www.g2.com/categories/data-visualization-tools/grids.json?focus%5B%5D=canva&focus%5B%5D=databricks&focus%5B%5D=domo&focus%5B%5D=looker&focus%5B%5D=data-studio&focus%5B%5D=elastic-stack&focus%5B%5D=sap-hana-cloud-2025-10-01&focus%5B%5D=agencyanalytics)

Sponsored

Huwise

Huwise is a SaaS data product marketplace developed by a French company based in Paris, with over 15 years of experience. Recognized as a leading European player in data marketplace solutions by independent analyst firms, Huwise powers more than 3,000 data marketplaces across 25 countries. The platform is widely adopted across key industries including Banking & Insurance, Utilities and Energy, Transportation, Retail, Manufacturing and Central & Local Government. Huwise is a leading data product marketplace designed to transform raw data into AI-ready, business-ready data products. Unlike traditional data catalogs that primarily focus on metadata management and data discovery, Huwise actively drives data usage across organizations by converting data into actionable products. The platform is designed for business users, data product owners, data teams, and AI agents, providing a self-service, e-commerce-like experience that makes data more accessible, understandable, and usable across the organization. By enabling secure, governed, and scalable access to trusted data products, Huwise helps Chief Data Officers (CDOs) and Chief Data & AI Officers (CDAIOs) accelerate their data governance strategy, increase data adoption, and maximize the business impact of data and AI initiatives. Targeted at organizations seeking to enhance their data utilization, Huwise stands apart from conventional data platforms such as data lakes and cloud data warehouses. While these technologies are primarily focused on storing and processing large volumes of raw data, Huwise operates on top of the data stack to activate and distribute data. It ensures that data is not only understandable but also governed and directly usable throughout the organization. By complementing existing data catalog solutions, Huwise offers a business-facing access layer that integrates with raw, curated and certified data products, leveraging existing metadata and governance frameworks. The platform is built on data product principles, enabling organizations to publish and manage trusted, ready-to-use data products. Huwise facilitates self-service access to data without the need for technical expertise, ensuring that governance, security, and traceability are maintained across all data usage. Furthermore, it promotes data adoption through collaboration, feedback, and usage analytics, which are essential for driving engagement and maximizing the value of data within the organization. Huwise accelerates AI and analytics use cases by providing high-quality, contextualized data that enhances decision-making processes. Huwise also plays a crucial role in modern data architectures by supporting both the semantic layer and the emerging context layer. The semantic layer standardizes data definitions into business-friendly terms, while the context layer enriches this foundation with usage intelligence, lineage, governance, and real business interactions. This dual-layer approach enables both humans and AI to interpret and trust data accurately, reducing risks associated with misinterpretation or bias. As organizations increasingly adopt data mesh, data product strategies, and AI-driven operations, Huwise offers a modern approach for data sharing that is dedicated to drive data value and enhance business performance. It offers a data marketplace platform that not only organizes data but also activates it to deliver measurable business value. For companies aiming to maximize the potential of their data ecosystem, Huwise provides a future-proof, interoperable layer that bridges storage, governance, and consumption, ultimately accelerating data adoption and AI success at scale.

Visit website

BIRT

An open source technology platform used to create data visualizations and reports that can be embedded into rich client and web applications.

Average Rating: 4.0/5.0

Total Reviews: 27

How Do G2 Users Rate BIRT?

  • Has the product been a good partner in doing business?: 7.5/10 (Category avg: 9.0/10)
  • Steps to Answer: 3.3/10 (Category avg: 8.6/10)

Who Is the Company Behind BIRT?

  • Seller: Eclipse Foundation
  • Year Founded: 2004
  • HQ Location: Brussels, Belgium
  • Twitter: @EclipseFdn
    31,013 Twitter followers
  • LinkedIn® Page: www.linkedin.com
    251 employees on LinkedIn®

Who Uses This Product?

  • Top Industries: Computer Software, Information Technology and Services
  • Company Size: 52% Large, 26% Medium

What Are Recent G2 Reviews of BIRT?

What Are G2 Users Discussing About BIRT?

Datadeck

Datadeck is a data visualization platform that allows you to see all your data on one single platform. Create beautiful dashboards from data sources such as Facebook Ads, MySQL, Excel, and Google Analytics to consolidate and analyze your data all in one place. Save time, improve file sharing security and get your whole team involved with data. Datadeck puts everyone in sync with beautiful dashboards, making your company happier and more productive. Using Datadeck allows teams to collaborate on data analysis, create professional reports, and ultimately save time by having all your data sources in one place. Centralize your data to create powerful reports, dashboards, and keep track of your important metrics. Security: All your data and files are secure with Datadeck. You can select who can access what, give different access permissions to your team, and much more. You can go down all the way to select which IPs can access your dashboard. Collaboration: Allow anyone in your company to get close to data and allow them to use this data to benefit the company. Get your team working together and avoid sending files and more files through email or instant message. Easy to Use: Datadeck doesn’t require any previous data analysis knowledge or any experience with business intelligence platforms. No manual required, you can start using within minutes and learn other tricks as you use the platform. Simply drag and drop field to get beautiful visual representations of your data. Fast Setup: Add data sources with ease and start working with them in less than a minute. Professional Reporting: Datadeck’s dashboards double as professional reports to whatever time frame you might need to act upon - hourly, daily, weekly, monthly - you build it and share it with anyone you would like to give access. Time-Saving: Centralize your data into one place and spend less time logging in and out of apps, switching between apps, and sending files to your colleagues and clients. Have more time with what matters with a well designed and ergonomic tool as Datadeck.

Average Rating: 4.4/5.0

Total Reviews: 10

How Do G2 Users Rate Datadeck?

  • Has the product been a good partner in doing business?: 9.4/10 (Category avg: 9.0/10)
  • Dashboards: 9.4/10 (Category avg: 9.0/10)
  • Steps to Answer: 8.9/10 (Category avg: 8.6/10)
  • Formats: 9.4/10 (Category avg: 8.6/10)

Who Is the Company Behind Datadeck?

  • Seller: Datadeck
  • Year Founded: 2010
  • HQ Location: Shibuya, JP
  • Twitter: @DataDeck
    8 Twitter followers
  • LinkedIn® Page: www.linkedin.com
    117 employees on LinkedIn®

Who Uses This Product?

  • Company Size: 64% Small, 64% Medium

What Are Recent G2 Reviews of Datadeck?

What Are G2 Users Discussing About Datadeck?

Graphitup

Create persuasive graphs, charts, and dashboards from your data. Upload all kinds of data, including Excel files, and easily create professional, on-brand visualizations that inspire action. Pick files directly from Google Drive for real-time updates to all your embedded charts and dashboards.

Average Rating: 4.2/5.0

Total Reviews: 10

How Do G2 Users Rate Graphitup?

  • Has the product been a good partner in doing business?: 10.0/10 (Category avg: 9.0/10)

Who Is the Company Behind Graphitup?

  • Seller: Graphitup
  • Year Founded: 2022
  • HQ Location: Dallas, TX
  • Twitter: @trygraphitup
    6 Twitter followers
  • LinkedIn® Page: www.linkedin.com
    1 employees on LinkedIn®

Who Uses This Product?

  • Company Size: 50% Small, 40% Medium

What Do G2 Reviewers Say About Graphitup?

AI-generated summary from verified user reviews

Pros
  • Users highlight the ease of use of Graphitup, appreciating its user-friendly design and seamless integration.
  • Users love the customization options in Graphitup, allowing personalized templates that enhance productivity and efficiency.
  • Users praise Graphitup for its user-friendly features that transform data into engaging formats and enhance business growth.
  • Users value the time-saving capabilities of Graphitup, enabling faster work with efficient templates and tools.
  • Users love the dynamic visualization features of Excelkits, transforming data into engaging charts and interactive tables.
Cons
  • Users face communication issues in Graphitup, making team collaboration and sharing documents cumbersome and frustrating.
  • Users find complexity in formulas limits usability, making collaboration and access difficult for general users.
  • Users report data inaccuracy due to formula errors, limiting template usability for general users across industries.
  • Users are concerned about data privacy vulnerabilities in Graphitup that could lead to security breaches and data leaks.
  • Users feel the price is too high for Graphitup, wishing it could be more affordable.

What Are Recent G2 Reviews of Graphitup?

KnowledgeHound

KnowledgeHound is a data discovery and visual analytics platform designed to help you create a more agile, customer-driven organization. Import and connect your research into KnowledgeHound to move faster with your data, illuminate hidden insights, and discover trends.

Average Rating: 4.5/5.0

Total Reviews: 32

How Do G2 Users Rate KnowledgeHound?

  • Has the product been a good partner in doing business?: 8.9/10 (Category avg: 9.0/10)
  • Dashboards: 8.9/10 (Category avg: 9.0/10)
  • Steps to Answer: 8.3/10 (Category avg: 8.6/10)
  • Formats: 9.1/10 (Category avg: 8.6/10)

Who Is the Company Behind KnowledgeHound?

  • Seller: Vyzion
  • Year Founded: 2013
  • HQ Location: Chicago, IL
  • Twitter: @knowledge_hound
    293 Twitter followers
  • LinkedIn® Page: www.linkedin.com
    1 employees on LinkedIn®

Who Uses This Product?

  • Top Industries: Accounting
  • Company Size: 55% Small, 33% Medium

What Are Recent G2 Reviews of KnowledgeHound?

What Are G2 Users Discussing About KnowledgeHound?

Data Display Debugger

GNU DDD is a graphical front-end for command-line debuggers such as GDB, DBX, WDB, Ladebug, JDB, XDB, the Perl debugger, the bash debugger bashdb, the GNU Make debugger remake, or the Python debugger pydb. Besides ``usual'' front-end features such as viewing source texts, DDD has become famous through its interactive graphical data display, where data structures are displayed as graphs.

Average Rating: 4.0/5.0

Total Reviews: 11

How Do G2 Users Rate Data Display Debugger?

  • Has the product been a good partner in doing business?: 7.5/10 (Category avg: 9.0/10)
  • Dashboards: 7.9/10 (Category avg: 9.0/10)
  • Steps to Answer: 8.3/10 (Category avg: 8.6/10)
  • Formats: 8.3/10 (Category avg: 8.6/10)

Who Is the Company Behind Data Display Debugger?

Who Uses This Product?

  • Company Size: 58% Small, 25% Large

What Are Recent G2 Reviews of Data Display Debugger?

What Are G2 Users Discussing About Data Display Debugger?

Rich Filters for Jira

What is Rich Filters for Jira Dashboards? Rich Filters for Jira Dashboards is a powerful solution that transforms Jira dashboards into fully interactive, dynamic views. It allows teams to filter, segment, and explore Jira data in real time, enabling multiple perspectives from a single dashboard without duplicating gadgets or rewriting queries. Designed to make dashboards more flexible and accessible, Rich Filters empowers both technical and non-technical users to find the insights they need, faster. Purpose The app simplifies how teams consume and interact with Jira data by adding a dynamic filtering layer on top of existing dashboards. It eliminates the need for multiple static dashboards and complex JQL, making reporting more efficient and scalable. Key Features Dynamic filtering: Filter dashboards by any Jira field, including custom fields, with real-time updates across all gadgets. Multiple views, one dashboard: Create different perspectives (views) for different audiences without duplicating dashboards. Interactive controls: Add dropdowns, buttons, and smart filters so users can explore data without editing queries. Context-aware dashboards: Automatically adapt dashboards based on project, user, team, or other criteria. Easy configuration: Set up powerful filtering logic without technical expertise or complex JQL. Benefits to Users Rich Filters for Jira Dashboards helps teams reduce dashboard sprawl and turn static reports into interactive decision-making tools. Business users gain self-service access to insights, while admins save time maintaining fewer dashboards. Leaders get flexible, real-time visibility across projects and teams, all from a single source of truth. With Rich Filters, organizations can build smarter dashboards that adapt to different needs, empower users to explore data independently, and make Jira reporting more scalable, efficient, and impactful.

Average Rating: 4.6/5.0

Total Reviews: 12

How Do G2 Users Rate Rich Filters for Jira?

  • Has the product been a good partner in doing business?: 7.8/10 (Category avg: 9.0/10)
  • Dashboards: 7.7/10 (Category avg: 9.0/10)
  • Steps to Answer: 9.0/10 (Category avg: 8.6/10)
  • Formats: 7.9/10 (Category avg: 8.6/10)

Who Is the Company Behind Rich Filters for Jira?

  • Seller: Appfire
  • Company Website:
  • Year Founded: 2005
  • HQ Location: Boston, Massachusetts
  • Twitter: @Appfire
    1,632 Twitter followers
  • LinkedIn® Page: www.linkedin.com
    745 employees on LinkedIn®

Who Uses This Product?

  • Company Size: 58% Small, 25% Large

What Do G2 Reviewers Say About Rich Filters for Jira?

AI-generated summary from verified user reviews

Pros
  • Users appreciate the user-friendly interface of Rich Filters for Jira, simplifying the creation and management of complex filters.
  • Users value the collaborative sharing capabilities of Rich Filters, enhancing teamwork and project transparency.
  • Users value the customization of dynamic filter names and appreciate the insights from Rich Filter Usage Data.
  • Users value the easy creation of custom dashboards in Rich Filters for Jira, enabling efficient data analysis.
  • Users value the easy integrations of Rich Filters for Jira, enhancing collaboration and simplifying project management.
Cons
  • Users find the learning difficulty of Rich Filters for Jira frustrating, as mastering JQL takes significant time and effort.
  • Users find the cost prohibitive for smaller teams, limiting accessibility despite its benefits.
  • Users find the learning curve steep, requiring significant time to become proficient with Rich Filters for Jira.
  • Users find the poor visualization limitations hinder effective decision-making and fail to meet diverse needs.
  • Users note the slow performance of Rich Filters, hindering timely decision-making during critical reporting tasks.

What Are Recent G2 Reviews of Rich Filters for Jira?

Insight BI

With Insight BI you can combine data from different sources in your business, to view it in colorful dashboards and reports. Reporting can also be scheduled to distribute to a list of recipients, removing the need to log in and draw reports.

Average Rating: 4.3/5.0

Total Reviews: 28

How Do G2 Users Rate Insight BI?

  • Has the product been a good partner in doing business?: 7.7/10 (Category avg: 9.0/10)
  • Dashboards: 9.5/10 (Category avg: 9.0/10)
  • Steps to Answer: 9.0/10 (Category avg: 8.6/10)
  • Formats: 8.6/10 (Category avg: 8.6/10)

Who Is the Company Behind Insight BI?

Who Uses This Product?

  • Company Size: 43% Medium, 32% Small

What Are Recent G2 Reviews of Insight BI?

9 Spokes

With a smart dashboard from 9 Spokes, you can see your business more clearly - so it’s easier to make the big decisions. Simply connect your business apps to the smart dashboard, then see your business in a whole new light. Key metrics across essential areas of your business are displayed in one place, revealing exactly how it's performing. With these simple insights, you’ll find it easier to make the right calls to manage or grow your business. Joining 9 Spokes and getting a smart dashboard for your business is free. Get up and running in just minutes by connecting your existing business software. Or if you’re unsure what’s right for you, you can add recommended and accredited apps for your industry. Visit 9spokes.com now and get the powerful insights you need to see your business more clearly.

Average Rating: 4.0/5.0

Total Reviews: 12

How Do G2 Users Rate 9 Spokes?

  • Has the product been a good partner in doing business?: 8.3/10 (Category avg: 9.0/10)

Who Is the Company Behind 9 Spokes?

  • Seller: 9 Spokes
  • Year Founded: 2012
  • HQ Location: Auckland, NZ
  • LinkedIn® Page: www.linkedin.com
    50 employees on LinkedIn®
  • Ownership: ASX:9SP
  • Total Revenue (USD mm): $7

Who Uses This Product?

  • Company Size: 58% Small, 25% Large

What Are Recent G2 Reviews of 9 Spokes?

What Are G2 Users Discussing About 9 Spokes?

ChartURL

ChartURL offers a platform to add rich, data-driven charts to your web apps, mobile apps, and emails.

Average Rating: 4.1/5.0

Total Reviews: 13

How Do G2 Users Rate ChartURL?

  • Has the product been a good partner in doing business?: 10.0/10 (Category avg: 9.0/10)
  • Dashboards: 9.0/10 (Category avg: 9.0/10)
  • Steps to Answer: 7.7/10 (Category avg: 8.6/10)
  • Formats: 7.5/10 (Category avg: 8.6/10)

Who Is the Company Behind ChartURL?

  • Seller: ChartURL
  • HQ Location: N/A
  • Twitter: @ChartUrl
    71 Twitter followers
  • LinkedIn® Page: www.linkedin.com
    1 employees on LinkedIn®

Who Uses This Product?

  • Company Size: 36% Large, 36% Medium

What Do G2 Reviewers Say About ChartURL?

AI-generated summary from verified user reviews

Pros
  • Users love the visualization capabilities of ChartURL, enhancing report clarity and transforming data into engaging visuals.
  • Users appreciate the ease of use of ChartURL, finding it simple and beginner-friendly for creating visual data.
  • Users appreciate the variety of tools offered by ChartURL, enabling customizable and visually appealing data representations.
  • Users find ChartURL's charting feature invaluable for transforming complex reports into easily understandable images.
  • Users appreciate the easy and clutter-free link sharing with ChatURL, which offers helpful previews for quick access.
Cons
  • Users find the limited chart options and lack of customization restricts their ability to effectively present data.
  • Users encounter data inaccuracies that complicate understanding and implementation, especially with big datasets and manual uploads.
  • Users express frustration over the limited customization options for link appearance, impacting overall satisfaction with ChartURL.
  • Users find ChartURL less user-friendly than expected, leading to a more complicated experience than anticipated.
  • Users experience complex usage, as data confusion leads to incorrect information, complicating implementation in their work.

What Are Recent G2 Reviews of ChartURL?

What Are G2 Users Discussing About ChartURL?

Inzata

Inzata is a data analytics platform for integrating, exploring, and analyzing data of any kind, from any source, at massive scale with impeccable speed. Go from raw data to actionable insights in under 30 minutes! Powerful Artificial Intelligence-based data modeling and a patented analytics engine help users quickly load, blend, prep and model raw and unstructured data into powerful enterprise data models, actionable real-time analytics, and engaging visualizations. We help people explore and discover the value of their data, in record time. We pride ourselves on our ability to build 360° views of any company's data, across a multitude of systems, in minutes. Inzata's experience provides the future of Big Data analysis: extremely fast, accurate, and machine-accelerated.

Average Rating: 4.7/5.0

Total Reviews: 15

How Do G2 Users Rate Inzata?

  • Has the product been a good partner in doing business?: 9.4/10 (Category avg: 9.0/10)
  • Dashboards: 10.0/10 (Category avg: 9.0/10)
  • Steps to Answer: 8.3/10 (Category avg: 8.6/10)
  • Formats: 9.2/10 (Category avg: 8.6/10)

Who Is the Company Behind Inzata?

  • Seller: Inzata
  • Year Founded: 2016
  • HQ Location: Tampa, Florida
  • Twitter: @InzataAnalytics
    310 Twitter followers
  • LinkedIn® Page: www.linkedin.com
    23 employees on LinkedIn®

Who Uses This Product?

  • Company Size: 67% Small, 20% Medium

What Are Recent G2 Reviews of Inzata?

What Are G2 Users Discussing About Inzata?

EspressChart

EspressChart is a comprehensive Java-based charting solution designed to empower developers and organizations to create dynamic, interactive charts for web and desktop applications. With its robust API and intuitive Chart Designer interface, users can effortlessly generate highly customizable 2D and 3D charts, enhancing data visualization and analysis capabilities. Key Features and Functionality: - Versatile Chart Types: Supports a wide array of 2D and 3D chart formats, including line, bar, pie, and Gantt charts, catering to diverse data representation needs. - Interactive Chart Designer: Provides a visual design tool that allows users to create and edit charts without extensive programming knowledge. - Robust Java API: Offers a comprehensive API for seamless integration into Java applications, applets, servlets, and JSPs. - Platform Independence: Being pure Java, EspressChart operates across various platforms supporting Java, ensuring broad compatibility. - Advanced Statistical Features: Includes options for trend lines, gradients, and Top N/Bottom N data display, enhancing analytical capabilities. - Data Integration: Facilitates connection to JDBC/ODBC data sources, enabling dynamic data retrieval and real-time chart updates. Primary Value and User Solutions: EspressChart addresses the need for effective data visualization by providing a powerful yet user-friendly toolkit for creating interactive charts. It simplifies the process of integrating dynamic charts into applications, reducing development time and effort. By offering a wide range of customizable chart types and advanced features, EspressChart enables users to present complex data in an accessible and visually appealing manner, thereby enhancing decision-making processes and business intelligence initiatives.

Average Rating: 4.4/5.0

Total Reviews: 12

How Do G2 Users Rate EspressChart?

  • Has the product been a good partner in doing business?: 9.4/10 (Category avg: 9.0/10)
  • Dashboards: 8.1/10 (Category avg: 9.0/10)
  • Steps to Answer: 9.2/10 (Category avg: 8.6/10)
  • Formats: 8.1/10 (Category avg: 8.6/10)

Who Is the Company Behind EspressChart?

  • Seller: Quadbase Systems
  • Year Founded: 1988
  • HQ Location: Santa Clara
  • Twitter: @quadbase
    11 Twitter followers
  • LinkedIn® Page: www.linkedin.com
    6 employees on LinkedIn®

Who Uses This Product?

  • Company Size: 58% Small, 25% Large

What Are Recent G2 Reviews of EspressChart?

Graphviz

Graphviz is an open-source graph visualization software developed by AT&T Labs Research. It enables users to represent structural information as diagrams of abstract graphs and networks. Key Features and Functionality: - Graph Description Language: Utilizes the DOT language, a simple text-based syntax for defining nodes and edges in a graph. - Layout Engines: Offers multiple layout engines tailored for different types of graphs: - dot: Produces hierarchical or layered drawings of directed graphs. - neato: Implements "spring model" layouts suitable for undirected graphs. - fdp: Similar to neato but focuses on minimizing forces instead of energy. - sfdp: A multiscale version of fdp designed for large undirected graphs. - twopi: Generates radial layouts, placing nodes on concentric circles based on their distance from a root node. - circo: Creates circular layouts, ideal for diagrams with multiple cyclic structures. - Output Formats: Supports a variety of output formats, including PostScript, PDF, SVG, PNG, and more, facilitating integration with other tools and platforms. - Customization: Provides options for colors, fonts, line styles, and custom shapes, allowing users to tailor the appearance of their graphs. Primary Value and User Solutions: Graphviz addresses the need for clear and efficient visualization of complex relationships and structures. By automating the layout process, it saves users significant time and effort compared to manual diagramming. Its versatility makes it applicable in various fields, including networking, bioinformatics, software engineering, database design, and machine learning. By providing a straightforward way to create and visualize graphs, Graphviz enhances understanding and communication of complex data structures, making it an invaluable tool for professionals and researchers dealing with intricate systems.

Average Rating: 4.0/5.0

Total Reviews: 14

How Do G2 Users Rate Graphviz?

  • Dashboards: 8.1/10 (Category avg: 9.0/10)
  • Steps to Answer: 7.8/10 (Category avg: 8.6/10)
  • Formats: 8.0/10 (Category avg: 8.6/10)

Who Is the Company Behind Graphviz?

Who Uses This Product?

  • Company Size: 71% Small, 21% Medium

What Do G2 Reviewers Say About Graphviz?

AI-generated summary from verified user reviews

Pros
  • Users appreciate the ease of use of Graphviz, finding it convenient for generating clear graphics effortlessly.
  • Users love the automatic graphics generation of Graphviz, enjoying clear structures and easy creation from text code.
  • Users value the affordability of Graphviz, benefiting from its free and stable graph creation capabilities for various projects.
  • Users appreciate the automatic graphic generation of Graphviz, finding it clear and well-structured with simple text code.
  • Users find the easy creation of graphs from DOT files in Graphviz incredibly convenient and hassle-free.
Cons
  • Users find the learning curve steep, especially with mastering syntax and the command line interface.
  • Users find the complex usage of Graphviz challenging, particularly due to the steep learning curve of the command line interface.
  • Users find the command line interface confusing, requiring time to learn and understand the DOT language for complex graphs.
  • Users struggle with limited formatting options, finding it challenging to achieve desired results on first attempts.

What Are Recent G2 Reviews of Graphviz?

MyDash

DASH IS A LIGHTWEIGHT, FULL-SERVICE DASHBOARDING BUSINESS HELPING TOP ORGANIZATIONS MAKE FASTER DECISIONS BY MAKING CRITICAL DATA MORE ACCESSIBLE THAN EVER. Free Dashboard, Connectors & Visualization Business Intelligence is essential, and expensive. But it doesn't have to be. We've built a tool, major platform connectors, and a best-in-class visualization library. Our service, the only thing we get paid for, is setting it up for our partners. Our mission: soft costs and subscriptions shouldn't prevent leaders from making good business decisions.

Average Rating: 4.4/5.0

Total Reviews: 15

How Do G2 Users Rate MyDash?

  • Has the product been a good partner in doing business?: 8.3/10 (Category avg: 9.0/10)
  • Dashboards: 8.6/10 (Category avg: 9.0/10)
  • Steps to Answer: 9.0/10 (Category avg: 8.6/10)
  • Formats: 8.3/10 (Category avg: 8.6/10)

Who Is the Company Behind MyDash?

  • Seller: MyDash
  • HQ Location: Boston, Massachusetts
  • Twitter: @AiMydash
    22 Twitter followers
  • LinkedIn® Page: www.linkedin.com
    3 employees on LinkedIn®

Who Uses This Product?

  • Company Size: 67% Medium, 27% Small

What Are Recent G2 Reviews of MyDash?

Syncrofy

Syncrofy for EDI & IT professionals is the premier way to simplify your data. It enables you to visualize data, discover problems before they occur, and collaborate seamlessly with internal teams and partners. Syncrofy is everything you need to make your data actionable and elevate your business, without the need to rely on your IT team or third party provider to get you the answers to your questions. You have full control and access to the raw EDI data. Syncrofy for Supply Chain provides you with real-time visibility to break down barriers across your supply chain. You’ll have complete visibility across your network. SSC’s advanced real-time analytics and insights help you identify challenges and prioritize and solve them before problems occur—empowering you to eliminate costly fines and fees, prevent late payments and late shipments, and realize revenue faster.

Average Rating: 4.4/5.0

Total Reviews: 30

How Do G2 Users Rate Syncrofy?

  • Has the product been a good partner in doing business?: 10.0/10 (Category avg: 9.0/10)
  • Dashboards: 7.8/10 (Category avg: 9.0/10)
  • Steps to Answer: 7.5/10 (Category avg: 8.6/10)
  • Formats: 7.8/10 (Category avg: 8.6/10)

Who Is the Company Behind Syncrofy?

  • Seller: Coenterprise
  • Year Founded: 2010
  • HQ Location: New York, New York
  • Twitter: @CoEnterprise
    840 Twitter followers
  • LinkedIn® Page: www.linkedin.com
    82 employees on LinkedIn®

Who Uses This Product?

  • Top Industries: Automotive, Retail
  • Company Size: 53% Large, 33% Medium

What Are Recent G2 Reviews of Syncrofy?

What Are G2 Users Discussing About Syncrofy?

Datawiz BI

Datawiz is retail analytics software for mid-size retail chains that turns store data into measurable business outcomes. Retail teams use Datawiz to find the root cause of sales drops, catch inventory problems before they cost money, prepare category reviews in minutes instead of days, and track store execution against business targets in real time. Built exclusively for retail, the platform combines deep knowledge of retail KPIs and operational processes with 60+ ready-to-use reports and AI-powered guidance from Wizora, so teams spend time acting on insights, not building them. Processing millions of transactions daily across multiple markets, Datawiz helps retailers scale confidently while making faster, data-driven decisions. You can add custom metrics, create tailored formulas for analytics, and visualize results through dashboards. The system allows monitoring deviations and managing users. The Store Manager mobile app provides access to analytics on the go. Additionally, you can earn up to 2.5% extra revenue through data monetization. DATAWIZ BI – one of 4 critical solutions and a part of the analytical platform Datawiz BES (Business Effectiveness Solution)

Average Rating: 4.0/5.0

Total Reviews: 13

How Do G2 Users Rate Datawiz BI?

  • Has the product been a good partner in doing business?: 5.8/10 (Category avg: 9.0/10)
  • Dashboards: 8.0/10 (Category avg: 9.0/10)
  • Steps to Answer: 8.7/10 (Category avg: 8.6/10)
  • Formats: 8.3/10 (Category avg: 8.6/10)

Who Is the Company Behind Datawiz BI?

  • Seller: Datawiz
  • Year Founded: 2016
  • HQ Location: Wilmington, DE
  • LinkedIn® Page: www.linkedin.com
    42 employees on LinkedIn®

Who Uses This Product?

  • Top Industries: Information Technology and Services
  • Company Size: 69% Medium, 23% Large

What Do G2 Reviewers Say About Datawiz BI?

AI-generated summary from verified user reviews

Pros
  • Users commend the user-friendly interface of Datawiz BI, enabling efficient data analysis and streamlined decision-making.
  • Users value the strong integration capabilities of Datawiz BI, significantly improving efficiency in data-driven decision-making.
  • Users appreciate the strong integration capabilities of Datawiz BI, enhancing efficiency in data-driven decision making across teams.
  • Users praise the responsive and helpful customer support of Datawiz BI, enhancing their overall experience and satisfaction.
  • Users value the customizable dashboards of Datawiz BI, significantly enhancing their decision-making and operational efficiency.
Cons
  • Users find Datawiz BI to be expensive, with pricing higher than competitors and not scaling well for larger datasets.
  • Users experience slow performance with Datawiz BI, including lags and unresponsive states during report generation.
  • Users find compatibility issues with Datawiz BI, limiting customization and integration with other systems for advanced analytics.
  • Users experience limitations in storage with Datawiz BI, impacting API use and scalability during high-demand periods.
  • Users find limited customization options in Datawiz BI, making advanced analytics and tailored adjustments challenging.

What Are Recent G2 Reviews of Datawiz BI?

Bijou Barry
BB
Researched and written by Bijou Barry
Updated June 24, 2026