Best Analytics Platforms for Medium-Sized Businesses - Page 5

How Many Analytics Platforms Products Does G2 Track?

Total Products under this Category: 607

Category Stats (Oct 2026)

  • Average Rating: 4.52/5 (โ†‘0.01 vs Sep 2026) The average rating of products in this category, based on all submitted ratings
  • Top Trending Product: inzicht (+3.71%) - Among all products in this category, inzicht recorded the largest rating increase compared to last month

Last updated: October 13, 2026

How Does G2 Rank Analytics Platforms Products?

Why You Can Trust G2's Software Rankings:

  • 30 Analysts and Data Experts
  • 29,800+ Authentic Reviews
  • 607+ Products
  • Unbiased Rankings

G2's software rankings are built on verified user reviews, rigorous moderation, and a consistent research methodology maintained by a team of analysts and data experts. Each product is measured using the same transparent criteria, with no paid placement or vendor influence. While reviews reflect real user experiences, which can be subjective, they offer valuable insight into how software performs in the hands of professionals. Together, these inputs power the G2 Score, a standardized way to compare tools within every category.

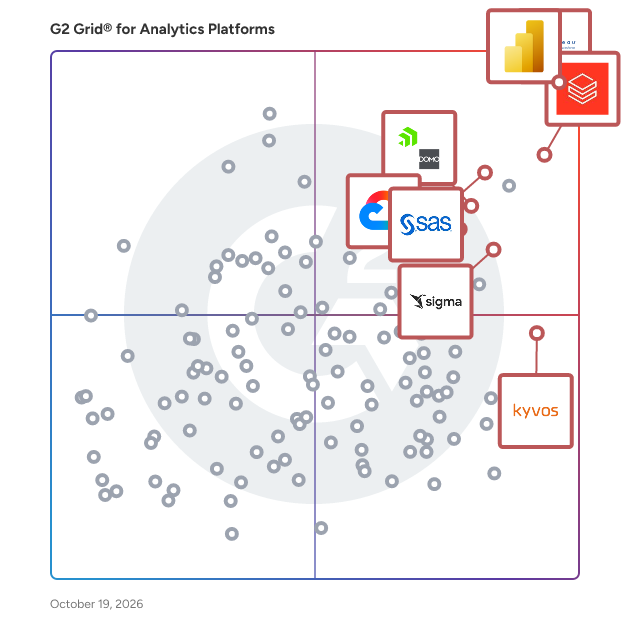
G2 Gridยฎ for Analytics Platforms

G2 Gridยฎ for Analytics Platforms plotting products by satisfaction and market presence

Highlighted products: Tableau, Microsoft Power BI, Databricks, Domo, Sigma, Looker, SAS Viya, and Kyvos Semantic Layer.

Underlying data: [Gridยฎ JSON](https://www.g2.com/categories/analytics-platforms/grids.json?focus%5B%5D=tableau&focus%5B%5D=microsoft-microsoft-power-bi&focus%5B%5D=databricks&focus%5B%5D=domo&focus%5B%5D=sigma-computing-sigma&focus%5B%5D=looker&focus%5B%5D=sas-sas-viya&focus%5B%5D=kyvos-semantic-layer&segment=mid-market)

Digital Hive

Digital Hive is an Analytics Catalog that curates and creates a single place for users to consume and find the analytics they need. Not a revisualization, we don't touch your data or recreate your security and you customize the consumption experience to wow your users. With Digital Hive you'll see greater value from your analytics investment by increased adoption, improved data literacy and reduced duplication of content.

Average Rating: 4.5/5.0

Total Reviews: 24

How Do G2 Users Rate Digital Hive?

  • Has the product been a good partner in doing business?: 9.4/10 (Category avg: 9.2/10)
  • Steps to Answer: 8.6/10 (Category avg: 8.4/10)
  • Reports Interface: 8.7/10 (Category avg: 8.8/10)
  • Calculated Fields: 8.2/10 (Category avg: 8.5/10)

Who Is the Company Behind Digital Hive?

Who Uses This Product?

  • Top Industries: Marketing and Advertising
  • Company Size: 48% Medium, 36% Small

What Do G2 Reviewers Say About Digital Hive?

AI-generated summary from verified user reviews

Pros
  • Users value the ease of use of Digital Hive, appreciating its user-friendly interface for managing multiple analytics tools.
  • Users appreciate the user-friendly interface of Digital Hive, making analytics simpler and more accessible for daily use.
  • Users appreciate the seamless integration offered by Digital Hive, simplifying connections between various BI and data tools.
  • Users value the easy collaboration with Digital Hive, enhancing teamwork and streamlining data processes for faster insights.
  • Users value the excellent analytical tools in Digital Hive, enhancing their business analysis and decision-making processes.
Cons
  • Users find the pricing too high for Digital Hive, leading to concerns about value and affordability.
  • Users find the integration complexity of Digital Hive challenging, especially with varied setups and navigating support issues.
  • Users report encountering occasional bugs that hinder performance and suggest a need for better management.
  • Users find the learning curve steep, requiring tech savvy individuals for effective use and navigation of Digital Hive.
  • Users are concerned about the lack of Row Level Security (RLS), which hinders their ability to manage data access effectively.

What Are Recent G2 Reviews of Digital Hive?

Logility Solutions

Logility is a market-leading provider of AI-first supply chain management solutions engineered to help organizations build sustainable digital supply chains that improve peopleโ€™s lives and the world we live in. The companyโ€™s approach is designed to reimagine supply chain planning by shifting away from traditional โ€œwhat happenedโ€ processes to an AI-driven strategy that combines the power of humans and machines to predict and be ready for whatโ€™s coming. Logilityโ€™s fully integrated, end-to-end platform helps clients know faster, turn uncertainty into opportunity, and transform the supply chain from a cost center to an engine for growth.

Average Rating: 4.2/5.0

Total Reviews: 123

How Do G2 Users Rate Logility Solutions?

  • Has the product been a good partner in doing business?: 8.5/10 (Category avg: 9.2/10)
  • Steps to Answer: 8.3/10 (Category avg: 8.4/10)
  • Reports Interface: 8.8/10 (Category avg: 8.8/10)
  • Calculated Fields: 8.6/10 (Category avg: 8.5/10)

Who Is the Company Behind Logility Solutions?

  • Seller: Aptean
  • Company Website:
  • Year Founded: 2012
  • HQ Location: Alpharetta, Georgia
  • Twitter: @Aptean
    1,620 Twitter followers
  • LinkedInยฎ Page: www.linkedin.com
    3,789 employees on LinkedInยฎ

Who Uses This Product?

  • Top Industries: Consumer Goods, Food & Beverages
  • Company Size: 54% Medium, 32% Large

What Are Recent G2 Reviews of Logility Solutions?

What Are G2 Users Discussing About Logility Solutions?

Pentaho

Pentaho is a modular, enterprise-grade platform that makes it easy to manage complex dataโ€”on-premises, in the cloud, or in hybrid environments. Whether structured or unstructured, your data becomes a trusted asset that teams can use to operate with confidence, agility, and control.

Average Rating: 4.1/5.0

Total Reviews: 48

How Do G2 Users Rate Pentaho?

  • Has the product been a good partner in doing business?: 6.9/10 (Category avg: 9.2/10)
  • Steps to Answer: 7.9/10 (Category avg: 8.4/10)
  • Reports Interface: 7.7/10 (Category avg: 8.8/10)
  • Calculated Fields: 7.6/10 (Category avg: 8.5/10)

Who Is the Company Behind Pentaho?

  • Seller: Pentaho
  • Year Founded: 2004
  • HQ Location: Santa Clara, CA
  • LinkedInยฎ Page: www.linkedin.com
    159 employees on LinkedInยฎ

Who Uses This Product?

  • Top Industries: Information Technology and Services, Internet
  • Company Size: 48% Medium, 30% Large

What Are Recent G2 Reviews of Pentaho?

AI can help you find the answers. G2 helps you trust them.

Connect G2 to Claude or ChatGPT for answers grounded in G2's trusted reviews, comparisons, and pricing from real user insights.

How it works

ibi WebFOCUS

The ibi WebFOCUSยฎ platform is an enterprise business intelligence and analytics solution equipped with data management, visual discovery, predictive analytics, and powerful visualizations. Combining these capabilities and data science in one unified platform, the WebFOCUS solution helps make data-driven decisions across the enterprise providing reports, dashboards, and customer-facing applications at scale.

Average Rating: 4.4/5.0

Total Reviews: 149

How Do G2 Users Rate ibi WebFOCUS?

  • Has the product been a good partner in doing business?: 8.9/10 (Category avg: 9.2/10)
  • Steps to Answer: 8.0/10 (Category avg: 8.4/10)
  • Reports Interface: 8.7/10 (Category avg: 8.8/10)
  • Calculated Fields: 8.4/10 (Category avg: 8.5/10)

Who Is the Company Behind ibi WebFOCUS?

  • Seller: ibi
  • Year Founded: 1975
  • HQ Location: Fort Lauderdale, FL
  • Twitter: @infobldrs
    32,864 Twitter followers
  • LinkedInยฎ Page: www.linkedin.com
    890 employees on LinkedInยฎ
  • Phone: 212-736-4433

Who Uses This Product?

  • Top Industries: Information Technology and Services, Government Administration
  • Company Size: 57% Large, 32% Medium

What Are Recent G2 Reviews of ibi WebFOCUS?

What Are G2 Users Discussing About ibi WebFOCUS?

Cube

Cube is the agentic analytics platform โ€” built on a semantic layer. Cube is the AI-native generation of business intelligence. It's one platform for two use cases: internal BI, where data teams and business users analyze their own company's data, and embedded analytics, where software companies ship analytics inside their own products. The same governed semantic layer powers both. What makes AI answers trustworthy in production is the semantic layer underneath them. Cube was built around the semantic layer from day one rather than retrofitting one onto a dashboard- or notebook-first tool. The data team's governed metric definitions stay intact while AI constructs ad-hoc calculations on top of them โ€” so you get governance and flexibility at the same time, not one at the expense of the other. That's why teams like Brex chose Cube to power AI-driven analytics at production scale. With Cube, data teams can: Model metrics and business definitions once, in a SQL-first semantic layer, and serve them consistently to every downstream consumer โ€” AI agents, BI, spreadsheets, and embedded apps. Let business users ask questions in natural language through Analytics Chat, with answers grounded in the governed model instead of guessed from raw tables. Bring analytics to where people already work โ€” Slack, and any MCP-compatible agent like Claude or ChatGPT via the Cube MCP server. Embed analytics in customer-facing products with multi-tenancy, row-level security, and query performance under load โ€” choosing from a chat API, drop-in iframes, embedded creator mode, or data APIs. Apply software engineering best practices to analytics: version control with Git, CI/CD, isolated environments, and pre-aggregation caching for fast queries and lower warehouse spend. Cube Core, the open-source semantic layer at its foundation, has years of production use across a large developer community โ€” battle-tested infrastructure that commercial-only tools can't match. Cube sits on top of your cloud data warehouse (Snowflake, BigQuery, Redshift, Databricks); it doesn't replace it.

Average Rating: 4.6/5.0

Total Reviews: 27

How Do G2 Users Rate Cube?

  • Has the product been a good partner in doing business?: 9.7/10 (Category avg: 9.2/10)
  • Steps to Answer: 8.9/10 (Category avg: 8.4/10)
  • Reports Interface: 9.0/10 (Category avg: 8.8/10)
  • Calculated Fields: 8.9/10 (Category avg: 8.5/10)

Who Is the Company Behind Cube?

  • Seller: Cube
  • Company Website:
  • Year Founded: 2019
  • HQ Location: San Francisco, CA
  • Twitter: @the_cube_dev
    2,215 Twitter followers
  • LinkedInยฎ Page: www.linkedin.com
    53 employees on LinkedInยฎ

Who Uses This Product?

  • Top Industries: Computer Software
  • Company Size: 52% Small, 41% Medium

What Do G2 Reviewers Say About Cube?

AI-generated summary from verified user reviews

Pros
  • Users find Cube's ease of use remarkable, simplifying development and maintenance for small teams without DevOps support.
  • Users value the customization options in Cube, enhancing flexibility for embedded analytics in applications.
  • Users value the powerful BI capabilities of Cube, facilitating complex metrics and seamless data access across platforms.
  • Users appreciate the fast and proactive customer support of Cube, enhancing their overall experience significantly.
  • Users value the flexibility of CubeJS, enabling effortless integration and customization for diverse data applications.
Cons
  • Users find Cube's features lacking completeness, particularly with integration, metrics creation, and data visualization capabilities.
  • Users report experiencing significant bugs and confusing documentation that complicate using Cube effectively and reliably.
  • Users find data integration challenging due to issues with BI tools and complicated pre-aggregation management.
  • Users find Cube's features limited, desiring improved documentation, SDK support, and enhanced analytical capabilities.
  • Users often encounter software bugs that complicate functionality and make integration challenging with Cube.

What Are Recent G2 Reviews of Cube?

Infor Birst

Birst is a native cloud business intelligence (BI) and business analytics platform that helps organizations understand and optimize complex processes in less time than traditional BI solutions. Built with patented automation and machine learning technologies, Birstโ€™s Data-as-a-Service approach connects teams and applications across the enterprise via a trusted network of analytics and insights to inform smarter decisions. This unique approach helps leading organizations leverage all their siloed and diverse data sources and extract insights to improve workforce productivity, asset optimization, process efficiencies, and customer satisfactionโ€”often in 90 days or less.

Average Rating: 4.0/5.0

Total Reviews: 84

How Do G2 Users Rate Infor Birst?

  • Has the product been a good partner in doing business?: 8.3/10 (Category avg: 9.2/10)
  • Steps to Answer: 8.3/10 (Category avg: 8.4/10)
  • Reports Interface: 8.3/10 (Category avg: 8.8/10)
  • Calculated Fields: 8.3/10 (Category avg: 8.5/10)

Who Is the Company Behind Infor Birst?

  • Seller: Infor
  • Year Founded: 2002
  • HQ Location: New York
  • Twitter: @Infor
    18,472 Twitter followers
  • LinkedInยฎ Page: www.linkedin.com
    22,165 employees on LinkedInยฎ
  • Phone: 800-260-2640

Who Uses This Product?

  • Top Industries: Information Technology and Services, Computer Software
  • Company Size: 44% Medium, 34% Large

What Are Recent G2 Reviews of Infor Birst?

What Are G2 Users Discussing About Infor Birst?

panintelligence

Expand ARR and accelerate your product roadmap with secure, Generative Business Intelligence (GenBI). At Panintelligence, we bring over 10 years of expertise in helping 400+ global customers unlock deeper insights, reduce technical debt, and drive data-driven growth. Our platform seamlessly integrates with your existing data infrastructure, providing your users with an intuitive, immersive experience. Low Code for Developers: We minimize development effort, allowing your team to focus on innovation and accelerate your roadmap. No Code for Users: We empower users to explore data independently, leveraging Generative BI to surface insights without technical expertise. By embedding Panintelligence, you enable self-service analytics while future-proofing your platform. Our partnership-driven approach ensures your business stays ahead with secure, scalable, and cutting-edge GenBI. Unlock the full potential of your data with Panintelligence โ€“ the Generative BI leader for organizations worldwide.

Average Rating: 4.4/5.0

Total Reviews: 49

How Do G2 Users Rate panintelligence?

  • Has the product been a good partner in doing business?: 9.4/10 (Category avg: 9.2/10)
  • Steps to Answer: 8.6/10 (Category avg: 8.4/10)
  • Reports Interface: 8.2/10 (Category avg: 8.8/10)
  • Calculated Fields: 8.8/10 (Category avg: 8.5/10)

Who Is the Company Behind panintelligence?

  • Seller: Panintelligence
  • Company Website:
  • Year Founded: 2014
  • HQ Location: Leeds
  • Twitter: @panintelligence
    2,056 Twitter followers
  • LinkedInยฎ Page: www.linkedin.com
    34 employees on LinkedInยฎ

Who Uses This Product?

  • Top Industries: Computer Software, Information Technology and Services
  • Company Size: 43% Medium, 39% Small

What Do G2 Reviewers Say About panintelligence?

AI-generated summary from verified user reviews

Pros
  • Users commend the exceptional customer support from Panintelligence, enhancing their overall experience and investment effectiveness.
  • Users value the dashboard customization of panintelligence, allowing tailored setups for diverse needs and layouts.
  • Users value the ease of use of Panintelligence, appreciating its flexibility and seamless integration with existing systems.
  • Users appreciate the flexible data visualization of Panintelligence, enabling easy integration and customization for their needs.
  • Users value the user-friendly analytics of Panintelligence, enabling quick insights and efficient data-driven decision-making.
Cons
  • Users find the limited chart functionality of Panintelligence restricts their ability to customize visual elements effectively.
  • Users find the limited customization options of Panintelligence frustrating, hindering their ability to personalize visual elements.
  • Users find the limited visualization in panintelligence restricts interactivity and customization, impacting their overall experience.
  • Users express dissatisfaction with the missing features in Panintelligence, particularly in customization and advanced capabilities.
  • Users find the poor UI of Panintelligence limits customization options, making the platform feel overwhelming and less user-friendly.

What Are Recent G2 Reviews of panintelligence?

What Are G2 Users Discussing About panintelligence?

Bold Reports

Bold Reports by Syncfusion is a reporting platform for building, migrating, and embedding pixel-perfect, print-ready (paginated) reports. It works natively with RDL and RDLC, the report formats used by SQL Server Reporting Services (SSRS), so teams can open existing SSRS reports without rebuilding them. The Crystal Report to SSRS Converter turns Crystal Reports files into RDL with reduced manual effort, and Bold Reports experts help with migration at no extra cost. Developers embed the Web Report Viewer and Web Report Designer in web and SaaS apps using SDKs for JavaScript, Angular, React, Blazor, and ASP.NET Core, plus REST APIs. White-labeling and multi-tenant support are built in. Business users can build and share their own reports in a self-service, drag-and-drop designer with 40+ visualizations. Reports can be scheduled and exported to PDF, Excel, Word, PowerPoint, CSV, XML, and HTML. Bold Reports has 25+ data connectors, including Snowflake and Redshift, and includes Bold Data Hub, the built-in ETL tool that extracts, transforms, and loads data for reporting. Pricing is based on how you deploy, not how many people use it: there are no per-user or per-developer fees, and every edition includes the full platform. It runs in the cloud, in a managed private cloud, or on your own Windows, Linux, Docker, or Kubernetes servers, including air-gapped environments. The 30-day free trial requires no credit card and comes with a 30-day money-back guarantee. Bold Reports is built for software vendors that embed invoices, statements, and operational reports in their products, IT teams moving off SSRS or Crystal Reports, and regulated organizations that need reports to stay on their own servers. It is developed by Syncfusion, a software company founded in 2001.

Average Rating: 4.1/5.0

Total Reviews: 58

How Do G2 Users Rate Bold Reports?

  • Has the product been a good partner in doing business?: 8.7/10 (Category avg: 9.2/10)
  • Steps to Answer: 7.5/10 (Category avg: 8.4/10)
  • Reports Interface: 8.3/10 (Category avg: 8.8/10)
  • Calculated Fields: 8.2/10 (Category avg: 8.5/10)

Who Is the Company Behind Bold Reports?

  • Seller: Syncfusion
  • Company Website:
  • Year Founded: 2001
  • HQ Location: Morrisville, North Carolina
  • Twitter: @Syncfusion
    11,907 Twitter followers
  • LinkedInยฎ Page: www.linkedin.com
    2,739 employees on LinkedInยฎ

Who Uses This Product?

  • Top Industries: Computer Software, Information Technology and Services
  • Company Size: 58% Small, 32% Medium

What Do G2 Reviewers Say About Bold Reports?

AI-generated summary from verified user reviews

Pros
  • Users love the ease of use of Bold Reports, appreciating its intuitive design and seamless integrations.
  • Users commend the excellent customer support of Bold Reports, noting quick responses and helpful solutions.
  • Users value the easy integrations of Bold Reports, enhancing flexibility and usability across multiple applications.
  • Users value the robust report generation capabilities of Bold Reports, enhancing functionality and client flexibility in applications.
  • Users appreciate the seamless integration of Bold Reports, enhancing their applications and simplifying report creation.
Cons
  • Users face a notable learning difficulty with Bold Reports due to its complex interface and initial setup challenges.
  • Users report experiencing slow performance with Bold Reports, especially when handling large reports without proper tuning.
  • Users face reporting issues due to limitations in the designer and difficulty in implementation, slowing down development.
  • Users report encountering persistent bugs in Bold Reports, affecting functionality and overall user experience.
  • Users find the complex usage of Bold Reports frustrating, particularly during setup and navigating its intricate features.

What Are Recent G2 Reviews of Bold Reports?

What Are G2 Users Discussing About Bold Reports?

SAS Augmented Analytics & Business Intelligence

SAS offers an integrated, robust and flexible presentation layer for the full breadth of SAS Analytics capabilities

Average Rating: 4.3/5.0

Total Reviews: 68

How Do G2 Users Rate SAS Augmented Analytics & Business Intelligence?

  • Has the product been a good partner in doing business?: 8.6/10 (Category avg: 9.2/10)
  • Steps to Answer: 7.8/10 (Category avg: 8.4/10)
  • Reports Interface: 8.5/10 (Category avg: 8.8/10)
  • Calculated Fields: 8.6/10 (Category avg: 8.5/10)

Who Is the Company Behind SAS Augmented Analytics & Business Intelligence?

  • Seller: SAS Institute
  • Year Founded: 1976
  • HQ Location: Cary, NC
  • Twitter: @SASsoftware
    60,863 Twitter followers
  • LinkedInยฎ Page: www.linkedin.com
    15,122 employees on LinkedInยฎ
  • Phone: 1-800-727-0025

Who Uses This Product?

  • Top Industries: Information Technology and Services, Banking
  • Company Size: 60% Large, 24% Medium

What Are Recent G2 Reviews of SAS Augmented Analytics & Business Intelligence?

What Are G2 Users Discussing About SAS Augmented Analytics & Business Intelligence?

DataGPT

DataGPT is the world's first conversational AI analyst enabling users to ask any questions about their data in natural language and receive complete answers within seconds. DataGPT is fully autonomous chatbot with memory, capable of answering complex questions like "why did revenue drop?" and having any data-related conversation with any user. DataGPT revolutionizes data analysis by letting you talk directly with your data, delivering instant, analyst-grade insights for smarter business decisions. Our customers experience significant revenue growth and cost reduction, resulting in an average ROI of 2,178% per quarter. How it works: 1. Connects to any Data Source - Easily connect, define your schema, and create a single source of truth for all users. 2. Analyst-Quality Answers - DataGPT performs expert-level analysis across every segment in your data. 3. Instant Responses - DataGPT queries millions of data points 100x faster than current data warehouses. 4. Explore and Drill into your Data - With each DataGPT answer, the Data Navigator allows further exploration and exhaustive drill down capabilities. DataGPT is a product developed and owned by Comparative, Inc.

Average Rating: 4.7/5.0

Total Reviews: 16

How Do G2 Users Rate DataGPT?

  • Has the product been a good partner in doing business?: 9.3/10 (Category avg: 9.2/10)
  • Steps to Answer: 9.4/10 (Category avg: 8.4/10)
  • Reports Interface: 8.6/10 (Category avg: 8.8/10)
  • Calculated Fields: 9.3/10 (Category avg: 8.5/10)

Who Is the Company Behind DataGPT?

  • Seller: Comparative
  • Year Founded: 2021
  • HQ Location: San Francisco, California
  • LinkedInยฎ Page: www.linkedin.com
    4 employees on LinkedInยฎ

Who Uses This Product?

  • Top Industries: Information Technology and Services
  • Company Size: 63% Medium, 31% Small

What Do G2 Reviewers Say About DataGPT?

AI-generated summary from verified user reviews

Pros
  • Users appreciate the efficiency of DataGPT in refining data perfectly from large datasets.
Cons
  • Users note a lack of detail in DataGPT, occasionally omitting important data that may be necessary.

What Are Recent G2 Reviews of DataGPT?

Astrato

๐—”๐˜€๐˜๐—ฟ๐—ฎ๐˜๐—ผ ๐—”๐—ป๐—ฎ๐—น๐˜†๐˜๐—ถ๐—ฐ๐˜€ ๐—ถ๐˜€ ๐—ฎ ๐˜„๐—ฎ๐—ฟ๐—ฒ๐—ต๐—ผ๐˜‚๐˜€๐—ฒ-๐—ป๐—ฎ๐˜๐—ถ๐˜ƒ๐—ฒ ๐—ฏ๐˜‚๐˜€๐—ถ๐—ป๐—ฒ๐˜€๐˜€ ๐—ถ๐—ป๐˜๐—ฒ๐—น๐—น๐—ถ๐—ด๐—ฒ๐—ป๐—ฐ๐—ฒ ๐—ฝ๐—น๐—ฎ๐˜๐—ณ๐—ผ๐—ฟ๐—บ ๐˜๐—ต๐—ฎ๐˜ ๐—ฒ๐—ป๐—ฎ๐—ฏ๐—น๐—ฒ๐˜€ ๐—ผ๐—ฟ๐—ด๐—ฎ๐—ป๐—ถ๐˜€๐—ฎ๐˜๐—ถ๐—ผ๐—ป๐˜€ ๐˜๐—ผ ๐—ฏ๐˜‚๐—ถ๐—น๐—ฑ, ๐—ฒ๐—บ๐—ฏ๐—ฒ๐—ฑ, ๐—ฎ๐—ป๐—ฑ ๐˜€๐—ต๐—ฎ๐—ฟ๐—ฒ ๐—ถ๐—ป๐˜๐—ฒ๐—ฟ๐—ฎ๐—ฐ๐˜๐—ถ๐˜ƒ๐—ฒ ๐—ฑ๐—ฎ๐˜€๐—ต๐—ฏ๐—ผ๐—ฎ๐—ฟ๐—ฑ๐˜€ ๐—ฎ๐—ป๐—ฑ ๐—ฑ๐—ฎ๐˜๐—ฎ ๐—ฎ๐—ฝ๐—ฝ๐—น๐—ถ๐—ฐ๐—ฎ๐˜๐—ถ๐—ผ๐—ป๐˜€ ๐—ฑ๐—ถ๐—ฟ๐—ฒ๐—ฐ๐˜๐—น๐˜† ๐—ผ๐—ป ๐˜๐—ผ๐—ฝ ๐—ผ๐—ณ ๐—ฐ๐—น๐—ผ๐˜‚๐—ฑ ๐—ฑ๐—ฎ๐˜๐—ฎ ๐˜„๐—ฎ๐—ฟ๐—ฒ๐—ต๐—ผ๐˜‚๐˜€๐—ฒ๐˜€ ๐—ถ๐—ป๐—ฐ๐—น๐˜‚๐—ฑ๐—ถ๐—ป๐—ด ๐—ฆ๐—ป๐—ผ๐˜„๐—ณ๐—น๐—ฎ๐—ธ๐—ฒ, ๐—•๐—ถ๐—ด๐—ค๐˜‚๐—ฒ๐—ฟ๐˜†, ๐——๐—ฎ๐˜๐—ฎ๐—ฏ๐—ฟ๐—ถ๐—ฐ๐—ธ๐˜€, ๐—–๐—น๐—ถ๐—ฐ๐—ธ๐—›๐—ผ๐˜‚๐˜€๐—ฒ, ๐—ฆ๐˜‚๐—ฝ๐—ฎ๐—ฏ๐—ฎ๐˜€๐—ฒ, ๐—”๐—บ๐—ฎ๐˜‡๐—ผ๐—ป ๐—ฅ๐—ฒ๐—ฑ๐˜€๐—ต๐—ถ๐—ณ๐˜, ๐—ฃ๐—ผ๐˜€๐˜๐—ด๐—ฟ๐—ฒ๐—ฆ๐—ค๐—Ÿ, ๐—ฎ๐—ป๐—ฑ ๐——๐—ฟ๐—ฒ๐—บ๐—ถ๐—ผ. Astrato's zero-copy architecture connects to the warehouse via a live-query engine, which means every dashboard, report, and workflow runs against the source data in real time โ€” without extracts, data movement, or cached copies. Security policies such as row-level access controls and PII masking are inherited directly from the warehouse, reducing governance overhead for IT and data teams. ๐—ง๐—ต๐—ฒ ๐—ฝ๐—น๐—ฎ๐˜๐—ณ๐—ผ๐—ฟ๐—บ ๐˜€๐˜‚๐—ฝ๐—ฝ๐—ผ๐—ฟ๐˜๐˜€ ๐˜๐—ต๐—ฟ๐—ฒ๐—ฒ ๐—ฝ๐—ฟ๐—ถ๐—บ๐—ฎ๐—ฟ๐˜† ๐˜‚๐˜€๐—ฒ ๐—ฐ๐—ฎ๐˜€๐—ฒ๐˜€: โ€ข ๐—š๐˜‚๐—ถ๐—ฑ๐—ฒ๐—ฑ ๐˜€๐—ฒ๐—น๐—ณ-๐˜€๐—ฒ๐—ฟ๐˜ƒ๐—ถ๐—ฐ๐—ฒ ๐—•๐—œ. A no-code interface with 70+ out-of-the-box chart types allows business users to explore data, build dashboards, and generate reports without SQL. A shared semantic layer ensures governed, reusable metric definitions across all users and content. No-code Actions let designers chain clicks, filters, and navigation into guided flows โ€” so end users get an app-like experience, not a blank dashboard. โ€ข ๐—–๐˜‚๐˜€๐˜๐—ผ๐—บ๐—ฒ๐—ฟ-๐—ณ๐—ฎ๐—ฐ๐—ถ๐—ป๐—ด ๐—ฎ๐—ป๐—ฑ ๐—ถ๐—ป๐˜๐—ฒ๐—ฟ๐—ป๐—ฎ๐—น ๐—ฒ๐—บ๐—ฏ๐—ฒ๐—ฑ๐—ฑ๐—ฒ๐—ฑ ๐—ฎ๐—ป๐—ฎ๐—น๐˜†๐˜๐—ถ๐—ฐ๐˜€. Fully white-labeled dashboards and workflows can be embedded into external products, portals, CRMs, ERPs, and intranet tools. Three embedding modes are supported โ€” single object, grouped visuals, or full interactive workbooks โ€” delivered via iframe with mobile-responsive layouts. Multi-tenant isolation is enforced at both warehouse and application level via row-level filters, group permissions, and SSO pass-through. Built-in usage telemetry tracks engagement, exploration patterns, and drop-off. โ€ข ๐—ข๐—ฝ๐—ฒ๐—ฟ๐—ฎ๐˜๐—ถ๐—ผ๐—ป๐—ฎ๐—น ๐—ฑ๐—ฎ๐˜๐—ฎ ๐—ฎ๐—ฝ๐—ฝ๐˜€ ๐—ฎ๐—ป๐—ฑ ๐˜„๐—ผ๐—ฟ๐—ธ๐—ณ๐—น๐—ผ๐˜„๐˜€. Writeback capabilities let users push data back into the warehouse from any dashboard, app, or embedded view โ€” supporting planning, forecasting, approvals, and field updates. No-code forms with validation, conditional logic, and multi-step flows can be built without engineering. Action buttons can trigger stored procedures, external functions, Salesforce updates, Slack posts, and emails, so analytics drive downstream action. ๐—”๐—ฑ๐—ฑ๐—ถ๐˜๐—ถ๐—ผ๐—ป๐—ฎ๐—น ๐—ฐ๐—ฎ๐—ฝ๐—ฎ๐—ฏ๐—ถ๐—น๐—ถ๐˜๐—ถ๐—ฒ๐˜€ ๐—ถ๐—ป๐—ฐ๐—น๐˜‚๐—ฑ๐—ฒ: โ€ข ๐—ฆ๐—ฐ๐—ต๐—ฒ๐—ฑ๐˜‚๐—น๐—ฒ๐—ฑ ๐—ฟ๐—ฒ๐—ฝ๐—ผ๐—ฟ๐˜๐—ถ๐—ป๐—ด & ๐—ฑ๐—ถ๐˜€๐˜๐—ฟ๐—ถ๐—ฏ๐˜‚๐˜๐—ถ๐—ผ๐—ป. Live, branded reports generated from the warehouse and delivered automatically in PDF, Excel, PowerPoint, or image format to email, Slack, Microsoft Teams, or SharePoint. Teams can upload their own Excel or PowerPoint templates and have them populated with live data at run-time. Per-recipient row-level security ensures governed distribution, and reports can be archived to S3, Google Drive, or SharePoint for audit and compliance. โ€ข ๐—š๐—ฒ๐—ป ๐—”๐—œ & ๐—•๐—œ ๐—–๐—ผ๐—ฝ๐—ถ๐—น๐—ผ๐˜. Contextual AI Insights generate summaries that regenerate as users filter and drill. BI Copilot accelerates build time by generating chart titles, business-friendly field labels, and complex measures like YoY growth or retention from plain-language input. Custom Report lets end users ask questions in natural language and get visualizations back. Every AI output is grounded in the semantic layer. Bring your own LLM โ€” Snowflake Cortex, OpenAI, Azure OpenAI, Claude by Anthropic, or Google Gemini โ€” or use the default provider. With Snowflake Cortex, queries execute inside the warehouse and data never leaves. Admins control AI features via independent per-capability toggles. โ€ข ๐—˜๐—บ๐—ฏ๐—ฒ๐—ฑ๐—ฑ๐—ถ๐—ป๐—ด ๐—ฎ๐—ป๐—ฑ ๐—ถ๐—ป๐˜๐—ฒ๐—ด๐—ฟ๐—ฎ๐˜๐—ถ๐—ผ๐—ป. Dashboards can be embedded with full white-label control over colours, fonts, logos, layout, and domain. Authentication is handled via SSO pass-through, OAuth, or token-based access. SCIM and APIs support automated user provisioning at scale. โ€ข ๐—š๐—ผ๐˜ƒ๐—ฒ๐—ฟ๐—ป๐—ฎ๐—ป๐—ฐ๐—ฒ & ๐—น๐—ถ๐—ณ๐—ฒ๐—ฐ๐˜†๐—ฐ๐—น๐—ฒ ๐—ฐ๐—ผ๐—ป๐˜๐—ฟ๐—ผ๐—น. Role-based access control across view, edit, design, export, and admin. Workbook lifecycle governance with draft, version, publish workflows and change tracking. Row-level security inherited from the warehouse or configured per semantic layer. โ€ข ๐—˜๐—ป๐˜๐—ฒ๐—ฟ๐—ฝ๐—ฟ๐—ถ๐˜€๐—ฒ-๐—ด๐—ฟ๐—ฎ๐—ฑ๐—ฒ ๐˜€๐—ฒ๐—ฐ๐˜‚๐—ฟ๐—ถ๐˜๐˜† & ๐—ฐ๐—ผ๐—บ๐—ฝ๐—น๐—ถ๐—ฎ๐—ป๐—ฐ๐—ฒ: SOC 2 Type II, ISO 27001 certified, HIPAA compliant, GDPR-ready. Snowflake Technology Partner and Google Cloud Ready โ€“ BigQuery. Astrato is used by data teams, product teams, and analytics leaders across SaaS companies, data businesses, agencies, and enterprises. Pricing is structured to scale with embedded use cases involving large numbers of external users.

Average Rating: 4.7/5.0

Total Reviews: 24

How Do G2 Users Rate Astrato?

  • Has the product been a good partner in doing business?: 10.0/10 (Category avg: 9.2/10)
  • Steps to Answer: 8.6/10 (Category avg: 8.4/10)
  • Reports Interface: 9.5/10 (Category avg: 8.8/10)
  • Calculated Fields: 9.0/10 (Category avg: 8.5/10)

Who Is the Company Behind Astrato?

Who Uses This Product?

  • Company Size: 40% Medium, 32% Small

What Do G2 Reviewers Say About Astrato?

AI-generated summary from verified user reviews

Pros
  • Users praise the ease of use of Astrato, highlighting its intuitive design and minimal dependency on technical resources.
  • Users commend the exceptional customer support of Astrato, enhancing usability and reducing the learning curve effectively.
  • Users love the seamless integration with Snowflake, enabling quick setup and efficient analytics workflows.
  • Users value the easy, user-friendly learning experience of Astrato, enabling quick mastery and effective data exploration.
  • Users value the dashboard customization of Astrato, enabling easy and flexible solutions for non-technical professionals.
Cons
  • Users note the missing features in Astrato hinder functionality compared to more established tools, affecting overall user experience.
  • Users report encountering bugs and usability issues with Astrato, complicating their experience and affecting efficiency.
  • Users find that complex data modeling in Astrato can be challenging, requiring significant expertise for optimal results.
  • Users note that Astrato's complex usage can be challenging, especially with bugs and less intuitive features compared to established tools.
  • Users find that Astrato has a steep learning curve due to bugs and usability challenges compared to established tools.
What Are Recent G2 Reviews of Astrato?

Whaly

We believe that analytics should benefit everyone. Whaly is an integrated, self-service business intelligence platform that enables data teams and business teams to work better together. Business teams are empowered to access, analyze, and share data from the tools they already use every day - HubSpot, Salesforce, Google Analytics, and more - with no technical expertise required. This means no more waiting on data teams for answers to every question. In parallel, data teams get some time back to focus on fewer menial tasks. With Whaly, you can connect, model, visualize and share your data - all from one place. Our mission is to boost adoption and foster company-wide trust in data, so that your company can make better, more informed decisions. Time to make your data work harder for you - not the other way around.

Average Rating: 4.8/5.0

Total Reviews: 25

How Do G2 Users Rate Whaly?

  • Has the product been a good partner in doing business?: 9.5/10 (Category avg: 9.2/10)
  • Steps to Answer: 10.0/10 (Category avg: 8.4/10)
  • Reports Interface: 9.0/10 (Category avg: 8.8/10)
  • Calculated Fields: 9.3/10 (Category avg: 8.5/10)

Who Is the Company Behind Whaly?

  • Seller: Whaly
  • Year Founded: 2020
  • HQ Location: Paris, FR
  • Twitter: @WhalyHQ
    56 Twitter followers
  • LinkedInยฎ Page: www.linkedin.com
    15 employees on LinkedInยฎ

Who Uses This Product?

  • Top Industries: Computer Software
  • Company Size: 44% Medium, 40% Small

What Are Recent G2 Reviews of Whaly?

HockeyStack

HockeyStack connects every data source across your go-to-market motion and turns scattered marketing and sales data into clear answers about what drives revenue, and the actions to double down on it. Key capabilities include: Odin (AI Analyst): Ask questions in plain English and get instant analysis, the reasoning behind the numbers, and recommended next steps, plus automated insights on your key metrics with no dashboards to build. Attribution Reporting: Out-of-the-box dashboard templates from day one, then custom no-code reports across 9 attribution models, showing the campaigns and channels driving pipeline from first impression to closed-won. Lift Reporting: Measure the true incremental impact of every campaign, so you know what actually caused revenue rather than what just appeared in the journey. Buyer Journeys: See every interaction in one time-stamped view from first touch to close, powered by cookieless tracking that captures the full journey. Account Intelligence & ABM/ABX: Identify anonymous visitors, build target lists with first- and third-party intent, run ads, and sync it all to your CRM, backed by best-in-class account and lead scoring. Achieve defensible attribution, more efficient growth, and confident budget decisions, without code or an analyst queue. Get started with HockeyStack today!

Average Rating: 4.4/5.0

Total Reviews: 80

How Do G2 Users Rate HockeyStack?

  • Has the product been a good partner in doing business?: 9.5/10 (Category avg: 9.2/10)
  • Steps to Answer: 8.9/10 (Category avg: 8.4/10)
  • Reports Interface: 9.1/10 (Category avg: 8.8/10)
  • Calculated Fields: 8.4/10 (Category avg: 8.5/10)

Who Is the Company Behind HockeyStack?

  • Seller: HockeyStack
  • Company Website:
  • Year Founded: 2021
  • HQ Location: San Francisco, US
  • LinkedInยฎ Page: www.linkedin.com
    66 employees on LinkedInยฎ

Who Uses This Product?

  • Top Industries: Computer Software, Information Technology and Services
  • Company Size: 62% Medium, 34% Small

What Do G2 Reviewers Say About HockeyStack?

AI-generated summary from verified user reviews

Pros
  • Users appreciate the flexibility and detailed insights of HockeyStack, enhancing their marketing campaign performance analysis.
  • Users value the flexible analytics of HockeyStack, which provides tailored insights for campaign performance and ROI.
  • Users highlight the ease of use of HockeyStack, praising its simple setup and seamless integrations for analytics.
  • Users commend HockeyStack's exceptional support team for their thorough and timely responses to all inquiries.
  • Users praise the unprecedented customer support from HockeyStack, highlighting timely and thorough responses to all inquiries.
Cons
  • Users find the learning curve challenging, especially for beginners lacking experience with attribution tools.
  • Users note a steep learning curve with HockeyStack, but find it manageable with guidance and resources available.
  • Users find the complexity of HockeyStack can lead to a learning curve, but support is readily available.
  • Users note a difficult learning process with HockeyStack, requiring significant time investment to master its features.
  • Users find a steep learning curve with HockeyStack that requires time and experimentation to master effectively.

What Are Recent G2 Reviews of HockeyStack?

What Are G2 Users Discussing About HockeyStack?

TIMi

TIMi is the most efficient Data Science and Data Processing Platform. Since 2007, we have been creating and improving the most powerful framework to push the barriers of analytics, predictive analytics, AI and Big Data, while offering a helpful, fast and friendly environment. The TIMi Suite consists of four tools: 1. Anatella (Analytical ETL, Data Prep & Big Data), 2. Modeler (Auto-ML / Automated Predictive Modelling / Automated-AI), 3. StarDust (3D Segmentation) 4. Kibella (BI Dashboarding solution). TIMi dominates the Data Science market: In the "Summer 2022 - Momentum Reportโ€ from G2, in the โ€œData Scienceโ€ category, TIMi has the #1 rank: TIMi is the Data Science solution with both the highest market growth and the highest customer-satisfaction! More about this subject here: https://timi.eu/blog/timi-the-number-one-data-science-platform/

Average Rating: 4.8/5.0

Total Reviews: 50

How Do G2 Users Rate TIMi?

  • Has the product been a good partner in doing business?: 9.1/10 (Category avg: 9.2/10)
  • Steps to Answer: 8.5/10 (Category avg: 8.4/10)
  • Reports Interface: 8.1/10 (Category avg: 8.8/10)
  • Calculated Fields: 9.5/10 (Category avg: 8.5/10)

Who Is the Company Behind TIMi?

  • Seller: TIMi SPRL
  • Year Founded: 2007
  • HQ Location: Brussels
  • Twitter: @TIMiSuite
    3,532 Twitter followers
  • LinkedInยฎ Page: www.linkedin.com
    86 employees on LinkedInยฎ

Who Uses This Product?

  • Top Industries: Information Technology and Services, Banking
  • Company Size: 40% Small, 32% Large

What Do G2 Reviewers Say About TIMi?

AI-generated summary from verified user reviews

Pros
  • Users highlight the exceptional customer support from the TIMi team, noting their quick response times and helpfulness.
  • Users find TIMi easy to use, thanks to its intuitive design and quick learning curve.
  • Users appreciate TIMi's user-friendly interface and exceptional support, making data transformation quick and efficient.
  • Users value the fast and intuitive automation capabilities of TIMi, streamlining data transformations and analyses effectively.
  • Users value the intuitive charting features of TIMi, enabling efficient data visualization and analysis.

What Are Recent G2 Reviews of TIMi?

What Are G2 Users Discussing About TIMi?

Explo

Explo provides a powerful embedded dashboard and reporting solution. Securely share customizable product analytics, project reports, and KPIs with each of your customers all while seamlessly matching your product's design. Give your users the power to explore their data on their on by editing dashboards and building their own self serve data reports.

Average Rating: 4.9/5.0

Total Reviews: 137

How Do G2 Users Rate Explo?

  • Has the product been a good partner in doing business?: 9.1/10 (Category avg: 9.2/10)
  • Steps to Answer: 9.2/10 (Category avg: 8.4/10)
  • Reports Interface: 9.2/10 (Category avg: 8.8/10)
  • Calculated Fields: 9.1/10 (Category avg: 8.5/10)

Who Is the Company Behind Explo?

  • Seller: Explo
  • Year Founded: 2019
  • HQ Location: San Francisco, CA
  • Twitter: @tryexplo
    657 Twitter followers
  • LinkedInยฎ Page: www.linkedin.com
    11 employees on LinkedInยฎ

Who Uses This Product?

  • Who Uses This: Co-Founder
  • Top Industries: Computer Software, Financial Services
  • Company Size: 77% Small, 22% Medium

What Do G2 Reviewers Say About Explo?

AI-generated summary from verified user reviews

Pros
  • Users praise the flexible charting features of Explo, enabling quick data connection and stunning visualizations.
  • Users love the flexible dashboard customization in Explo, enabling tailored data visualizations and effortless reporting.
  • Users love the ease of use of Explo, enjoying its intuitive UI for quick dashboard creation and customization.
  • Users love the easy creation of customizable dashboards in Explo, enhancing flexibility and speeding up data visualization.
  • Users value the customizability of Explo, allowing easy linking of datasets and intuitive dashboard creation.
Cons
  • Users find the complexity of customer dashboards implementation challenging, with a steep learning curve due to poor design.
  • Users find the complex usage of Explo challenging due to its unintuitive design and difficult learning curve.
  • Users find the initial difficulty in implementing dashboards challenging due to the unintuitive design and complexity.
  • Users find the layout issues of Explo challenging, making dashboard implementation and learning quite complex.
  • Users find the learning curve steep due to the unintuitive design, complicating the implementation of customer-facing dashboards.

What Are Recent G2 Reviews of Explo?

What Are G2 Users Discussing About Explo?

Tian Lin
TL
Researched and written by Tian Lin
Updated