Best Data Visualization Tools - Page 3

How Many Data Visualization Tools Products Does G2 Track?

Total Products under this Category: 478

Category Stats (Aug 2026)

  • Average Rating: 4.43/5 The average rating of products in this category, based on all submitted ratings
  • Top Trending Product: Supersimple (+0.89%) - Among all products in this category, Supersimple recorded the largest rating increase compared to last month

Last updated: August 04, 2026

How Does G2 Rank Data Visualization Tools Products?

Why You Can Trust G2's Software Rankings:

  • 30 Analysts and Data Experts
  • 26,100+ Authentic Reviews
  • 478+ Products
  • Unbiased Rankings

G2's software rankings are built on verified user reviews, rigorous moderation, and a consistent research methodology maintained by a team of analysts and data experts. Each product is measured using the same transparent criteria, with no paid placement or vendor influence. While reviews reflect real user experiences, which can be subjective, they offer valuable insight into how software performs in the hands of professionals. Together, these inputs power the G2 Score, a standardized way to compare tools within every category.

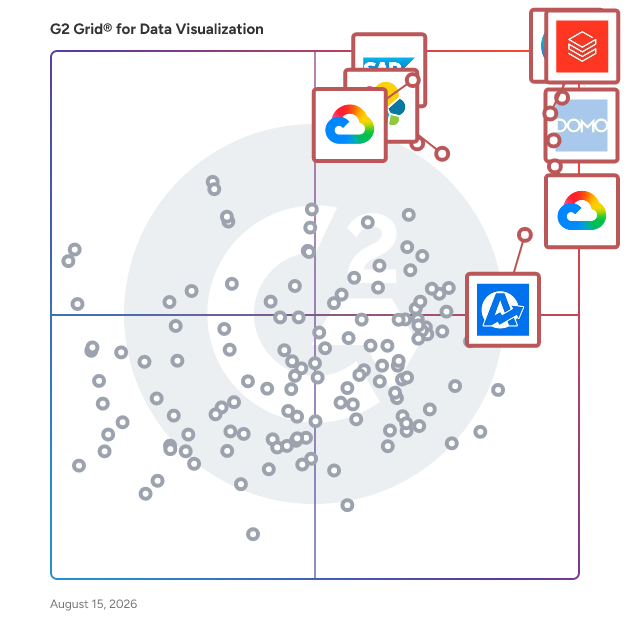
G2 Grid® for Data Visualization Tools

G2 Grid® for Data Visualization Tools plotting products by satisfaction and market presence

Highlighted products: Canva, Databricks, Domo, Looker, Data Studio, Elastic Stack, SAP HANA Cloud, and AgencyAnalytics.

Underlying data: [Grid® JSON](https://www.g2.com/categories/data-visualization-tools/grids.json?focus%5B%5D=canva&focus%5B%5D=databricks&focus%5B%5D=domo&focus%5B%5D=looker&focus%5B%5D=data-studio&focus%5B%5D=elastic-stack&focus%5B%5D=sap-hana-cloud-2025-10-01&focus%5B%5D=agencyanalytics)

Sponsored

Looker

Looker, Google Cloud’s business intelligence platform, enables you to chat with your data. Organizations turn to Looker for self-service and governed BI, to build custom applications with trusted metrics, or to bring Looker modeling to their existing environment. The result is improved data engineering efficiency and true business transformation.

Visit website

Luzmo

Customers choose Luzmo to give their users clean, intuitive analytics directly inside their product, without forcing them into a separate BI tool. Reviews highlight how fast teams can move from raw data to fully branded dashboards, how easy it is for non‑technical users to explore and customize their own views, and how seamless the embedding experience feels. Many users call out Luzmo’s customer‑first support and dedicated CSMs as a key reason they can roll out new analytics experiences quickly and keep improving them over time.

Average Rating: 4.6/5.0

Total Reviews: 70

How Do G2 Users Rate Luzmo?

  • Has the product been a good partner in doing business?: 9.4/10 (Category avg: 9.0/10)
  • Dashboards: 9.7/10 (Category avg: 9.0/10)
  • Steps to Answer: 8.6/10 (Category avg: 8.6/10)
  • Formats: 9.2/10 (Category avg: 8.6/10)

Who Is the Company Behind Luzmo?

  • Seller: Luzmo NV
  • Year Founded: 2015
  • HQ Location: Brooklyn, US
  • Twitter: @luzmo_official
    895 Twitter followers
  • LinkedIn® Page: www.linkedin.com
    49 employees on LinkedIn®

Who Uses This Product?

  • Who Uses This: CEO
  • Top Industries: Computer Software, Information Technology and Services
  • Company Size: 59% Small, 32% Medium

What Do G2 Reviewers Say About Luzmo?

AI-generated summary from verified user reviews

Pros
  • Users appreciate the intuitive ease of use of Luzmo, enabling quick adoption and fast dashboard creation.
  • Users are impressed by Luzmo's embedding features, enabling quick insights and seamless integration into their SaaS applications.
  • Users value the customization features of Luzmo, enabling tailored applications and efficient management across diverse client environments.
  • Users commend Luzmo for its intuitive interface and rapid deployment, enabling quick insights and analytics integration.
  • Users praise the easy setup of Luzmo, enabling swift adoption and fast deployment of analytics tools.
Cons
  • Users find Luzmo's complexity challenging, with setup difficulties and limited querying capabilities hindering efficiency.
  • Users are disappointed by Luzmo's limited options for complex queries and insufficient chart functionality.
  • Users note performance issues with large datasets and lag in the interface, affecting overall workflow experience.
  • Users experience table limitations with Luzmo, hindering complex queries and causing challenges with data handling.
  • Users experience performance and sync issues with Luzmo, especially when handling larger datasets, impacting usability.

What Are Recent G2 Reviews of Luzmo?

What Are G2 Users Discussing About Luzmo?

DashThis

DashThis is a marketing reporting platform that turns multi-platform data into client-ready dashboards automatically. Instead of copy-pasting screenshots and manually pulling numbers from a dozen tools, you connect your data sources once and let DashThis handle the rest. The result: polished, up-to-date reports your clients can actually understand, without the hours of manual work. Built for marketing agencies, consultants, and in-house teams managing multiple clients or campaigns, DashThis connects to 30+ platforms natively, including Google Analytics 4, Meta Ads, Google Ads, TikTok Ads, LinkedIn, Instagram, YouTube, HubSpot, Klaviyo, Ahrefs, and Google My Business. Need to pull in data that isn't covered by a native integration? A flexible CSV import system lets you include any custom or proprietary metrics so every number you track ends up in one place. Smarter reporting with AI Insights DashThis goes beyond aggregating data. With AI Insights, your dashboards automatically generate plain-language analysis of your marketing performance, surfacing trends, anomalies, and key takeaways directly inside your reports. Instead of spending time writing commentary for every client, AI Insights does the heavy lifting, so you can focus on strategy. It's the difference between handing a client a pile of numbers and handing them a story they can act on. Built for agencies that need to move fast Creating a new client report takes minutes, not hours. Choose from 50+ preset templates and 1,000+ widget templates, or save any of your own dashboards as reusable templates. One-click cloning lets you replicate an existing report structure for a new client or campaign instantly. For client-facing work, DashThis offers full white-label capabilities. Apply your own domain, logo, brand colors, and remove all DashThis branding so every report looks like it came straight from your agency. Share reports via custom URL, scheduled email with PDF attachment, or on-demand download. Automated recurring email delivery means reports go out on schedule without anyone having to remember to hit send. DashThis is how agencies scale their reporting without scaling their headcount and how they use AI to deliver sharper insights to every client, every month.

Average Rating: 4.7/5.0

Total Reviews: 91

How Do G2 Users Rate DashThis?

  • Has the product been a good partner in doing business?: 9.7/10 (Category avg: 9.0/10)
  • Dashboards: 9.5/10 (Category avg: 9.0/10)
  • Steps to Answer: 9.2/10 (Category avg: 8.6/10)
  • Formats: 9.2/10 (Category avg: 8.6/10)

Who Is the Company Behind DashThis?

  • Seller: DashThis
  • Company Website:
  • Year Founded: 2011
  • HQ Location: Quebec, Canada
  • Twitter: @DashThis
    2,070 Twitter followers
  • LinkedIn® Page: www.linkedin.com
    23 employees on LinkedIn®

Who Uses This Product?

  • Top Industries: Marketing and Advertising, Internet
  • Company Size: 80% Small, 16% Medium

What Do G2 Reviewers Say About DashThis?

AI-generated summary from verified user reviews

Pros
  • Users love the super customizable dashboard of DashThis, making analytics review effortless and visually appealing.
  • Users enjoy the ease of use of DashThis, finding it simple and visually appealing for analytics.
  • Users love the intuitive design of DashThis, making analytics review simple and visually engaging.
  • Users love the ease of reviewing analytics with DashThis, enjoying a streamlined view and customizable metrics.
  • Users value the centralized management of DashThis, simplifying the review of analytics and metrics in one place.
Cons
  • Users find DashThis expensive, particularly for individuals and smaller teams, affecting accessibility and usability.
  • Users find inadequate reporting metrics in DashThis, making it challenging to customize client dashboards effectively.
  • Users face reporting issues due to the complexity of accessing needed metrics and requiring knowledge of other programs.
  • Users find access limitations challenging as customizing client dashboards with required metrics can be difficult.
  • Users find DashThis somewhat complex, especially for those unfamiliar with similar tools and dashboards.

What Are Recent G2 Reviews of DashThis?

What Are G2 Users Discussing About DashThis?

PopSQL

PopSQL is the evolution of legacy SQL editors like DataGrip, DBeaver, Postico. We provide a beautiful, modern SQL editor for data focused teams looking to save time, improve data accuracy, onboard new hires faster, and deliver insights to the business fast. With PopSQL, users can easily understand their data model, write version controlled SQL, collaborate with live presence, visualize data in charts and dashboards, schedule reports, share results, and organize foundational queries for search and discovery. Even if your team is already leveraging a large BI tool, like Tableau or Looker, or a hodge podge of SQL editors, PopSQL enables seamless collaboration between your SQL power users, junior analysts, and even your less technical stakeholders who are hungry for data insights. * Cross-platform compatibility with macOS, Windows, and Linux * Works with Snowflake, Redshift, BigQuery, Clickhouse, Databricks, Athena, MongoDB, PostgreSQL, MySQL, SQL Server, SQLite, Presto, Cassandra, and more

Average Rating: 4.6/5.0

Total Reviews: 80

How Do G2 Users Rate PopSQL?

  • Has the product been a good partner in doing business?: 9.6/10 (Category avg: 9.0/10)
  • Dashboards: 8.7/10 (Category avg: 9.0/10)
  • Steps to Answer: 9.0/10 (Category avg: 8.6/10)
  • Formats: 8.8/10 (Category avg: 8.6/10)

Who Is the Company Behind PopSQL?

Who Uses This Product?

  • Top Industries: Computer Software, Information Technology and Services
  • Company Size: 43% Small, 37% Medium

What Are Recent G2 Reviews of PopSQL?

What Are G2 Users Discussing About PopSQL?

Visier

Visier gives organizations a Workforce AI Edge: a set of AI-powered capabilities that help leaders understand the relationship between people and work, elevate employee productivity, and win by adapting to change faster. The company is the global leader in AI-powered people analytics, workforce planning, and compensation allocation. All Visier technology is underpinned by its Real-time People Data Platform, which uses AI to unlock the business-transforming potential of people data, work data, and the fusion of both. Founded in 2010 by the pioneers of business intelligence, Visier has over 60,000 customers in 75 countries—including enterprises like BASF, Panasonic, Experian, Amgen, eBay, Ford Motor Company, and more. To learn more about Visier, visit www.visier.com.

Average Rating: 4.6/5.0

Total Reviews: 219

How Do G2 Users Rate Visier?

  • Has the product been a good partner in doing business?: 9.1/10 (Category avg: 9.0/10)
  • Dashboards: 8.6/10 (Category avg: 9.0/10)
  • Steps to Answer: 7.9/10 (Category avg: 8.6/10)
  • Formats: 8.2/10 (Category avg: 8.6/10)

Who Is the Company Behind Visier?

  • Seller: Visier
  • Year Founded: 2010
  • HQ Location: Vancouver, British Columbia
  • Twitter: @visier
    6,164 Twitter followers
  • LinkedIn® Page: www.linkedin.com
    555 employees on LinkedIn®

Who Uses This Product?

  • Top Industries: Hospital & Health Care, Information Technology and Services
  • Company Size: 82% Large, 17% Medium

What Do G2 Reviewers Say About Visier?

AI-generated summary from verified user reviews

Pros
  • Users value the ease of use of Visier, appreciating its flexibility and support during the implementation process.
  • Users value the powerful data analysis capabilities of Visier, offering insights and trend predictions with ease.
  • Users value the powerful data connectivity of Visier, enabling insightful trend identification and storytelling dashboards.
  • Users appreciate the intuitive data visualizations of Visier, enabling easy interpretation and deeper workforce insights.
  • Users value the time-saving capabilities of Visier, benefiting from its fast performance and ease of use.
Cons
  • Users struggle with learning difficulties in Visier, finding it challenging to navigate and build without expert assistance.
  • Users find Visier expensive, with high costs for scaling, unlocking modules, and onboarding additional data.
  • Users find the learning curve steep for new users, making initial use of Visier challenging.
  • Users find the complexity of filtering and customization in Visier can hinder the user experience significantly.
  • Users find the limited customization options restrictive, impacting usability and requiring additional support for complex changes.

What Are Recent G2 Reviews of Visier?

What Are G2 Users Discussing About Visier?

datapine

datapine is a business intelligence & dashboarding platform that is focused on self-service, but also offers advanced analytics features such as predictive analytics or intelligent data alerts based on artificial intelligence and machine learning. With a few clicks, datapine integrates dozens of data sources such as databases, flat files, marketing analytics, social media data, CRM, and ERP data as well as helpdesk data. Thanks to an intuitive user interface, users of all skill levels can visualize and make sense of complex data by asking important questions and receiving answers immediately. The core of the product are dynamic, interactive business dashboards, that help to share insights within the organization effectively. datapine enables managers to data scientists to explore, visualize, analyze and report data in one central analytics platform and empowers modern, KPI driven businesses to grow further. datapine is a RIB Software GmbH solution.

Average Rating: 4.6/5.0

Total Reviews: 26

How Do G2 Users Rate datapine?

  • Has the product been a good partner in doing business?: 8.8/10 (Category avg: 9.0/10)

Who Is the Company Behind datapine?

  • Seller: RIB Software
  • Year Founded: 1961
  • HQ Location: Stuttgart, DE
  • Twitter: @RIB_Global
    1,214 Twitter followers
  • LinkedIn® Page: www.linkedin.com
    1,556 employees on LinkedIn®
  • Ownership: ETR:RIB

Who Uses This Product?

  • Company Size: 50% Medium, 42% Small

What Are Recent G2 Reviews of datapine?

Rollstack

Rollstack helps data, finance, customer success, and revenue operations teams automate recurring PowerPoint presentations and Word documents by connecting directly to business intelligence tools like Tableau, Power BI, Looker, Metabase, and Google Sheets. If you’re tired of copying charts, pasting screenshots, or triple-checking KPIs across decks, Rollstack eliminates that manual, error-prone work. You can sync up-to-date data into branded templates, update them with one click, and export presentation-ready files in seconds. It’s built for teams responsible for client reporting, executive dashboards, business reviews, and sales enablement materials. Rollstack integrates directly with your existing BI stack, so there’s no need to rebuild dashboards or redesign visuals. Just connect your source, map the data to your slides or docs, and update them on your schedule — daily, weekly, or whenever you need them. Used by companies like Zillow, SoFi, Whirlpool, TripAdvisor, and CarGurus, Rollstack helps teams save 10+ hours per week, avoid mistakes, and focus on the story the data tells — not the tedious mechanics of building decks. For data analysts, program managers, sales ops, finance, and client success teams — Rollstack is how modern enterprises deliver consistent, trusted reports at scale. Whether you’re building a QBR for a $10M account or a weekly EBR, Rollstack makes its creation automatic and accurate. Book a demo today to learn how to automate your most important business reports.

Average Rating: 4.6/5.0

Total Reviews: 78

How Do G2 Users Rate Rollstack?

  • Has the product been a good partner in doing business?: 9.6/10 (Category avg: 9.0/10)
  • Dashboards: 8.2/10 (Category avg: 9.0/10)
  • Steps to Answer: 8.0/10 (Category avg: 8.6/10)
  • Formats: 8.4/10 (Category avg: 8.6/10)

Who Is the Company Behind Rollstack?

  • Seller: Rollstack
  • Year Founded: 2022
  • HQ Location: New York, USA
  • Twitter: @Rollstack
    181 Twitter followers
  • LinkedIn® Page: www.linkedin.com
    30 employees on LinkedIn®

Who Uses This Product?

  • Top Industries: Marketing and Advertising, Computer Software
  • Company Size: 46% Medium, 41% Large

What Do G2 Reviewers Say About Rollstack?

AI-generated summary from verified user reviews

Pros
  • Users value the time-saving automation provided by Rollstack, significantly reducing the effort in weekly reporting.
  • Users rave about Rollstack's world-class customer support, noting their proactive assistance and quick response times.
  • Users appreciate the ease of use of Rollstack, finding it intuitive and time-saving for client reporting.
  • Users value the automation capabilities of Rollstack, which save significant time and enhance data reporting efficiency.
  • Users value the automatic updates of Rollstack presentations, streamlining workflows and enhancing efficiency in data presentation.
Cons
  • Users often experience slow loading times when using Rollstack, especially with larger slide decks.
  • Users experience slow performance with Rollstack, facing delays in data processing and occasional issues during report generation.
  • Users face limitations in storage with Rollstack, requiring manual interventions after reaching upload limits and managing filters.
  • Users find the complex setup process time-consuming, which may affect initial productivity despite future savings.
  • Users find the limited customization of capture areas a drawback, hindering flexible reporting and layout options.

What Are Recent G2 Reviews of Rollstack?

Toucan

Toucan is an AI-embedded analytics platform designed to assist independent software vendors (ISVs) and SaaS companies in integrating advanced analytics features directly into their products, eliminating the need for building these capabilities from the ground up. This platform is tailored specifically for customer-facing applications, meaning that the end users are the clients of these companies rather than internal analysts. By enabling product and operations teams to configure and deploy analytics features independently, Toucan streamlines the development process and reduces reliance on data engineering resources. The target audience for Toucan primarily includes ISVs and SaaS companies across various industries, such as fintech, HR tech, and marketing technology. These organizations often seek to enhance their product offerings with sophisticated analytics capabilities that provide value to their users. With Toucan, product teams can quickly implement features that allow end users to interact with data in meaningful ways. This is particularly beneficial for companies looking to differentiate themselves in competitive markets by offering robust analytics without the lengthy development cycles typically associated with such features. Toucan's key capabilities include conversational AI analytics, which empowers end users to pose questions in natural language and receive instant data visualizations. This feature is anchored in a governed semantic layer, ensuring that the insights provided are consistent and reliable. Additionally, the platform offers automatic dashboard generation through AI, allowing users to customize layouts, colors, and metrics without requiring technical expertise. The white-label, multi-tenant embedding options ensure that analytics seamlessly integrate into existing products, creating a native experience for users. Security and compliance are paramount in today's data-driven landscape, and Toucan addresses these concerns with row-level security and granular permissions. This ensures that each end user only accesses their specific data, making it suitable for regulated industries where data privacy is critical. Furthermore, Toucan supports connections to modern data infrastructures, such as PostgreSQL, MySQL, and AWS Redshift, and offers both SaaS and self-hosted deployment options to meet various organizational needs. The platform's no-code builder is a standout feature, enabling product and operations teams to create, edit, and publish dashboards without any coding knowledge. This capability significantly reduces dashboard development time—by up to two-thirds compared to traditional in-house builds—allowing ISVs to launch reporting modules in days instead of months. By embedding analytics as a premium feature, organizations can also create new revenue streams, enhancing their overall product value while minimizing additional development overhead. With over 350 clients already leveraging its capabilities, Toucan is positioned as a powerful solution for companies looking to enhance their analytics offerings.

Average Rating: 4.7/5.0

Total Reviews: 179

How Do G2 Users Rate Toucan?

  • Has the product been a good partner in doing business?: 9.4/10 (Category avg: 9.0/10)
  • Dashboards: 9.3/10 (Category avg: 9.0/10)
  • Steps to Answer: 8.7/10 (Category avg: 8.6/10)
  • Formats: 8.7/10 (Category avg: 8.6/10)

Who Is the Company Behind Toucan?

  • Seller: Toucan Toco
  • Year Founded: 2015
  • HQ Location: Boston, Massachusetts
  • Twitter: @Toucan_Toco
    2,402 Twitter followers
  • LinkedIn® Page: www.linkedin.com
    74 employees on LinkedIn®

Who Uses This Product?

  • Who Uses This: Data Analyst
  • Top Industries: Computer Software, Banking
  • Company Size: 43% Small, 30% Medium

What Do G2 Reviewers Say About Toucan?

AI-generated summary from verified user reviews

Pros
  • Users value the ease of use of Toucan, praising its intuitive interface and seamless integration capabilities.
  • Users benefit from easy integrations with various data sources, enhancing their analytical capabilities seamlessly.
  • Users appreciate the intuitive data visualizations of Toucan, making it easy for everyone to create insights effortlessly.
  • Users value the seamless integrations of Toucan, effectively connecting diverse data sources for insightful dashboard creations.
  • Users appreciate the no-code dashboard creation in Toucan, enhancing accessibility and integration capabilities for effective data visualization.
Cons
  • Users find the UI complexity of Toucan challenging, especially for new users trying to navigate the tool.
  • Users often find the complex usage of Toucan challenging, especially when trying to navigate its features independently.
  • Users find the learning curve steep for Toucan, citing navigation difficulties and the complex UI for newcomers.
  • Users note the limited customization options in Toucan, which sometimes restrict their desired data presentation flexibility.
  • Users face occasional bugs in Toucan that lead to higher maintenance costs and additional learning for technical development.

What Are Recent G2 Reviews of Toucan?

What Are G2 Users Discussing About Toucan?

Databox

Databox is an AI-powered business intelligence and analytics platform for teams that need clear, trusted answers fast. It helps growing companies and agencies move from dashboards to decisions by connecting directly to the tools they already use, standardizing metrics, and making performance easier to understand in the moment. Here is what teams can do with Databox: - Connect: Sync all your data from 130+ software tools, APIs, databases, or custom spreadsheets in seconds. - Prepare data: Curate, prepare, and merge raw data from multiple sources into datasets and analyze with more depth, confidence, and clarity later. - Genie, AI-Analyst: Ask questions about your performance and get clear, contextual answers in seconds. - Metrics & KPIs: Track all your company's metrics and KPIs in one place. - Dashboards: Visualize performance in real-time with interactive dashboards (custom or pre-built templates) you can share with anyone. - Reports: Create custom presentations of your data that update automatically. - Goals: Set realistic goals based on historical data, monitor your progress, then achieve them. - Forecast: Forecast what future performance will be for any metric, and see the best and worst-case scenarios. More than 20,000 growing businesses and agencies use Databox to align teams, save time, and inform predictable growth. Databox is SOC 2 certified, so your data stays secure and your team can move fast with confidence.

Average Rating: 4.4/5.0

Total Reviews: 189

How Do G2 Users Rate Databox?

  • Has the product been a good partner in doing business?: 9.0/10 (Category avg: 9.0/10)
  • Dashboards: 9.3/10 (Category avg: 9.0/10)
  • Steps to Answer: 8.9/10 (Category avg: 8.6/10)
  • Formats: 8.6/10 (Category avg: 8.6/10)

Who Is the Company Behind Databox?

  • Seller: Databox
  • Year Founded: 2012
  • HQ Location: Boston, MA
  • Twitter: @databoxHQ
    7,310 Twitter followers
  • LinkedIn® Page: www.linkedin.com
    114 employees on LinkedIn®

Who Uses This Product?

  • Who Uses This: Founder, Marketing Manager
  • Top Industries: Marketing and Advertising, Computer Software
  • Company Size: 71% Small, 21% Medium

What Do G2 Reviewers Say About Databox?

AI-generated summary from verified user reviews

Pros
  • Users enjoy the ease of use of Databox, finding it simple to implement and integrate with various tools.
  • Users appreciate the seamless integrations of Databox, facilitating easy access to crucial business metrics in one place.
  • Users appreciate the easy integrations of Databox, simplifying access to critical business metrics across multiple platforms.
  • Users praise Databox for its world-class customer support, enhancing their experience with the product significantly.
  • Users value the impressive AI summary feature of Databox, enhancing the insightfulness and timeliness of reports.
Cons
  • Users find that Databox has connection issues as it lacks integrations for specific industries, limiting its usability.
  • Users find connectivity issues as Databox lacks certain industry-specific connections, impacting its overall functionality.
  • Users find the pricing of Databox excessively high, with misleading charges leading to frustration and lost trust.
  • Users find the expensive pricing and deceptive billing practices of Databox frustrating and damaging to customer trust.
  • Users find the learning curve steep initially, which may hinder quick adaptation to Databox's features.

What Are Recent G2 Reviews of Databox?

Evisions Argos

Evisions Argos delivers the insights that you need in order to make timely, better-informed decisions. Argos helps colleges and universities work better, delivering flexible, powerful, easy-to-use reporting tools developed by higher education experts.

Average Rating: 4.2/5.0

Total Reviews: 25

How Do G2 Users Rate Evisions Argos?

  • Has the product been a good partner in doing business?: 9.2/10 (Category avg: 9.0/10)
  • Dashboards: 10.0/10 (Category avg: 9.0/10)
  • Steps to Answer: 9.2/10 (Category avg: 8.6/10)
  • Formats: 9.2/10 (Category avg: 8.6/10)

Who Is the Company Behind Evisions Argos?

  • Seller: Evisions
  • Year Founded: 1998
  • HQ Location: Houston, US
  • Twitter: @EvisionsInc
    964 Twitter followers
  • LinkedIn® Page: www.linkedin.com
    144 employees on LinkedIn®

Who Uses This Product?

  • Top Industries: Higher Education
  • Company Size: 48% Large, 48% Medium

What Are Recent G2 Reviews of Evisions Argos?

SAP Crystal Server

SAP Crystal Server is a comprehensive business intelligence (BI solution designed to empower organizations with self-service reporting and data exploration capabilities. It enables businesses to automate report distribution, provide secure access to reports from desktops or mobile devices, and manage user administration efficiently. By offering a centralized platform for report scheduling, data-driven publishing, and robust security options, SAP Crystal Server helps decision-makers access timely, accurate information, facilitating informed decision-making and operational efficiency. Key Features and Functionality: - Report Scheduling: Automate the generation and distribution of standard reports on a flexible schedule, reducing repetitive database queries and ensuring timely information delivery. - Data-Driven Publishing: Customize and distribute reports tailored to individual recipients, such as personalized invoices or statements, enhancing communication and engagement. - Security Management: Control access to reports and dashboards at user, group, object, and folder levels, ensuring that sensitive data is accessible only to authorized personnel. - Administrator Interface: Utilize a web-based central management console to configure security settings, manage user roles, and oversee the entire reporting system efficiently. Primary Value and User Solutions: SAP Crystal Server addresses the critical need for timely and accurate business information by automating report distribution and providing secure, self-service access to reports. This reduces the reporting backlog for IT departments and empowers business users to make informed decisions based on up-to-date data. The platform's robust security features ensure that sensitive information is protected, while its scalability allows organizations to manage reporting needs for a growing user base effectively. By streamlining reporting processes and enhancing data accessibility, SAP Crystal Server helps organizations improve operational efficiency and drive business success.

Average Rating: 4.5/5.0

Total Reviews: 30

How Do G2 Users Rate SAP Crystal Server?

  • Has the product been a good partner in doing business?: 8.3/10 (Category avg: 9.0/10)
  • Dashboards: 9.1/10 (Category avg: 9.0/10)
  • Steps to Answer: 8.8/10 (Category avg: 8.6/10)
  • Formats: 9.0/10 (Category avg: 8.6/10)

Who Is the Company Behind SAP Crystal Server?

  • Seller: SAP
  • Year Founded: 1972
  • HQ Location: Walldorf
  • Twitter: @SAP
    297,052 Twitter followers
  • LinkedIn® Page: www.linkedin.com
    141,955 employees on LinkedIn®
  • Ownership: NYSE:SAP

Who Uses This Product?

  • Top Industries: Information Technology and Services, Computer Software
  • Company Size: 40% Large, 37% Medium

What Are Recent G2 Reviews of SAP Crystal Server?

JMP

JMP, data analysis software for Mac and Windows, combines the strength of interactive visualization with powerful statistics. Importing and processing data is easy. The drag-and-drop interface, dynamically linked graphs, libraries of advanced analytic functionality, scripting language and ways of sharing findings with others, allows users to dig deeply into their data, with greater ease and speed. Originally developed in the 1980’s to capture the new value in GUI for personal computers, JMP remains dedicated to adding cutting-edge statistical methods and special analysis techniques from a variety of industries to the software’s functionality with each release. The organization's founder, John Sall, still serves as Chief Architect. To see a full list of data connectors please visit https://www.jmp.com/en/software/analytic-workflow/data-connectors

Average Rating: 4.5/5.0

Total Reviews: 206

How Do G2 Users Rate JMP?

  • Has the product been a good partner in doing business?: 8.9/10 (Category avg: 9.0/10)
  • Dashboards: 8.4/10 (Category avg: 9.0/10)
  • Steps to Answer: 8.4/10 (Category avg: 8.6/10)
  • Formats: 8.1/10 (Category avg: 8.6/10)

Who Is the Company Behind JMP?

  • Seller: JMP Statistical Discovery
  • Company Website:
  • Year Founded: 1989
  • HQ Location: Cary, North Carolina
  • Twitter: @JMP_software
    2,760 Twitter followers
  • LinkedIn® Page: www.linkedin.com
    1,031 employees on LinkedIn®

Who Uses This Product?

  • Who Uses This: Student
  • Top Industries: Higher Education, Information Technology and Services
  • Company Size: 42% Large, 33% Small

What Do G2 Reviewers Say About JMP?

AI-generated summary from verified user reviews

Pros
  • Users appreciate the ease of use of JMP, allowing for simple data exploration and visualization without complicated coding.
  • Users love the easy and interactive data visualization in JMP, making pattern recognition and analysis simple and efficient.
  • Users appreciate the ease of statistical analysis in JMP, enabling seamless data exploration and trend visualization.
  • Users praise JMP for its easy data visualization, allowing intuitive exploration and clear presentation of trends.
  • Users appreciate the intuitive and interactive interface of JMP, enhancing data analysis and visualization experiences seamlessly.
Cons
  • Users find JMP expensive, making it challenging for smaller users to justify its cost compared to alternatives.
  • Users note a significant learning curve with JMP, making it challenging for beginners to navigate effectively.
  • Users feel a limited flexibility in JMP, especially regarding integration and available models for analysis.
  • Users find the learning difficulty significant due to an overwhelming interface and a steep learning curve for advanced features.
  • Users find limitations in storage and model availability in JMP, hindering their multivariate analysis efforts.

What Are Recent G2 Reviews of JMP?

What Are G2 Users Discussing About JMP?

Minitab Connect

Minitab Connect is a secure, cloud-based data integration and management platform that enables organizations to access, prepare, and combine data from across their business. It connects to a wide range of data sources such as databases, cloud applications, spreadsheets, and on-premise systems so that teams can create a single, reliable source of truth for analysis and reporting. With Minitab Connect, users can automate data pipelines, clean and transform data, and deliver ready-to-use datasets directly into Minitab solutions and other business tools. This helps eliminate manual data preparation, improve data accuracy, and accelerate time to insight, empowering teams to make faster, data-driven decisions.

Average Rating: 4.5/5.0

Total Reviews: 30

How Do G2 Users Rate Minitab Connect?

  • Has the product been a good partner in doing business?: 9.2/10 (Category avg: 9.0/10)
  • Dashboards: 9.0/10 (Category avg: 9.0/10)
  • Steps to Answer: 9.0/10 (Category avg: 8.6/10)
  • Formats: 9.1/10 (Category avg: 8.6/10)

Who Is the Company Behind Minitab Connect?

  • Seller: Minitab
  • Company Website:
  • Year Founded: 1972
  • HQ Location: State College, Pennsylvania, United States
  • Twitter: @Minitab
    5,017 Twitter followers
  • LinkedIn® Page: www.linkedin.com
    732 employees on LinkedIn®

Who Uses This Product?

  • Top Industries: Information Technology and Services
  • Company Size: 57% Large, 33% Medium

What Do G2 Reviewers Say About Minitab Connect?

AI-generated summary from verified user reviews

Pros
  • Users commend Minitab Connect for its ease of use, featuring a user-friendly interface and abundant resources for learning.
  • Users appreciate the efficiency of data integration in Minitab Connect, enabling seamless access to various data sources.
  • Users appreciate the easy integrations of Minitab Connect, streamlining data access and enhancing analytical processes effortlessly.
  • Users appreciate the seamless data integration capabilities of Minitab Connect, enhancing accessibility and analysis effortlessly.
  • Users value the seamless data integration capabilities of Minitab Connect, enhancing accessibility and analysis efficiency.
Cons
  • Users find the high learning curve of Minitab Connect challenging, requiring patience and time to master effectively.
  • Users highlight a high learning difficulty with Minitab Connect, requiring patience and resources for effective use.
  • Users face challenges with poor visualization in Minitab Connect, particularly with large datasets and complex transformations.
  • Users face visualization limitations with Minitab Connect, particularly when handling large datasets and complex transformations.
  • Users find the complexity of data transformations in Minitab Connect to be slow and challenging compared to competitors.

What Are Recent G2 Reviews of Minitab Connect?

What Are G2 Users Discussing About Minitab Connect?

Reportz

Reportz is a white-label KPIs reporting software solution that helps digital marketing professionals automate and streamline client reporting processes through customizable dashboards. Reportz serves as a comprehensive reporting platform for digital marketing agencies, freelancers, and in-house marketing teams to create, manage, and deliver client-facing performance reports. It belongs to the category of marketing analytics tools specifically designed for automated reporting and data visualization. Key features and benefits include: • Customizable dashboards: Allows users to create tailored reports with relevant KPIs for each client • White-label functionality: Enables branding of reports with agency logos and color schemes • Data integration: Connects with multiple marketing platforms to aggregate data in one place • Automated reporting: Generates and sends reports on a scheduled basis without manual intervention • Client access portal: Provides clients with direct access to their live performance dashboards Reportz addresses several common challenges faced by digital marketing professionals: 1. Time-consuming manual report creation 2. Difficulty in presenting data from multiple sources cohesively 3. Lack of real-time reporting capabilities 4. Need for branded, professional-looking reports 5. Inefficient communication of marketing performance to clients The software is designed to integrate with a wide range of digital marketing tools and platforms, offering compatibility with popular analytics, advertising, and social media services. It provides a user-friendly interface that allows for quick setup and easy maintenance of client reports. Users can expect to benefit from: • Significant time savings through automated report generation • Enhanced client satisfaction with transparent, real-time reporting • Improved data visualization and storytelling capabilities • Consistent branding across all client communications • Scalability to handle reporting for multiple clients or campaigns Reportz offers flexibility in its pricing model, with plans that accommodate various team sizes and reporting needs. The platform supports unlimited users and KPIs within dashboards, allowing for comprehensive reporting without artificial limitations. By centralizing the reporting process and offering extensive customization options, Reportz enables digital marketing professionals to focus more on strategy and less on routine reporting tasks. The tool aims to streamline client communications, demonstrate marketing ROI more effectively, and provide a professional, branded reporting experience for agencies of all sizes.

Average Rating: 4.8/5.0

Total Reviews: 18

How Do G2 Users Rate Reportz?

  • Has the product been a good partner in doing business?: 10.0/10 (Category avg: 9.0/10)
  • Dashboards: 10.0/10 (Category avg: 9.0/10)
  • Steps to Answer: 10.0/10 (Category avg: 8.6/10)

Who Is the Company Behind Reportz?

  • Seller: Reportz
  • Year Founded: 2017
  • HQ Location: New York City, US
  • Twitter: @ReportzApp
    143 Twitter followers
  • LinkedIn® Page: www.linkedin.com
    2 employees on LinkedIn®

Who Uses This Product?

  • Top Industries: Marketing and Advertising
  • Company Size: 100% Small

What Do G2 Reviewers Say About Reportz?

AI-generated summary from verified user reviews

Pros
  • Users appreciate the flawless customer dashboards of Reportz, enhancing workflow and ensuring timely, professional reports for clients.
  • Users appreciate the ease of use of Reportz, benefiting from its efficient and user-friendly dashboards for reporting.
  • Users appreciate the performance efficiency of Reportz, enhancing workflow with seamless reporting and scheduling features.
  • Users love the flawless customer dashboards that enhance workflow and streamline report management for client professionalism.
  • Users appreciate the efficient and user-friendly interface of Reportz, enhancing their reporting capabilities and workflow.

What Are Recent G2 Reviews of Reportz?

What Are G2 Users Discussing About Reportz?

ATLAS.ti

Leveraged by brands and academics alike, ATLAS.ti allows anyone to analyze data and uncover valuable insights – no matter which sector you work in. From basic analysis tasks to the most in-depth research projects: With ATLAS.ti, you can easily unlock actionable findings from your qualitative and mixed methods data with intuitive research tools and best-in-class technology: • Get access to native Mac and Win apps, plus our Web version • All features and tools included in one complete software package • Save time and find insights automatically, powered by AI • Experience seamless project exchange between versions • Take advantage of real-time collaboration for teams • Share multi-user licenses with as many people as you want • Benefit from our free live support and expert training Learn more here: www.atlasti.com

Average Rating: 4.7/5.0

Total Reviews: 58

How Do G2 Users Rate ATLAS.ti?

  • Has the product been a good partner in doing business?: 9.0/10 (Category avg: 9.0/10)
  • Dashboards: 8.3/10 (Category avg: 9.0/10)
  • Steps to Answer: 8.3/10 (Category avg: 8.6/10)
  • Formats: 8.3/10 (Category avg: 8.6/10)

Who Is the Company Behind ATLAS.ti?

Who Uses This Product?

  • Top Industries: Higher Education, Research
  • Company Size: 38% Small, 33% Medium

What Do G2 Reviewers Say About ATLAS.ti?

AI-generated summary from verified user reviews

Pros
  • Users find ATLAS.ti's ease of use exceptional, enhancing their ability to analyze qualitative data effortlessly.
  • Users value the effective categorization capabilities of ATLAS.ti, enhancing qualitative data analysis for research purposes.
  • Users find ATLAS.ti to be highly efficient, significantly saving time while enhancing qualitative data analysis.
  • Users find Atlas.ti to be intuitive, easily navigating its interface thanks to helpful resources and support.
  • Users love the time-saving capabilities of ATLAS.ti, streamlining coding and analysis processes effectively.
Cons
  • Users report experiencing data inaccuracy issues, yet find solace in the responsive support from the team.
  • Users experience system errors with large datasets, but appreciate the helpful support team for assistance.
  • Users request more language support and tutorials, particularly in Spanish, to enhance their experience with ATLAS.ti.

What Are Recent G2 Reviews of ATLAS.ti?

SAP Crystal Reports

SAP Crystal Reports software is the worldwide de facto standard in desktop reporting. With SAP Crystal Reports, you can create powerful, richly formatted, dynamic reports from virtually any data source – delivered in dozens of formats, in up to 24 languages. A robust production reporting tool, SAP Crystal Reports turns almost any data source into interactive, actionable information that can be accessed offline or online, from applications, portals and mobile devices. SAP Crystal Server enables self-service access to reports, dashboards, and data exploration within a secure infrastructure.

Average Rating: 4.2/5.0

Total Reviews: 201

How Do G2 Users Rate SAP Crystal Reports?

  • Has the product been a good partner in doing business?: 7.8/10 (Category avg: 9.0/10)
  • Dashboards: 8.6/10 (Category avg: 9.0/10)
  • Steps to Answer: 8.3/10 (Category avg: 8.6/10)
  • Formats: 8.1/10 (Category avg: 8.6/10)

Who Is the Company Behind SAP Crystal Reports?

  • Seller: SAP
  • Year Founded: 1972
  • HQ Location: Walldorf
  • Twitter: @SAP
    297,052 Twitter followers
  • LinkedIn® Page: www.linkedin.com
    141,955 employees on LinkedIn®
  • Ownership: NYSE:SAP

Who Uses This Product?

  • Who Uses This: President
  • Top Industries: Information Technology and Services, Computer Software
  • Company Size: 39% Medium, 33% Large

What Do G2 Reviewers Say About SAP Crystal Reports?

AI-generated summary from verified user reviews

Pros
  • Users value the endless data visualization capabilities of SAP Crystal Reports, appreciating its vast options and integrations.
  • Users find SAP Crystal Reports to have ease of use for basic reporting, despite challenges with complex report creation.
  • Users value the easy integrations of SAP Crystal Reports across multiple databases, enhancing their reporting capabilities.
  • Users appreciate the endless capabilities of SAP Crystal Reports, enjoying numerous options and integrations for reporting.
  • Users enjoy the intuitive reporting process of SAP Crystal Reports, appreciating its versatility across multiple databases.
Cons
  • Users face compatibility issues with SAP Crystal Reports, especially regarding version requirements and limited OS support.
  • Users find the learning curve steep, requiring additional training to effectively use SAP Crystal Reports.
  • Users find SAP Crystal Reports to have a learning difficulty that necessitates additional training for proficiency.
  • Users find the limited customization in SAP Crystal Reports restricts their ability to modify and enhance reports effectively.
  • Users find the limited options in SAP Crystal Reports restrict customization, affecting report modification and interactivity.

What Are Recent G2 Reviews of SAP Crystal Reports?

What Are G2 Users Discussing About SAP Crystal Reports?

Bijou Barry
BB
Researched and written by Bijou Barry
Updated June 24, 2026