# Best Network Monitoring Software - Page 13

## How Many Network Monitoring Software Products Does G2 Track?

**Total Products under this Category:** 184

### Category Stats (Aug 2026)

- **Average Rating:** 4.5/5 (↑0.01 vs Jul 2026) The average rating of products in this category, based on all submitted ratings
- **Top Trending Product:** NetSense NMS (+5.56%) - Among all products in this category, NetSense NMS recorded the largest rating increase compared to last month

_Last updated: August 04, 2026_

## How Does G2 Rank Network Monitoring Software Products?

**Why You Can Trust G2's Software Rankings:**

- 30 Analysts and Data Experts
- 19,700+ Authentic Reviews
- 184+ Products
- Unbiased Rankings

G2's software rankings are built on verified user reviews, rigorous moderation, and a consistent research methodology maintained by a team of analysts and data experts. Each product is measured using the same transparent criteria, with no paid placement or vendor influence. While reviews reflect real user experiences, which can be subjective, they offer valuable insight into how software performs in the hands of professionals. Together, these inputs power the G2 Score, a standardized way to compare tools within every category.

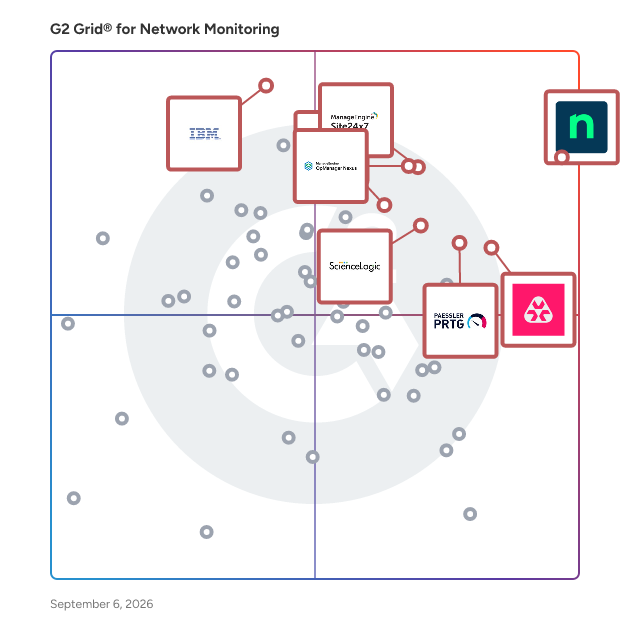
## G2 Grid® for Network Monitoring Software
 ![G2 Grid® for Network Monitoring Software plotting products by satisfaction and market presence](https://www.g2.com/categories/network-monitoring/grids.png?focus%5B%5D=25671&focus%5B%5D=13665&focus%5B%5D=17351&focus%5B%5D=16222&focus%5B%5D=10874&focus%5B%5D=17801&focus%5B%5D=2397&focus%5B%5D=39741)

Highlighted products: NinjaOne, Site24x7, OpManager Nexus, Atera, Paessler PRTG, IBM SevOne, TeamViewer, and ScienceLogic AI Platform.

Underlying data: [Grid® JSON](https://www.g2.com/categories/network-monitoring/grids.json?focus%5B%5D=ninjaone&focus%5B%5D=site24x7&focus%5B%5D=opmanager-nexus&focus%5B%5D=atera&focus%5B%5D=paessler-prtg&focus%5B%5D=ibm-sevone&focus%5B%5D=teamviewer&focus%5B%5D=sciencelogic-ai-platform)

**Sponsored**

### Datadog

Datadog is the monitoring, security and analytics platform for developers, IT operations teams, security engineers and business users in the cloud age. The SaaS platform integrates and automates infrastructure monitoring, application performance monitoring and log management to provide unified, real-time observability of our customers' entire technology stack. Datadog is used by organizations of all sizes and across a wide range of industries to enable digital transformation and cloud migration, drive collaboration among development, operations, security and business teams, accelerate time to market for applications, reduce time to problem resolution, secure applications and infrastructure, understand user behavior and track key business metrics.

[Visit website](https://www.g2.com/external_clickthroughs/record?secure%5Bad_program%5D=ppc&secure%5Bad_slot%5D=category_product_list_llm&secure%5Bcategory_id%5D=128&secure%5Bchosen_at%5D=2026-08-12T10%3A25%3A08Z&secure%5Bdisplayable_resource_id%5D=128&secure%5Bdisplayable_resource_type%5D=Category&secure%5Bmedium%5D=sponsored&secure%5Bplacement_reason%5D=page_category&secure%5Bplacement_resource_ids%5D%5B%5D=128&secure%5Bprioritized%5D=false&secure%5Bproduct_id%5D=3824&secure%5Bresource_id%5D=128&secure%5Bresource_type%5D=Category&secure%5Bsource_type%5D=category_page&secure%5Bsource_url%5D=https%3A%2F%2Fwww.g2.com%2Fcategories%2Fnetwork-monitoring%3Fpage%3D13&secure%5Btoken%5D=a089b57d8b7198187419bd1dc190a5b2e0b966e3b09a23a48f3acd672591aaea&secure%5Burl%5D=https%3A%2F%2Fwww.datadoghq.com%2Fdg%2Fmonitor%2Fdemo-request%2F%3Futm_source%3Dg2crowd%26utm_medium%3Dreview-site%26utm_campaign%3Ddg-coreplatform-multi-ww-en-coreplatform&secure%5Burl_type%5D=custom_url)

### [Verax OSS/BSS Suite](https://www.g2.com/products/verax-oss-bss-suite/reviews)

Verax NMS & APM is a network monitoring software that reduces costs of IT service delivery, shortens downtimes and increases customer satisfaction levels through streamlining processes of business service management, problem detection and resolution.

#### Who Is the Company Behind Verax OSS/BSS Suite?

- **Seller:** [Verax Systems](https://www.g2.com/sellers/verax-systems)
- **Year Founded:** 2003
- **HQ Location:** Plano, US
- **LinkedIn® Page:** [www.linkedin.com](https://www.g2.com/external_clickthroughs/record?secure%5Bsource_type%5D=product_profile&secure%5Btoken%5D=8d82306f7aaeb0d3a6cbda6561b86c588c9d7babac7bdd7e9e87a3ebb33893bc&secure%5Burl%5D=https%3A%2F%2Fwww.linkedin.com%2Fcompany%2Fverax-systems%2F&secure%5Burl_type%5D=linkedin_company_website)  
16 employees on LinkedIn®

### [Wellbase](https://www.g2.com/products/wellbase/reviews)

Detect anomalies quicker. Mobilize response teams sooner. Empower your business with a versatile cloud monitoring solution that enables you to not only track activity across your ecosystem but also coordinate your support teams as they respond to detected anomalies.

#### Who Is the Company Behind Wellbase?

- **Seller:** [Ready Computing](https://www.g2.com/sellers/ready-computing)
- **Year Founded:** 2011
- **HQ Location:** New York, US
- **LinkedIn® Page:** [www.linkedin.com](https://www.g2.com/external_clickthroughs/record?secure%5Bsource_type%5D=product_profile&secure%5Btoken%5D=4364a5aa319e3fb474bdb7b6fe7650d3bc4a1bf55a25b7f1b0f35eed84e3f0b1&secure%5Burl%5D=https%3A%2F%2Fwww.linkedin.com%2Fcompany%2Fready-computing&secure%5Burl_type%5D=linkedin_company_website)  
186 employees on LinkedIn®

### [Wyebot](https://www.g2.com/products/wyebot/reviews)

Wyebot's Wireless Intelligence Platform™ (WIP is an AI-driven solution designed to proactively eliminate Wi-Fi performance issues, ensuring seamless network operations for businesses. By continuously monitoring and analyzing network behavior, WIP identifies and resolves potential disruptions before they impact end-users, thereby enhancing overall network reliability and efficiency. Key Features and Functionality: - Proactive Issue Alerts: WIP delivers real-time notifications with root cause identification and actionable resolutions, allowing IT teams to address problems promptly. - High-Performing Networks: Utilizing synthetic end-user testing and historical analytics, WIP identifies performance trends to maintain optimal network functionality. - Remote Diagnostics: The platform enables IT professionals to monitor, analyze, and resolve network issues from any location, reducing the need for on-site visits. - Plug-and-Play Simplification: WIP's sensors are easily deployable; simply connect them to an Ethernet port with internet access, and the system self-configures to begin delivering insights. - Vendor Agnostic: Compatible with any Wi-Fi or wired device, WIP integrates seamlessly without requiring changes to existing infrastructure. - Security Breach Detection: The platform automatically detects and classifies all access points, sending instant alerts for any unauthorized devices or potential security threats. - Automatic Business Analytics: WIP provides comprehensive analytics with API and SNMPv2c support, allowing for easy export of data to inform business decisions. Primary Value and Problem Solved: WIP addresses the critical need for reliable and efficient Wi-Fi networks by automating the detection and resolution of performance issues. This proactive approach minimizes downtime, reduces the volume of Wi-Fi-related support tickets by up to 70%, and decreases the necessity for remote site visits by up to 80%. By ensuring consistent network performance, WIP enhances end-user satisfaction and supports uninterrupted business operations.

#### Who Is the Company Behind Wyebot?

- **Seller:** [Wyebot](https://www.g2.com/sellers/wyebot)
- **Year Founded:** 2016
- **HQ Location:** Marlborough, US
- **LinkedIn® Page:** [www.linkedin.com](https://www.g2.com/external_clickthroughs/record?secure%5Bsource_type%5D=product_profile&secure%5Btoken%5D=3b641d53a57c23edf9592cc2c4bde000fcf9b4e86c309539fb978146012e2670&secure%5Burl%5D=https%3A%2F%2Fwww.linkedin.com%2Fcompany%2Fwyebot-inc%2F&secure%5Burl_type%5D=linkedin_company_website)  
69 employees on LinkedIn®

### [Zscaler Digital Experience (ZDX)](https://www.g2.com/products/zscaler-digital-experience-zdx/reviews)

Zscaler Digital Experience Monitoring (ZDX) is designed to optimize digital experiences for end users by breaking traditional monitoring silos and reducing costs and complexity. Integrated into the Zscaler Zero Trust Exchange, ZDX leverages a single lightweight agent for both security and monitoring, eliminating the need for multiple, cumbersome agents and streamlining IT operations. This unified approach simplifies deployment and management while providing end-to-end visibility across devices, networks, and applications. ZDX empowers IT teams to proactively identify and resolve performance issues, minimize downtime, and optimize productivity. By pinpointing root causes—whether it’s high device CPU utilization, ISP latency, long DNS resolution times, or sluggish application response times—ZDX ensures seamless and reliable digital experiences for employees, no matter where they are working or what device or network they are using. With AI-powered capabilities like Zscaler Copilot, IT teams can gain actionable performance insights by simply asking questions—eliminating the need for deep technical expertise. This seamless integration of visibility and intelligence enables organizations to identify and resolve performance challenges faster, significantly reducing Mean Time to Resolution (MTTR). By redefining how IT teams monitor and manage digital experiences, ZDX ensures superior employee productivity and consistent access to SaaS and private apps, setting a new standard for digital experience monitoring. Key Features and Benefits: • End-to-end Visibility: ZDX provides User-to-Application visibility, offering a comprehensive view from the device level all the way to the application, including every hop across ISPs and proxies. This enables IT teams to isolate performance bottlenecks quickly, from packet loss in network hops to slow DNS or application response times, ensuring end-to-end monitoring clarity. • Quantifiable Experience Metrics: With the dynamic user experience score, organizations can measure user satisfaction across regions, departments, or applications. This data helps IT pinpoint problem areas affecting productivity and prioritize remediation. • AI-Powered Intelligence for Simplified Troubleshooting: Zscaler Copilot lets teams investigate performance issues by simply asking natural language questions, while Zscaler Copilot Playbooks deliver guided workflows that automatically diagnose issues across device, network, and application layers—streamlining problem identification and resolution. • Root Cause Insights for Faster Recovery: AI-Powered Root Cause Analysis detects performance issues like high CPU usage, ISP latency, or sluggish app response times, empowering IT teams to resolve them faster and reduce Mean Time to Resolution (MTTR). • Proactive Monitoring to Ensure Reliability: Hosted Monitoring provides 24/7 global synthetic monitoring, simulating application access to validate SLAs and uncover potential risks before users are affected. ISP Insights detect disruptions like brownouts, blackouts, or other degradations in real time, protecting user productivity. • Unified Metrics Across Core Systems: Device Health Metrics monitor critical areas such as CPU, memory, disk usage, Wi-Fi signal, and battery life to identify local device issues, while Hop-by-Hop Network Insights analyze packet loss, latency, and other network performance indicators. Application Monitoring tracks SaaS and private app performance, breaking down page load speeds, DNS times, and more for precise optimization. • Collaboration-Specific Metrics: UCaaS Monitoring ensures high-quality performance for collaboration tools like Zoom, Microsoft Teams, and Webex, tracking vital metrics such as call quality, audio/video clarity, and jitter to enhance user connectivity. • Self-Service Tools to Empower End Users: Guided Self-Service Tools allow employees to troubleshoot problems like low Wi-Fi signal or local device issues quickly—reducing IT workloads and enhancing user satisfaction. • Actionable Insights and Analytics: Data Explorer enables IT teams to generate reports and dashboards for benchmarking trends, analyzing historical patterns, and proactively optimizing future workflows. • Streamlined Incident Response: ServiceNow Integration automates ticket creation and enriches tickets with detailed device, network, or application performance data, reducing manual effort and accelerating issue resolution.

#### Who Is the Company Behind Zscaler Digital Experience (ZDX)?

- **Seller:** [Zscaler](https://www.g2.com/sellers/zscaler)
- **Year Founded:** 2008
- **HQ Location:** San Jose, California
- **Twitter:** @zscaler  
17,676 Twitter followers
- **LinkedIn® Page:** [www.linkedin.com](https://www.g2.com/external_clickthroughs/record?secure%5Bsource_type%5D=product_profile&secure%5Btoken%5D=dd48cce12739aa38dd0edad4b44a56a4154fceea224130955b1eeadec11322bf&secure%5Burl%5D=https%3A%2F%2Fwww.linkedin.com%2Fcompany%2F234625%2F&secure%5Burl_type%5D=linkedin_company_website)  
8,830 employees on LinkedIn®
- **Ownership:** NASDAQ:ZS

- [&lsaquo; Prev‹ Prev](/categories/network-monitoring?order=g2_score&page=12#product-list)
- [1](/categories/network-monitoring?order=g2_score#product-list)
- [2](/categories/network-monitoring?order=g2_score&page=2#product-list)
- …
- [9](/categories/network-monitoring?order=g2_score&page=9#product-list)
- [10](/categories/network-monitoring?order=g2_score&page=10#product-list)
- [11](/categories/network-monitoring?order=g2_score&page=11#product-list)
- [12](/categories/network-monitoring?order=g2_score&page=12#product-list)
- 13
- Next &rsaquo;Next ›

Spotlight Categories

[Talent Assessment Software](https://www.g2.com/categories/talent-assessment-software)

[Board Management Software](https://www.g2.com/categories/board-management)

[Digital Experience Platforms (DXP)](https://www.g2.com/categories/digital-experience-platforms-dxp)

[Help Desk Software](https://www.g2.com/categories/help-desk)

[Generative AI Infrastructure Software](https://www.g2.com/categories/generative-ai-infrastructure)

Similar Categories

- [AI Agent Observability](/categories/ai-agent-observability)
- [Application Performance Monitoring (APM)](/categories/application-performance-monitoring-apm)
- [Cloud Infrastructure Monitoring](/categories/cloud-infrastructure-monitoring)
- [Database Monitoring](/categories/database-monitoring)

- [Enterprise Monitoring](/categories/enterprise-monitoring)
- [Hardware Monitoring](/categories/hardware-monitoring)
- [Log Monitoring](/categories/log-monitoring)
- [Observability Pipeline](/categories/observability-pipeline)

- [Observability Software](/categories/observability-software)
- [Other Monitoring](/categories/other-monitoring)
- [Website Monitoring](/categories/website-monitoring)

[Browse Network Monitoring Themes](/categories/network-monitoring/themes)

 ![Tian Lin](/assets/transparent-ad5be28fbcd25b7b08d2cebe1d957125437fb5407d75ee717965ad22c8808791.gif "Tian Lin")
TL

Researched and written by [Tian Lin](https://research.g2.com/insights/author/tian-lin)

Updated April 1, 2025

Network monitoring software tracks, analyzes, and manages the performance, availability, and security of IT networks. This is managed across on-premises, cloud, and hybrid environments. Such tools provide real-time visibility into network infrastructure, enabling IT teams, managed service providers (MSP), and DevOps teams to detect failures, optimize performance, and enhance security.


Network monitoring solutions use simple network management protocol (SNMP), syslog monitoring, API-based tracking, and agent-based monitoring to collect performance data from routers, switches, firewalls, internet of things (IoT) devices, and cloud-based networks. Some tools also include flow-based traffic analysis (NetFlow, sFlow, jFlow, IPFIX), Deep Packet Inspection (DPI), and encrypted traffic analysis to identify bottlenecks and security threats.


Modern network monitoring tools support hybrid and cloud-based environments, including [SD-WAN solutions](https://www.g2.com/categories/sd-wan), [business virtual private network (VPN) software](https://www.g2.com/categories/business-vpn), cloud interconnects, [container networking software](https://www.g2.com/categories/container-networking), and service meshes (AWS, Azure, GCP).


Many integrate with IT infrastructure [monitoring software](https://www.g2.com/categories/monitoring), [application performance monitoring (APM) software](https://www.g2.com/categories/application-performance-monitoring-apm), and [network security software](https://www.g2.com/categories/network-security) for a unified observability approach. AI-driven analytics and automation enhance anomaly detection, root cause analysis, and predictive performance optimization, reducing downtime and improving network reliability. Advanced solutions also offer [zero trust software](https://www.g2.com/categories/zero-trust) analytics, DDoS detection, and IDS/IPS integration for network security monitoring.


To qualify for inclusion in the Network Monitoring category, a product must:

 
- Monitor network devices in real time, including routers, switches, firewalls, cloud networks, and IoT
- Provide automated alerts and notifications for performance issues and security risks
- Analyze network traffic and performance using SNMP, flow-based monitoring, DPI, or encrypted traffic analysis 
- Monitor hybrid and cloud-based environments, including SD-WAN, VPNs, and multi-cloud networking
- Support AI-driven analytics and automation for network optimization and security threat detection
- Offer auto-discovery, topology mapping, historical analytics, and compliance monitoring for visibility and troubleshooting

Show More