Best Marketing Analytics Tools - Page 49

Last updated: April 23, 2026

How Many Marketing Analytics Software Products Does G2 Track?

Total Products under this Category: 925

Category Stats (Nov 2026)

  • Average Rating: 4.53/5 The average rating of products in this category, based on all submitted ratings
  • Top Trending Product: Oviond (+10.4%) - Among all products in this category, Oviond recorded the largest rating increase compared to last month

Last updated: November 01, 2026

How Does G2 Rank Marketing Analytics Software Products?

Why You Can Trust G2's Software Rankings:

  • 30 Analysts and Data Experts
  • 114,000+ Authentic Reviews
  • 925+ Products
  • Unbiased Rankings

G2's software rankings are built on verified user reviews, rigorous moderation, and a consistent research methodology maintained by a team of analysts and data experts. Each product is measured using the same transparent criteria, with no paid placement or vendor influence. While reviews reflect real user experiences, which can be subjective, they offer valuable insight into how software performs in the hands of professionals. Together, these inputs power the G2 Score, a standardized way to compare tools within every category.

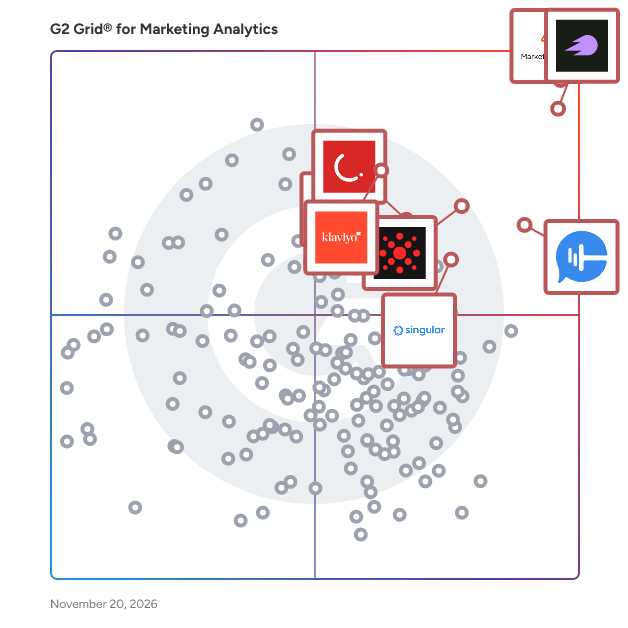
G2 Grid® for Marketing Analytics Software

G2 Grid® for Marketing Analytics Software plotting products by satisfaction and market presence

Highlighted products: HubSpot Marketing Hub, Semrush, CallRail, impact.com, Klaviyo, CleverTap, Funnel, and Singular.

Underlying data: [Grid® JSON](https://www.g2.com/categories/marketing-analytics/grids.json?focus%5B%5D=hubspot-marketing-hub&focus%5B%5D=semrush&focus%5B%5D=callrail&focus%5B%5D=impact-com&focus%5B%5D=klaviyo&focus%5B%5D=clevertap&focus%5B%5D=funnel&focus%5B%5D=singular)

Nielsen Media Impact

Nielsen Media Impact is a comprehensive cross-media planning solution designed to help advertisers, agencies, and media owners optimize their media strategies across various platforms, including TV, connected TV (CTV), digital, and audio. By leveraging granular consumer data, it enables users to simulate strategies, optimize budgets, and improve reach and frequency, ensuring that every impression delivers stronger results and every campaign drives higher return on investment (ROI). Key Features and Functionality: - Cross-Platform Media Planning: Facilitates the creation and analysis of media plans across multiple channels, allowing for the comparison of various scenarios and budget allocations to maximize cross-media planning effectiveness. - Advanced Audience Insights: Provides detailed audience engagement metrics, including incremental reach and time-spent data, to identify where target consumers are most active, aiding in smarter media decisions. - Scenario Simulation and Optimization: Enables users to simulate different media strategies, adjust reach and frequency, and reallocate budgets to ensure optimal campaign performance. - Integration of Streaming Data: Incorporates streaming consumption data from connected TV sets, offering a more holistic view of cross-platform media planning and allowing for better understanding of the full audience reach across TV, digital, radio, print, out-of-home, and streaming channels. Primary Value and User Solutions: Nielsen Media Impact addresses the complexities of modern media consumption by providing a unified platform for cross-media planning. It empowers users to make data-driven decisions, optimize media mixes, and achieve efficient audience targeting. By offering insights into audience behavior and media consumption patterns, it helps in identifying the most effective channels and strategies, ultimately enhancing campaign effectiveness and maximizing ROI.

Who Is the Company Behind Nielsen Media Impact?

  • Seller: Nielsen
  • HQ Location: New York, NY
  • LinkedIn® Page: www.linkedin.com
    29,150 employees on LinkedIn®
  • Ownership: NYSE:NLSN
  • Total Revenue (USD mm): $6,290

Nielsen Podcast Solutions

Nielsen Podcast Solutions is a comprehensive suite of tools designed to help marketers, content creators, and media owners understand and engage with podcast audiences effectively. As podcast consumption and advertising revenue continue to rise, these solutions provide critical insights into listener behaviors, enabling users to reach the right consumers and drive return on investment (ROI). Key Features and Functionality: - Discover: Offers descriptive metadata to enhance searchability, discovery, and recommendations for podcast content. - Plan: Assists in connecting brands with specific podcast programs and genres, facilitating targeted advertising strategies. - Activate: Utilizes cross-device data to create addressable audience segments, optimizing promotional efforts for advertisers. - Optimize: Measures the impact of ad exposure on brand health metrics, allowing for continuous improvement of advertising campaigns. Primary Value and User Solutions: Nielsen Podcast Solutions addresses the growing need for sophisticated tools to navigate the expanding podcast market. By providing a framework that spans from discovery to optimization, it empowers users to: - Gain a holistic understanding of podcast listener behaviors. - Effectively plan and execute targeted advertising campaigns. - Optimize media plans by specific podcast networks, genres, and top programs. This comprehensive approach ensures that advertisers can create their plans with confidence, leveraging data-driven insights to maximize the effectiveness of their campaigns.

Who Is the Company Behind Nielsen Podcast Solutions?

  • Seller: Nielsen
  • HQ Location: New York, NY
  • LinkedIn® Page: www.linkedin.com
    29,150 employees on LinkedIn®
  • Ownership: NYSE:NLSN
  • Total Revenue (USD mm): $6,290

Nielsen Sales Lift

Nielsen Sales Lift is a comprehensive solution designed to measure the direct impact of advertising campaigns on actual sales across various media channels. By linking media expenditures to incremental sales, it provides marketers with a clear understanding of their campaigns' return on investment (ROI). This enables data-driven decisions to optimize marketing strategies and drive revenue growth. Key Features and Functionality: - Incrementality Measurement: Goes beyond mere correlation to assess the true cause-and-effect relationship between advertising efforts and sales outcomes. - Cross-Media Analysis: Evaluates campaign effectiveness across multiple platforms, including digital, linear TV, connected TV (CTV), and retail media, offering a holistic view of performance. - Granular Precision: Utilizes Nielsen's extensive media consumption data and rigorous methodologies to link ad exposure with verified online and offline purchase data, ensuring high-confidence insights. - Actionable Insights: Provides always-on dashboards, AI integrations, and intuitive reporting tools to facilitate rapid activation of smarter media strategies. Primary Value and User Solutions: Nielsen Sales Lift empowers marketers to: - Prove Campaign Effectiveness: Demonstrate the tangible impact of advertising efforts on sales, validating the true ROI of campaigns across all channels. - Optimize Media Strategies: Identify which campaigns, channels, and audiences are delivering real results, allowing for the elimination of waste and reinforcement of successful tactics. - Drive Revenue Growth: Transform insights into outcomes by optimizing for sales rather than clicks, ensuring more efficient use of advertising budgets and enhanced revenue generation. By providing a clear and quantifiable link between advertising spend and sales performance, Nielsen Sales Lift enables marketers to make informed decisions that enhance the effectiveness of their campaigns and contribute to overall business growth.

Who Is the Company Behind Nielsen Sales Lift?

  • Seller: Nielsen
  • HQ Location: New York, NY
  • LinkedIn® Page: www.linkedin.com
    29,150 employees on LinkedIn®
  • Ownership: NYSE:NLSN
  • Total Revenue (USD mm): $6,290

AI can help you find the answers. G2 helps you trust them.

Connect G2 to Claude or ChatGPT for answers grounded in G2's trusted reviews, comparisons, and pricing from real user insights.

How it works

Nielsen Streaming Measurement

Nielsen Streaming Measurement provides comprehensive insights into streaming audiences, enabling content creators, distributors, and advertisers to understand consumer viewing behaviors across various platforms. By analyzing performance metrics from streaming services down to specific programs, Nielsen's solutions inform programming, content distribution, and advertising strategies, ensuring optimal engagement and return on investment. Key Features and Functionality: - Performance by Streaming Service: Offers a macro view of consumer engagement with streaming platforms, detailing what content is streamed, viewing durations, devices used (such as smart TVs, connected devices, and video game consoles), and the streaming source applications. - Streaming Program Measurement: Provides measurement of programs and episodes viewed through top streaming platforms, enabling the development of comprehensive audience profiles for both linear and connected TV (CTV) devices. - CTV Advertising Optimization: Delivers real-time CTV advertising personalization by predicting the most likely viewers on the CTV screen, facilitating more relevant advertisements. - Cross-Platform & Intraplatform Insights: Covers in-home video streaming on mobile, computer devices, and TV screens to provide a holistic view of engagement across different devices. Additionally, it offers detailed insights into ad-supported versus non-ad-supported subscription tiers across major Streaming Video on Demand (SVOD) providers. - Comprehensive Viewer Data: Provides detailed, person-level insights into streaming viewership across various platforms, allowing for analysis of time periods and program/episode data broken out by app. Primary Value and User Solutions: Nielsen Streaming Measurement empowers stakeholders in the streaming ecosystem by offering accurate, data-driven insights into audience behaviors and content performance. This enables content creators to tailor programming to viewer preferences, distributors to optimize content delivery strategies, and advertisers to enhance targeting and personalization efforts. By leveraging Nielsen's robust methodologies and extensive data coverage, users can make informed decisions that maximize engagement, reach, and return on investment in the dynamic streaming landscape.

Who Is the Company Behind Nielsen Streaming Measurement?

  • Seller: Nielsen
  • HQ Location: New York, NY
  • LinkedIn® Page: www.linkedin.com
    29,150 employees on LinkedIn®
  • Ownership: NYSE:NLSN
  • Total Revenue (USD mm): $6,290

Nielsen U.S. National/Local TV Measurement

Nielsen's U.S. National and Local TV Measurement solutions provide comprehensive insights into television viewership across the United States. By integrating data from 45 million households and 75 million devices, including cable and satellite set-top boxes and smart TVs, Nielsen delivers accurate metrics on audience engagement. This extensive coverage enables media buyers and sellers to understand who is watching TV, what content they are consuming, and how often they tune in, facilitating informed decisions in the dynamic media landscape. Key Features and Functionality: - Extensive Data Integration: Combines high-quality panel data with big data from various devices to provide a holistic view of TV viewership. - Comprehensive Coverage: Measures audience engagement across 210 local designated market areas (DMAs), capturing viewing habits in diverse regions. - Inclusive Metrics: Accounts for co-viewing scenarios and reflects how audiences gather to watch linear TV, whether live, recorded via DVR, or on-demand. - Diverse Viewing Platforms: Identifies viewing that occurs in and out of the home, as well as over-the-air, streaming, and over-the-top (OTT) platforms. - Granular Audience Insights: Provides person-level metrics that represent multicultural communities, inclusive of age, gender, race, ethnicity, income, and presence of children. Primary Value and User Solutions: Nielsen's measurement solutions empower media buyers and sellers to transact with confidence by offering reliable data on audience engagement. Media buyers can efficiently allocate their budgets, ensuring advertising messages reach the right consumers at the right time. Media sellers can effectively price and manage inventory, showcasing their capacity to reach incremental audiences and helping advertisers amplify their brand. By eliminating guesswork with gold-standard data, Nielsen enables informed decisions and drives meaningful results in the complex TV ecosystem.

Who Is the Company Behind Nielsen U.S. National/Local TV Measurement?

  • Seller: Nielsen
  • HQ Location: New York, NY
  • LinkedIn® Page: www.linkedin.com
    29,150 employees on LinkedIn®
  • Ownership: NYSE:NLSN
  • Total Revenue (USD mm): $6,290

Nítida

a

Who Is the Company Behind Nítida?

  • Seller: Nitida
  • Year Founded: 2025
  • HQ Location: Rio de Janeiro, BR
  • LinkedIn® Page: www.linkedin.com
    1 employees on LinkedIn®

Nuira

Nuira is a decision layer for ecommerce brands. It connects to Shopify, Google Ads, Meta Ads and Klaviyo, then analyzes orders, margin, COGS and ad spend together to show exactly what to change next to earn more profit: move budget between campaigns, pause ads that are not paying for themselves, or stop selling products below margin. Every recommendation is ranked by expected impact in euros and carries a confidence score, so teams know what to act on first instead of digging through dashboards. Nuira is read-only by design; it never modifies your store or ad accounts, it only tells you what to do.

Who Is the Company Behind Nuira?

Octoix

Octoix: All Your Ad Campaign Data, One Simple Hub Tired of jumping between ad platforms, spreadsheets, and reporting tools to figure out what’s working? So were we. That’s why we built Octoix - a centralized analytics solution that combines all your advertising data in one easy-to-use dashboard. Octoix connects your ad accounts (Google Ads, Meta, LinkedIn, and more) in minutes, giving you a single source of truth for performance tracking, comparison, and optimization. No coding. No switching tabs. No messy exports. Why users love Octoix: No-code setup - Get started in minutes. Just connect your accounts and go. Clear visual reporting - Instantly see what’s performing and where you can improve. Cross-platform comparisons - Compare ROAS, CPC, conversions, and more across all your campaigns. Designed for productivity - Built for marketers who need fast, actionable insights - not just pretty graphs. A free trial is available. Try it risk-free and see if it fits your workflow. Whether you're a freelance marketer, part of a lean startup team, or working at a full-service agency, Octoix simplifies your ad reporting process and gives you the clarity you need to make smarter decisions, faster. 🤖 AI Expert slashes waste and boosts ROAS. 📄 Create custom PDF reports instantly. 💡 Try it free now! 🔥 Only 49€ (was 120€) – act fast! We created Octoix for ourselves - and for every digital advertiser who’s tired of data chaos. Give it a try. Your future self will thank you. – The Octoix Team! 🐙

Who Is the Company Behind Octoix?

  • Seller: Octoix
  • Year Founded: 2025
  • HQ Location: Tarragona, ES
  • LinkedIn® Page: www.linkedin.com
    6 employees on LinkedIn®

Odins.ai

Odins.ai is a marketing investment platform built on Bayesian marketing mix modeling (MMM). It answers the questions every marketing budget raises: how much to spend, where to put it, and what happens when conditions change. Odins integrates your marketing and sales data, online and offline, and models the real relationship between spend and business results. The model updates monthly with current data and delivers specific recommendations: where to invest more, where to pull back, and what to test when the data is uncertain. Every channel gets a response curve and a marginal ROAS, so you can see what spending a little more in each channel would return before you commit. The platform is fully managed. The Odins team handles the integrations, builds and maintains the models, and reviews every recommendation before it reaches you. No data science team required. Outputs are tailored to each audience, from board-level budget scenarios to channel-level plans. Odins fits any company with a marketing budget above EUR 1M a year and a sales signal the model can learn from. Companies like CDON, Nettbil, Aprila Bank and Megaflis run their marketing budgets on Odins.

Who Is the Company Behind Odins.ai?

Odyssey Attribution

Multi-touch attribution, Integrated with Google Analytics. Odyssey provides you with Actionable insights such as suggested ad spend and incrementality index. After importing your cost data, you can see your under- or overspend per channel, campaign, keyword, etc. All we need to get started is Google Analytics, setup is done in 2 minutes.

Who Is the Company Behind Odyssey Attribution?

Onclusive

Onclusive is the unified media intelligence platform for PR, communications and marketing teams. It brings together media monitoring, social listening, media relations, analytics and AI search visibility, helping organizations understand the conversations shaping their brand, act on what they learn and prove the impact of their work. The Onclusive Unified Platform connects these capabilities in one experience, with one login and a consistent way to work across teams. A developing story can be tracked through media monitoring, explored through analytics, shared with colleagues and used to inform outreach. With connected workflows and consistent data standards, teams have a single source of truth for understanding coverage and reporting on results. At the heart of the platform is the Global Content Hub, the world’s largest integrated media content database. It brings together content from online, print, broadcast and social media and enriches it to help teams find the signals that matter. This breadth of coverage gives organizations a clear and trusted view of what is being said, who is driving the conversation and how it is changing across markets and channels. Onclusive’s media monitoring tools help teams track coverage and breaking news, follow competitors and identify emerging issues. Social listening adds insight into audience conversations, sentiment and trends. Together, these capabilities help teams protect reputation, respond to potential crises and find opportunities to join relevant conversations. For media relations, Onclusive provides tools to find relevant journalists, organize contacts, manage outreach and build relationships. Teams can move from spotting a story to reaching the right people, while keeping their media activity connected to the wider picture. Analytics, dashboards and reporting help teams assess coverage, benchmark competitors, measure campaigns and communicate results to stakeholders. Onclusive also offers managed monitoring, press reviews and expert insight for organizations that need additional analysis or support. Teams can choose the combination of self-service tools and services that fits the way they work. As brand discovery shifts toward AI, Onclusive GEO Analytics helps teams understand how their brand appears in AI-generated answers. It tracks visibility across leading AI platforms, compares performance with competitors and

Average Rating: 4.3/5.0

Total Reviews: 203

How Do G2 Users Rate Onclusive?

  • Has the product been a good partner in doing business?: 8.9/10 (Category avg: 9.3/10)

Who Is the Company Behind Onclusive?

  • Seller: Onclusive
  • Company Website:
  • Year Founded: 2002
  • HQ Location: London, GB
  • LinkedIn® Page: www.linkedin.com
    1,112 employees on LinkedIn®

Who Uses This Product?

  • Who Uses This: Communications Manager
  • Top Industries: Public Relations and Communications, Information Technology and Services
  • Company Size: 37% Medium, 35% Small

What Do G2 Reviewers Say About Onclusive?

AI-generated summary from verified user reviews

Pros
  • Users appreciate the ease of use of Onclusive, finding the interface and features intuitive and enjoyable.
  • Users commend Onclusive for its intuitive real-time reports, enhancing social listening and media analytics across multiple channels.
  • Users value the superior media monitoring capabilities of Onclusive, enjoying detailed insights and efficient tracking.
  • Users appreciate the advanced analytics provided by Onclusive, transforming PR monitoring into insightful and actionable intelligence.
  • Users value the intuitive interface and comprehensive search features, enhancing their media outreach and PR efficiency.
Cons
  • Users express concerns about the inaccurate engagement metrics, which can hinder effective analysis of social media conversations.
  • Users are frustrated with the inaccuracy of metrics in Onclusive, impacting analysis and reporting across platforms.
  • Users find limited coverage in Onclusive, often missing important media mentions and struggling to automate saving coverage.
  • Users find Onclusive's interface not intuitive, navigating through drafts and features can be cumbersome and frustrating.
  • Users find incomplete media coverage with Onclusive, as engagement metrics and certain reports lack accuracy and comprehensiveness.

What Are Recent G2 Reviews of Onclusive?

What Are G2 Users Discussing About Onclusive?

Onclusive Social

Onclusive Social is a cutting-edge social media intelligence platform that empowers marketing, PR, and communications teams to turn social media data into strategic insights. Our platform helps organizations make data-driven decisions that elevate their communications strategies and deliver measurable results, with unparalleled coverage across all major social networks, including LinkedIn and TikTok. Onclusive Social delivers the comprehensive social intelligence organizations need to drive business success. Our global presence and complete social media view enable teams to deeply understand brand conversations, analyze sentiment in real-time, and develop impactful strategies that set them apart from competitors. Learn more at https://onclusive.com/what-we-do/monitoring/social-listening/

Average Rating: 4.5/5.0

Total Reviews: 203

How Do G2 Users Rate Onclusive Social?

  • Has the product been a good partner in doing business?: 8.8/10 (Category avg: 9.3/10)

Who Is the Company Behind Onclusive Social?

  • Seller: Onclusive
  • Year Founded: 2002
  • HQ Location: London, GB
  • LinkedIn® Page: www.linkedin.com
    1,112 employees on LinkedIn®

Who Uses This Product?

  • Who Uses This: Social Media Manager
  • Top Industries: Marketing and Advertising, Information Technology and Services
  • Company Size: 35% Large, 33% Small

What Do G2 Reviewers Say About Onclusive Social?

AI-generated summary from verified user reviews

Pros
  • Users find the LinkedIn analytics of Onclusive Social very helpful and incredibly useful for their needs.
  • Users find the LinkedIn analytics in Onclusive Social to be exceptionally beneficial and practical for their needs.
  • Users find the LinkedIn analytics in Onclusive Social to be very helpful and incredibly useful for their needs.
Cons
  • Users find the platform to be difficult to learn, particularly struggling with query setup and usability.
  • Users find the difficult setup of Onclusive Social cumbersome, impacting their overall experience with the platform.
  • Users find the difficult usability of Onclusive Social frustrating, with complex query setups hindering their experience.
  • Users find the lack of clarity on Onclusive Social makes it challenging to navigate and set up queries.
  • Users find the learning curve steep with Onclusive Social, making it challenging to set up queries easily.

What Are Recent G2 Reviews of Onclusive Social?

What Are G2 Users Discussing About Onclusive Social?

Onehashlink

Marketers, Ad Agencies, Startups, Founders, Affiliates & Product Managers, if you want to measure performance of all your online & offline marketing campaign in one dashboard, then we provide one unique link to use in your campaign to view and track their engagement across all different OS, Platforms & screens. Try now - Onehashlink

Who Is the Company Behind Onehashlink?

Oppin

Oppin (www.oppin.ai) is Generative Engine Optimization and AI Search Visibility platform that helps businesses measure, improve, and grow their visibility across AI-powered search engines and assistants, including ChatGPT, Google AI, Gemini, Claude, Perplexity, Grok, and Microsoft Copilot. The platform enables companies to track how often their brand appears in AI-generated answers, monitorcompetitors, analyze citations and sources, measure share of voice, and identify the prompts that influence buying decisions. Oppin also provides actionable recommendations to improve AI visibility, helping businesses optimize their websites and digital presence for the next generation of search. Built for marketing teams, SEO agencies, Digital Marketing agencies, PR professionals and agencies, and companies in general. Oppin gives organizations the insights they need to understand how AI models perceive their brand and to increase their presence in AI-driven customer journeys.

Who Is the Company Behind Oppin?

Optimizely

NetSpring brings the modeling flexibility and exploratory power of BI to self-service product analytics, working directly off any cloud data warehouse. NetSpring was founded in late 2019 by industry thought leaders Vijay Ganesan, Priyendra Deshwal, and Satyam Shekhar. The founders were previously part of the founding team at ThoughtSpot, now a leader in the BI space. The company is headquartered in Redwood City, California. Key Functionality: - Self-serve answers to any question, starting from a rich library of product analytics reports, with the ability to pivot seamlessly back and forth between any report and ad hoc visual data exploration - Combine product instrumentation with any business data in your data warehouse for context-rich analytics - Avoid writing and maintaining complex SQL for funnel/path-type queries, but have the option of leveraging SQL for specialized analysis Key Benefits: - Full Business Context: Access any data in the warehouse. Deeply understand the drivers of retention, referrals, and revenue. - Privacy & Security: Your customer data never leaves the warehouse. Maintain a single governed source of truth. - Cost & Maintenance: Simply connect to the warehouse and self-serve. No data movement. Cost not tied to event volume.

Average Rating: 4.3/5.0

Total Reviews: 3

How Do G2 Users Rate Optimizely?

  • Has the product been a good partner in doing business?: 10.0/10 (Category avg: 9.3/10)

Who Is the Company Behind Optimizely?

  • Seller: NetSpring
  • Year Founded: 2019
  • HQ Location: Redwood City, US
  • LinkedIn® Page: www.linkedin.com
    12 employees on LinkedIn®

Who Uses This Product?

  • Company Size: 67% Medium, 33% Small

What Are Recent G2 Reviews of Optimizely?

Alanna Iwuh
A
Researched and written by Alanna Iwuh