Best Data Visualization Tools - Page 8

How Many Data Visualization Tools Products Does G2 Track?

Total Products under this Category: 478

Category Stats (Aug 2026)

  • Average Rating: 4.43/5 The average rating of products in this category, based on all submitted ratings
  • Top Trending Product: Supersimple (+0.89%) - Among all products in this category, Supersimple recorded the largest rating increase compared to last month

Last updated: August 04, 2026

How Does G2 Rank Data Visualization Tools Products?

Why You Can Trust G2's Software Rankings:

  • 30 Analysts and Data Experts
  • 26,100+ Authentic Reviews
  • 478+ Products
  • Unbiased Rankings

G2's software rankings are built on verified user reviews, rigorous moderation, and a consistent research methodology maintained by a team of analysts and data experts. Each product is measured using the same transparent criteria, with no paid placement or vendor influence. While reviews reflect real user experiences, which can be subjective, they offer valuable insight into how software performs in the hands of professionals. Together, these inputs power the G2 Score, a standardized way to compare tools within every category.

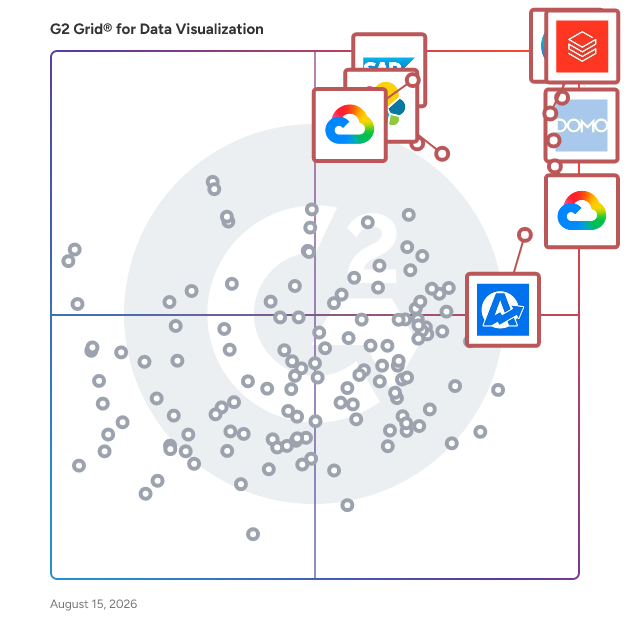
G2 Grid® for Data Visualization Tools

G2 Grid® for Data Visualization Tools plotting products by satisfaction and market presence

Highlighted products: Canva, Databricks, Domo, Looker, Data Studio, Elastic Stack, SAP HANA Cloud, and AgencyAnalytics.

Underlying data: [Grid® JSON](https://www.g2.com/categories/data-visualization-tools/grids.json?focus%5B%5D=canva&focus%5B%5D=databricks&focus%5B%5D=domo&focus%5B%5D=looker&focus%5B%5D=data-studio&focus%5B%5D=elastic-stack&focus%5B%5D=sap-hana-cloud-2025-10-01&focus%5B%5D=agencyanalytics)

Sponsored

ZapDigits

ZapDigits is a modern marketing dashboard and client reporting platform built for agencies, freelancers, and marketing teams that want clear insights without complexity. As a powerful alternative to AgencyAnalytics, ZapDigits helps you centralize your marketing data and streamline reporting across all your campaigns. With ZapDigits, you can connect multiple data sources, track key performance metrics, and create clean, professional client reports in minutes. Instead of switching between tools or managing spreadsheets, everything lives in one intuitive dashboard designed for speed and simplicity. ZapDigits is built to make marketing reporting easier, faster, and more actionable. Whether you’re managing multiple clients, running campaigns, or delivering performance reports, it gives you real-time visibility into what’s working and where to optimize. If you're looking for an AgencyAnalytics alternative that is lightweight, flexible, and easy to use, ZapDigits is designed to help you save time and deliver better results for your clients.

Visit website

Node

Discover our innovative approach to the cloud, designed to deliver an optimal online business management experience. Our secure, scalable, and powerful platform gives you real-time access to your data and management tools, wherever you are and on all your devices. Redefine the limits of collaborative work.

Average Rating: 4.2/5.0

Total Reviews: 27

How Do G2 Users Rate Node?

  • Has the product been a good partner in doing business?: 8.0/10 (Category avg: 9.0/10)
  • Dashboards: 8.8/10 (Category avg: 9.0/10)
  • Steps to Answer: 8.1/10 (Category avg: 8.6/10)
  • Formats: 8.4/10 (Category avg: 8.6/10)

Who Is the Company Behind Node?

Who Uses This Product?

  • Top Industries: Computer Software
  • Company Size: 41% Small, 30% Large

What Are Recent G2 Reviews of Node?

VT Insights

Improve Customer Experience with Team Insights. See usage for teams and users. Help support plain language program rollout across your organization - Understand which users and teams are actively scoring - Drive better adoption by helping inactive users and teams with plain language education and hand holding - Roll out to thousands of users across geographies Measure quality improvement across all organization assets, both offline and online - Real-time visibility into how key metrics like grade level are trending - View Improvement by team and by user, share reports - Flag pockets of content that are too complex See which teams and writers may be using non-compliant language - Make sure all writers use language as specified in your style-guide - Pinpoint out of date T&Cs, old product names, prohibited and off-brand language ​- Export usage reports to writers for feedback, education, and behavior change

Average Rating: 4.3/5.0

Total Reviews: 13

How Do G2 Users Rate VT Insights?

  • Has the product been a good partner in doing business?: 9.2/10 (Category avg: 9.0/10)
  • Dashboards: 9.0/10 (Category avg: 9.0/10)
  • Steps to Answer: 8.7/10 (Category avg: 8.6/10)
  • Formats: 8.7/10 (Category avg: 8.6/10)

Who Is the Company Behind VT Insights?

  • Seller: VisibleThread
  • Year Founded: 2008
  • HQ Location: Baltimore, MD
  • Twitter: @VisibleThread
    1,469 Twitter followers
  • LinkedIn® Page: www.linkedin.com
    67 employees on LinkedIn®

Who Uses This Product?

  • Top Industries: Information Technology and Services
  • Company Size: 57% Medium, 29% Large

What Do G2 Reviewers Say About VT Insights?

AI-generated summary from verified user reviews

Pros
  • Users value the automation of manual tasks in VT Insights, enhancing clarity and supporting informed decision-making.
  • Users value the effective visualization features of VT Insights, enhancing analytics and content strategy clarity.
  • Users value the ease of use in creating content, enhancing the overall effectiveness of their processes.
  • Users value the easy content creation from VT Insights, enhancing process effectiveness across all assets and devices.
  • Users praise the performance efficiency of VT Insights, facilitating seamless and effective communication across teams.
Cons
  • Users find the interface overly complex, leading to confusion and complicating their overall experience with VT Insights.
  • Users find VT Insights expensive for small businesses, making it challenging for some to invest in the product.
  • Users find the interface navigation complicated, making it challenging to efficiently utilize VT Insights.
  • Users struggle with a steep learning curve for VT Insights, making initial navigation challenging for newcomers.
  • Users find the limited customization options in VT Insights reports restrict their ability to tailor data effectively.

What Are Recent G2 Reviews of VT Insights?

Software AG CONNX

Software AG’s CONNX provides data integration from the mainframe to the cloud. It uniquely provides standard SQL data access to non-relational data sources (e.g., VSAM, IMS) in just minutes. View data in a meaningful way whether via the desktop to handle queries or to visualize key business metrics on a mobile device. CONNX provides data access, data virtualization, and data movement solutions.

Average Rating: 4.6/5.0

Total Reviews: 10

Who Is the Company Behind Software AG CONNX?

  • Seller: Software GmbH
  • Year Founded: 1969
  • HQ Location: Darmstadt, Hessen
  • Twitter: @SoftwareAG
    32,269 Twitter followers
  • LinkedIn® Page: www.linkedin.com
    1,857 employees on LinkedIn®
  • Ownership: ETR: SOW

Who Uses This Product?

  • Top Industries: Information Technology and Services
  • Company Size: 100% Small

What Are Recent G2 Reviews of Software AG CONNX?

Supersimple

Supersimple is an AI-native business intelligence platform that answers questions using both your data and your company's knowledge: metrics, tables, and documents, all at once. It connects to your data warehouse, data and code context (dbt, GitHub) and to the tools where your knowledge lives (Slack, Notion, Google Drive, Confluence, and more). Every answer is grounded with citations and no-code steps, instead of difficult-to-read code & queries. Governed semantic data models create a single source of truth, while ensuring flexible and reliable self-service.

Average Rating: 4.4/5.0

Total Reviews: 15

How Do G2 Users Rate Supersimple?

  • Has the product been a good partner in doing business?: 8.3/10 (Category avg: 9.0/10)
  • Dashboards: 9.4/10 (Category avg: 9.0/10)
  • Steps to Answer: 8.8/10 (Category avg: 8.6/10)
  • Formats: 9.1/10 (Category avg: 8.6/10)

Who Is the Company Behind Supersimple?

Who Uses This Product?

  • Company Size: 73% Small, 20% Medium

What Do G2 Reviewers Say About Supersimple?

AI-generated summary from verified user reviews

Pros
  • Users find Supersimple's ease of use transformative, enabling all team members to access and understand data effortlessly.
  • Users highlight the simplicity and transformation Supersimple brings to data exploration for all team members.
  • Users highlight the seamless AI integration of Supersimple, enhancing analytics and usability for effortless management.
  • Users value the easy data exploration capabilities of Supersimple, enabling team-wide understanding regardless of coding skills.
  • Users praise the implementation ease of Supersimple, enabling frequent use and seamless integration into their workflow.
Cons
  • Users find the pricing to be expensive, especially challenging for startups seeking budget-friendly solutions.
  • Users find the cost of Supersimple to be too high for startups, making it difficult for early-stage companies to adopt.
  • Users express concern about the limitations of the Pro version, which restricts access to key functionalities.

What Are Recent G2 Reviews of Supersimple?

Calculator Studio

Calculator Studio lets you create and publish interactive website calculators using familiar spreadsheet logic. There's no need to code—just build using the skills you already have! Simply connect your existing spreadsheets or create from scratch, and turn your data into stylish, functional tools that engage your audience. Whether it's helping users explore pricing models or showing savings or ROI calculations, Calculator Studio makes it easy. You can also integrate these calculators into your lead-generation process, capture user inputs, and send the results to your CRM. Empower your audience with smart tools that educate and drive conversions.

Average Rating: 4.6/5.0

Total Reviews: 15

How Do G2 Users Rate Calculator Studio?

  • Has the product been a good partner in doing business?: 8.9/10 (Category avg: 9.0/10)
  • Dashboards: 8.7/10 (Category avg: 9.0/10)
  • Steps to Answer: 9.3/10 (Category avg: 8.6/10)
  • Formats: 7.8/10 (Category avg: 8.6/10)

Who Is the Company Behind Calculator Studio?

Who Uses This Product?

  • Company Size: 47% Small, 40% Medium

What Do G2 Reviewers Say About Calculator Studio?

AI-generated summary from verified user reviews

Pros
  • Users love the speed and accuracy of Calculator Studio, allowing for quick calculations across devices.
  • Users value the automation capabilities of Calculator Studio, streamlining tasks with a variety of integrated calculators.
  • Users find the collaborative sharing capabilities of Calculator Studio invaluable for simplifying complex data presentations among teams.
  • Users enjoy the flexibility and accessibility of Calculator Studio, enhancing their productivity with various calculator options.
  • Users love the customizability of Calculator Studio, allowing seamless integration and diverse calculation options for efficient usage.
Cons
  • Users find the complex setup of Calculator Studio intimidating, especially in advanced calculation menus for beginners.
  • Users find the difficult navigation in Calculator Studio intimidating, especially for those new to the software.
  • Users find the difficult setup challenging, especially those not familiar with software installation processes.
  • Users find the installation process difficult for those not familiar with software, despite the product's overall quality.
  • Users find the pricing to be quite expensive, particularly for smaller teams and individual users seeking alternatives.

What Are Recent G2 Reviews of Calculator Studio?

Oracle Business Intelligence Mobile

The only mobile app that gives you a full range of BI functionally, from interactive dashboards to location intelligence, and lets you initiate business processes right from your mobile device.

Average Rating: 3.3/5.0

Total Reviews: 11

How Do G2 Users Rate Oracle Business Intelligence Mobile?

  • Has the product been a good partner in doing business?: 6.7/10 (Category avg: 9.0/10)

Who Is the Company Behind Oracle Business Intelligence Mobile?

  • Seller: Oracle
  • Year Founded: 1977
  • HQ Location: Austin, TX
  • Twitter: @Oracle
    827,997 Twitter followers
  • LinkedIn® Page: www.linkedin.com
    208,078 employees on LinkedIn®
  • Ownership: NYSE:ORCL

Who Uses This Product?

  • Company Size: 55% Large, 36% Medium

What Are Recent G2 Reviews of Oracle Business Intelligence Mobile?

amCharts

amCharts is a set of programming libraries and tools for all your data visualization needs on the web. amCharts JavaScript product lineup includes classic charts like Line, Area, Column, Bar, Pie, XY, Scatter, Candlestick and OHLC as well as more “exotic” ones like Gauges, Funnels, GANTT, Stock Chart to display large amounts of financial and other date-based data, and fully interactive adaptive world or local country maps. Fully functional products are available for free (with a small backlink) for any type of use, as well as in paid commercial form for all kinds of usage scenarios.

Average Rating: 4.4/5.0

Total Reviews: 13

How Do G2 Users Rate amCharts?

  • Has the product been a good partner in doing business?: 8.8/10 (Category avg: 9.0/10)
  • Dashboards: 10.0/10 (Category avg: 9.0/10)
  • Steps to Answer: 8.3/10 (Category avg: 8.6/10)
  • Formats: 9.2/10 (Category avg: 8.6/10)

Who Is the Company Behind amCharts?

  • Seller: amCharts
  • Year Founded: 2007
  • HQ Location: Vilnius, Lithuania
  • Twitter: @amcharts
    1,756 Twitter followers
  • LinkedIn® Page: www.linkedin.com
    1 employees on LinkedIn®

Who Uses This Product?

  • Company Size: 54% Small, 31% Medium

What Are Recent G2 Reviews of amCharts?

What Are G2 Users Discussing About amCharts?

Sourcetable — AI spreadsheet & data analyst

Sourcetable is an AI spreadsheet and data platform that helps you do better, faster work. It's great for analyzing files, cleaning or enriching data, research, data visualizations, reporting, business intelligence, and much more. Sourcetable is a new kind of spreadsheet with all the same formulas and functions as Excel or Google sheets, as well as data connections to 100+ databases and applications, and helps you pair with the latest AI models to become more productive and data driven.

Average Rating: 4.5/5.0

Total Reviews: 11

How Do G2 Users Rate Sourcetable — AI spreadsheet & data analyst?

  • Has the product been a good partner in doing business?: 10.0/10 (Category avg: 9.0/10)

Who Is the Company Behind Sourcetable — AI spreadsheet & data analyst?

  • Seller: Sourcetable
  • Year Founded: 2019
  • HQ Location: San Francisco
  • Twitter: @SourcetableApp
    233 Twitter followers
  • LinkedIn® Page: www.linkedin.com
    5 employees on LinkedIn®

Who Uses This Product?

  • Company Size: 58% Medium, 25% Small

What Do G2 Reviewers Say About Sourcetable — AI spreadsheet & data analyst?

AI-generated summary from verified user reviews

Pros
  • Users find the user-friendly interface of Sourcetable enhances navigation and simplifies data analysis tasks.
  • Users appreciate the AI assistant feature of Sourcetable, enhancing data analysis and making insights more accessible.
  • Users value the powerful visualization options in Sourcetable, enhancing data presentation and insight generation effortlessly.
  • Users praise the AI capabilities of Sourcetable, enhancing data analysis and reducing manual labor significantly.
  • Users value the real-time collaboration capabilities, enabling seamless data analysis and insights without advanced skills.
Cons
  • Users feel there are limited customization options, hindering their ability to fine-tune visual elements in Sourcetable.
  • Users find the limited features in Sourcetable's starter plan restricts advanced customization and flexibility options.
  • Users highlight limited flexibility in advanced features and customization options, impacting their experience with complex data analysis.
  • Users feel that the visualization options are limited, hindering their ability to fully customize their data presentations.
  • Users find feeding dynamic data to the Sourcetable challenging, complicating their overall experience with the product.

What Are Recent G2 Reviews of Sourcetable — AI spreadsheet & data analyst?

Colabo

Colabo is a sales acceleration platform that harnesses next-generation engagement channels like LinkedIn, Twitter and Meetup for prospecting and engaging new leads. Sales Representatives can create customized messages that resonate, and achieve increased response rates. Sales Teams have access to live accurate data and the ability to engage with prospects through modern channels and Sales Team Managers have a view into their teams social prospecting activities.

Average Rating: 4.5/5.0

Total Reviews: 15

How Do G2 Users Rate Colabo?

  • Has the product been a good partner in doing business?: 9.2/10 (Category avg: 9.0/10)
  • Dashboards: 10.0/10 (Category avg: 9.0/10)
  • Steps to Answer: 10.0/10 (Category avg: 8.6/10)
  • Formats: 10.0/10 (Category avg: 8.6/10)

Who Is the Company Behind Colabo?

  • Seller: Colabo
  • Year Founded: 2010
  • HQ Location: San Carlos, California
  • Twitter: @Colaboinc
    617 Twitter followers
  • LinkedIn® Page: www.linkedin.com
    10 employees on LinkedIn®

Who Uses This Product?

  • Top Industries: Computer Software
  • Company Size: 40% Small, 33% Large

What Are Recent G2 Reviews of Colabo?

What Are G2 Users Discussing About Colabo?

VisioChart

VisioChart provides custom visuals & charts for Power BI. Turn data into clear, meaningful insights with our advanced charting solutions.

Average Rating: 4.2/5.0

Total Reviews: 46

How Do G2 Users Rate VisioChart?

  • Has the product been a good partner in doing business?: 8.1/10 (Category avg: 9.0/10)
  • Dashboards: 8.3/10 (Category avg: 9.0/10)
  • Steps to Answer: 8.1/10 (Category avg: 8.6/10)
  • Formats: 8.8/10 (Category avg: 8.6/10)

Who Is the Company Behind VisioChart?

Who Uses This Product?

  • Top Industries: Financial Services, Information Technology and Services
  • Company Size: 41% Medium, 35% Small

What Do G2 Reviewers Say About VisioChart?

AI-generated summary from verified user reviews

Pros
  • Users appreciate the ease of use of VisioChart, enabling effortless creation of visualizations and flowcharts.
  • Users love the easy creation process of VisioChart, allowing impressive results without advanced design skills.
  • Users love the wide variety of diagram types in VisioChart, simplifying complex information visualization effectively.
  • Users love the collaborative sharing features of VisioChart, enabling real-time co-editing and easy distribution of visuals.
  • Users value the easy integrations of VisioChart, finding it user-friendly for creating impressive displays effortlessly.
Cons
  • Users face insufficient information due to lack of integration with Ceridian Dayforce, complicating data synchronization.
  • Users find the inferior interface navigation of VisioChart less impressive compared to competitors, leading to usability frustrations.

What Are Recent G2 Reviews of VisioChart?

Blastpoint

Acquire more customers within your service area and make smarter data-driven site selection decisions for optimal market penetration. Increase sales by finding and targeting potential customers that fit your ideal profile. Heatmap any number of custom factors to find optimal markets for your brand. Generate comparative reports for any territories easily and in seconds.

Average Rating: 4.5/5.0

Total Reviews: 12

How Do G2 Users Rate Blastpoint?

  • Has the product been a good partner in doing business?: 10.0/10 (Category avg: 9.0/10)
  • Dashboards: 9.4/10 (Category avg: 9.0/10)
  • Steps to Answer: 8.1/10 (Category avg: 8.6/10)
  • Formats: 8.8/10 (Category avg: 8.6/10)

Who Is the Company Behind Blastpoint?

  • Seller: BlastPoint
  • Year Founded: 2016
  • HQ Location: Pittsburgh, Pennsylvania
  • Twitter: @blastpointinc
    525 Twitter followers
  • LinkedIn® Page: www.linkedin.com
    70 employees on LinkedIn®

Who Uses This Product?

  • Company Size: 58% Medium, 33% Small

What Do G2 Reviewers Say About Blastpoint?

AI-generated summary from verified user reviews

Pros
  • Users value the helpful customer support of Blastpoint, ensuring a smooth experience for all users.
  • Users value the ease of use of Blastpoint, making powerful analytics accessible to everyone, regardless of expertise.
  • Users appreciate the flexibility of Blastpoint, balancing simplicity with advanced features for effective marketing campaigns.
  • Users appreciate the balance between simplicity and power in BlastPoint, allowing effective usage for all skill levels.
  • Users appreciate the time-saving efficiency of BlastPoint, enabling quick access to powerful insights without the need for expertise.
Cons
  • Users find BlastPoint to be relatively expensive, making it challenging for smaller businesses and startups with tight budgets.

What Are Recent G2 Reviews of Blastpoint?

Powerslide

Simplify the analysis and communication of your data, with a simple, interactive and efficient platform. Both intuitive and design, thanks to Powerslide, you can create your KPIs and data visualization in just a few clicks to stage them through a report, a dashboard, or an infographic to make them easier to understand. Powerslide is a: - An intuitive interface designed for business - A wide choice of data visualisations - A collaborative mode - Automated updates - Several connectors: CSV, Excel, Denodo, Snowflake, Google Sheets, API Rest, Zapier, Oracle, SQL Server, PostgreSQL, MySQL, Clickhouse…

Average Rating: 4.6/5.0

Total Reviews: 26

How Do G2 Users Rate Powerslide?

  • Has the product been a good partner in doing business?: 8.6/10 (Category avg: 9.0/10)
  • Dashboards: 8.7/10 (Category avg: 9.0/10)
  • Steps to Answer: 8.8/10 (Category avg: 8.6/10)
  • Formats: 8.3/10 (Category avg: 8.6/10)

Who Is the Company Behind Powerslide?

  • Seller: Datarocks
  • Year Founded: 2014
  • HQ Location: Saint-Denis, RE
  • Twitter: @powerslideApp
    78 Twitter followers
  • LinkedIn® Page: www.linkedin.com
    1 employees on LinkedIn®

Who Uses This Product?

  • Top Industries: Marketing and Advertising
  • Company Size: 44% Medium, 37% Small

What Are Recent G2 Reviews of Powerslide?

What Are G2 Users Discussing About Powerslide?

Displayr

Displayr is an all-in-one analysis and reporting software designed to help market researchers quickly find and share powerful data stories. 1. Quicker project completion. 2. Handle tasks in-house that you'd typically outsource. 3. Simplified generation of engaging, auto-updating reports and dashboards. 4. Enhanced quality control. With Displayr, you have a singular platform for analysis, visualization, reporting, and dashboarding. Whether it's MaxDiff, Conjoint, Market Segmentation, Customer Feedback, Brand Research, or advanced features like auto-updating, interactive dashboards, and cutting-edge machine learning and text coding, Displayr has it all.

Average Rating: 4.2/5.0

Total Reviews: 11

How Do G2 Users Rate Displayr?

  • Has the product been a good partner in doing business?: 10.0/10 (Category avg: 9.0/10)
  • Dashboards: 8.3/10 (Category avg: 9.0/10)
  • Steps to Answer: 7.8/10 (Category avg: 8.6/10)
  • Formats: 7.6/10 (Category avg: 8.6/10)

Who Is the Company Behind Displayr?

  • Seller: Displayr
  • HQ Location: Pyrmont, New South Wales
  • Twitter: @Displayrr
    499 Twitter followers
  • LinkedIn® Page: www.linkedin.com
    95 employees on LinkedIn®

Who Uses This Product?

  • Company Size: 55% Small, 27% Medium

What Are Recent G2 Reviews of Displayr?

What Are G2 Users Discussing About Displayr?

NVivo

NVivo is the leading qualitative and mixed-methods analysis platform, designed to turn unstructured data into evidence-based insights by unifying coding, querying, and AI-assisted analysis. It enables researchers to organize and interpret interviews, focus groups, and surveys, compare findings across cases and themes, and visualize results– ensuring that insights meet the rigor required for publications, evaluations, and grant proposals. The most cited QDA software in academic publications worldwide (Scopus Database, 2010–2025), NVivo has supported scholars, teams, and institutions across social sciences, education, health, and public policy for over 30 years.

Average Rating: 4.0/5.0

Total Reviews: 134

How Do G2 Users Rate NVivo?

  • Has the product been a good partner in doing business?: 7.5/10 (Category avg: 9.0/10)
  • Dashboards: 5.6/10 (Category avg: 9.0/10)
  • Steps to Answer: 5.0/10 (Category avg: 8.6/10)
  • Formats: 5.6/10 (Category avg: 8.6/10)

Who Is the Company Behind NVivo?

  • Seller: Lumivero
  • Company Website:
  • Year Founded: 1995
  • HQ Location: Denver, CO
  • Twitter: @LUMIVER0
    399 Twitter followers
  • LinkedIn® Page: www.linkedin.com
    296 employees on LinkedIn®

Who Uses This Product?

  • Who Uses This: Research Assistant
  • Top Industries: Higher Education, Research
  • Company Size: 47% Small, 33% Large

What Do G2 Reviewers Say About NVivo?

AI-generated summary from verified user reviews

Pros
  • Users find NVivo to be a user-friendly and efficient system that greatly enhances qualitative research workflows.
  • Users find NVivo to enhance efficiency in qualitative research, making data organization and analysis effortless and insightful.
  • Users find NVivo's data analysis features invaluable for organizing and visualizing complex qualitative research data effectively.
  • Users appreciate the analysis accuracy of NVivo, significantly enhancing the depth and clarity of their research outcomes.
  • Users praise the rich analytics capabilities of NVivo, enhancing the depth and clarity of qualitative research outcomes.
Cons
  • Users find NVivo to be not user-friendly, with a confusing interface and frustrating customer service hindering productivity.
  • Users experience poor customer support with NVivo, facing slow responses and frustrating policies that hinder timely assistance.
  • Users experience slow performance with NVivo, causing frustration and hindering efficient access to research data.
  • Users face significant compatibility issues between Windows and iOS, complicating collaboration and causing overall frustration.
  • Users find the interface confusing and experience steep learning curves, complicating their research efforts with NVivo.

What Are Recent G2 Reviews of NVivo?

What Are G2 Users Discussing About NVivo?

Custom Charts for Jira and Confluence Reporting

Customised Jira Reporting A consistent display makes at a glance data visualization with Jira reports easy. Want your RAG status charts to actually be red, amber, and green? Choose the colors you need for every segment of your Jira reports. Reorder your reports however makes sense to you. Merge and hide segments with a simple click and drag interface to make the charts you need. Whether you’re keeping on brand or supporting your colorblind teammate, everyone can now easily make great looking Jira Reports with a few simple clicks (no coding, nor training required). Powerful Jira Dashboard Gadgets Use saved filters, standard or advanced custom Jira Query Language (JQL), or the simple click and drag interface to make the charts you need. ​ Custom Tables, Pie Charts, Bar Charts​ and 2-Dimensional Stacked and Grouped Charts work with all the standard and custom fields in your Jira (including Status, Priority, and Assignee). Chart by Issues, Story Points, and Time Estimated, Remaining or Spent, as well as any calculated scripted number fields. Real-Time Jira Visualization Get immediate updates with real-time data reporting on Jira Dashboards or Confluence Pages. Avoid exporting data to third-party servers, and avoid another silo by letting everyone work and share real-time updates in the tools they’re already working in. Custom Charts for Jira and Confluence Reports is powerful and easy enough for everyone to want to use. Make Jira the reporting dashboard for every team.

Average Rating: 4.5/5.0

Total Reviews: 13

How Do G2 Users Rate Custom Charts for Jira and Confluence Reporting?

  • Has the product been a good partner in doing business?: 10.0/10 (Category avg: 9.0/10)
  • Dashboards: 8.1/10 (Category avg: 9.0/10)
  • Steps to Answer: 7.1/10 (Category avg: 8.6/10)
  • Formats: 7.9/10 (Category avg: 8.6/10)

Who Is the Company Behind Custom Charts for Jira and Confluence Reporting?

  • Seller: Old Street Solutions
  • Year Founded: 2018
  • HQ Location: London, London
  • Twitter: @OldStreetApps
    582 Twitter followers
  • LinkedIn® Page: linkedin.com
    7 employees on LinkedIn®

Who Uses This Product?

  • Company Size: 46% Small, 31% Large

What Are Recent G2 Reviews of Custom Charts for Jira and Confluence Reporting?

Bijou Barry
BB
Researched and written by Bijou Barry
Updated June 24, 2026