Best Data Visualization Tools - Page 50

How Many Data Visualization Tools Products Does G2 Track?

Total Products under this Category: 759

Category Stats (Nov 2026)

  • Average Rating: 4.44/5 The average rating of products in this category, based on all submitted ratings
  • Top Trending Product: Upsolve AI (+1.75%) - Among all products in this category, Upsolve AI recorded the largest rating increase compared to last month

Last updated: November 01, 2026

How Does G2 Rank Data Visualization Tools Products?

Why You Can Trust G2's Software Rankings:

  • 30 Analysts and Data Experts
  • 41,800+ Authentic Reviews
  • 759+ Products
  • Unbiased Rankings

G2's software rankings are built on verified user reviews, rigorous moderation, and a consistent research methodology maintained by a team of analysts and data experts. Each product is measured using the same transparent criteria, with no paid placement or vendor influence. While reviews reflect real user experiences, which can be subjective, they offer valuable insight into how software performs in the hands of professionals. Together, these inputs power the G2 Score, a standardized way to compare tools within every category.

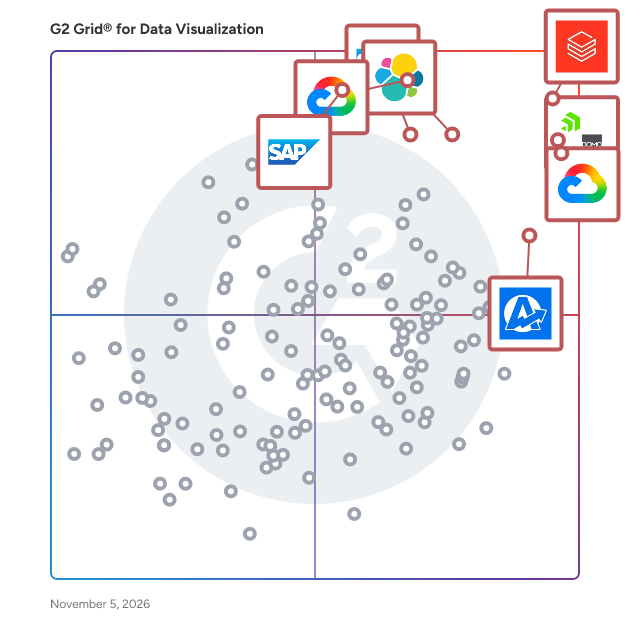
G2 Grid® for Data Visualization Tools

G2 Grid® for Data Visualization Tools plotting products by satisfaction and market presence

Highlighted products: Databricks, Domo, Looker, Data Studio, Elastic Stack, AgencyAnalytics, SAP HANA Cloud, and SAP Analytics Cloud.

Underlying data: [Grid® JSON](https://www.g2.com/categories/data-visualization-tools/grids.json?focus%5B%5D=databricks&focus%5B%5D=domo&focus%5B%5D=looker&focus%5B%5D=data-studio&focus%5B%5D=elastic-stack&focus%5B%5D=agencyanalytics&focus%5B%5D=sap-hana-cloud-2025-10-01&focus%5B%5D=sap-analytics-cloud)

Vizta

Vizta is a next-generation business intelligence (BI) and data visualization platform designed to empower organizations of all sizes to make smarter, faster, and more data-driven decisions. Built to overcome the limitations of traditional spreadsheets and outdated BI systems, Vizta provides a seamless, intuitive interface for handling large-scale transactional databases with ease. Key features include: Drag-and-Drop Analytics Real-Time Data Integration AI-Powered Insights Custom Visualizations High Performance With Vizta, decision-makers no longer need to rely on limited reporting tools or face Excel's row restrictions. Its intuitive design, powerful analytics, and seamless integration make it the ultimate solution for transforming raw data into impactful business strategies.

Who Is the Company Behind Vizta?

  • Seller: Viz Labs
  • Year Founded: 2023
  • HQ Location: Gurgaon, IN
  • LinkedIn® Page: www.linkedin.com
    7 employees on LinkedIn®

Vizydrop

Vizydrop is a data visualization software that simplify visual data discovery and share charts.

Who Is the Company Behind Vizydrop?

Vizzly

Vizzly provides a low-code solution for building customer-facing dashboards, offering the same level of flexibility as an in-house development process with minimal technical overhead required. With Vizzly, you have the capability to connect to any SQL database or API and seamlessly embed the dashboard as a React or Vue component. Since the product is highly extensible through code, you will have complete control over the product and the user experience you create.

Average Rating: 5.0/5.0

Total Reviews: 13

How Do G2 Users Rate Vizzly?

  • Has the product been a good partner in doing business?: 10.0/10 (Category avg: 9.0/10)

Who Is the Company Behind Vizzly?

  • Seller: Vizzly
  • Year Founded: 2022
  • HQ Location: London, GB
  • LinkedIn® Page: www.linkedin.com
    1 employees on LinkedIn®

Who Uses This Product?

  • Top Industries: Computer Software
  • Company Size: 92% Small, 8% Medium

What Are Recent G2 Reviews of Vizzly?

AI can help you find the answers. G2 helps you trust them.

Connect G2 to Claude or ChatGPT for answers grounded in G2's trusted reviews, comparisons, and pricing from real user insights.

How it works

Vizzu

Vizzu is an AI-powered data visualization and storytelling tool designed to transform complex datasets into engaging, animated narratives. By seamlessly integrating data analysis, visualization, and storytelling, Vizzu enables users to uncover insights and present them in a compelling manner without the need for extensive technical expertise. Its intuitive interface allows for real-time data exploration and the creation of dynamic presentations that captivate audiences. Key Features and Functionality: - Visual Data Analysis: Users can intuitively aggregate, sort, filter, compare, and drill down into data, all while experiencing smooth, animated transitions that enhance understanding. - Automated Storytelling: Vizzu converts analytical processes into a sequence of animated slides, elevating data storytelling to new heights and making complex information more accessible. - Interactive Presentations: The platform allows for seamless switching between presenting and editing modes, enabling users to address questions on the spot and foster interactive discussions. - Easy Data Upload and Analysis: Users can upload data and immediately uncover patterns and trends without relying on pivot tables or complex formulas. - Integration with Google Sheets: Vizzu offers an add-on for Google Sheets, bringing visual data analysis and animated narratives directly into spreadsheets for a more integrated workflow. Primary Value and User Solutions: Vizzu addresses the challenge of making data presentations more engaging and comprehensible. Traditional static charts and dashboards often fail to capture audience attention or convey the full story behind the numbers. By providing animated data stories, Vizzu helps users effectively communicate insights, ensuring that their message resonates and sticks with the audience. This capability is particularly valuable for business professionals who need to present complex data in a clear and impactful way, facilitating better decision-making and understanding.

Who Is the Company Behind Vizzu?

Vumi

Vumi is a wealth management software that provides service to Investment Service Companies (ISCs), offering a comprehensive and unified view of their clients' investments. With advanced technology and an intuitive, modern interface, Vumi enables financial advisors to consolidate and visualize data from multiple sources. Additionally, it allows them to analyze the performance and risks of their clients' portfolios.

Who Is the Company Behind Vumi?

  • Seller: Vumi
  • Year Founded: 2022
  • HQ Location: Gijón, ES
  • LinkedIn® Page: www.linkedin.com
    8 employees on LinkedIn®

Watershed

Watershed is the enterprise sustainability AI platform. Companies like Airbnb, Carlyle Group, FedEx, Visa, and Dr. Martens use Watershed to measure, report, and act on their emissions—producing audit-ready carbon footprints that drive real decarbonization. Purpose-built AI agents accelerate every step, from data cleaning and emissions factor mapping to report drafting, while embedded climate intelligence and human review ensure results you can stand behind. Named a leader in the Verdantix 2026 Green Quadrant and a CDP-accredited gold solutions provider, Watershed now manages more than 3 gigatonnes of CO2e emissions through our customers. Key features: - Measurement: More than 60 pre-built integrations and a library of 500,000+ emissions factors, benchmarks, and methodologies deliver granular, audit-ready carbon footprints across your entire business—down to individual products and suppliers. - Reporting: Prepare and file sustainability disclosures across global frameworks, including ISSB, CDP, CSRD, TCFD, California SB253/261, and more. AI agents draft reports in the right format using your data, with full data lineage, peer benchmarks, review workflows, and change tracking. - Sustainability AI: Purpose-built AI agents automate data cleaning, formatting, and analysis—getting teams to actionable data up to 80% faster. Watershed Product Footprints uses AI to decompose purchased goods into their underlying materials and processes, so procurement and sustainability teams can compare suppliers, run what-if scenarios, and surface real reduction levers. All AI is built with encoded sustainability intelligence, multi-agent safeguards for accuracy, full transparency into how results are calculated, and human control at every step. - Decarbonization: Develop a sustainability plan, model SBT-aligned targets, and track progress against them. Identify the highest-impact reduction levers across your operations and supply chain. Switch to clean power through virtual power purchase agreements, and access a marketplace of scientifically vetted, high-quality carbon removal and avoidance projects. - Security and compliance: Enterprise-grade API, data governance, user access controls, and SOC 1 and SOC 2 compliance on a cloud-based platform. What Watershed solves: For most companies, the majority of emissions sit in their supply chains—and until recently, that data was either too slow or too imprecise to act on. Watershed gives sustainability and procurement teams a single platform to measure with precision, meet evolving disclosure requirements, and build a credible decarbonization plan. Sustainability AI built on climate science surfaces reduction opportunities that traditional approaches miss, while connecting sustainability data to real business decisions like procurement, energy sourcing, and supplier engagement.

Average Rating: 4.5/5.0

Total Reviews: 25

Who Is the Company Behind Watershed?

  • Seller: Watershed
  • Company Website:
  • Year Founded: 2019
  • HQ Location: San Francisco, CA
  • LinkedIn® Page: www.linkedin.com
    642 employees on LinkedIn®

Who Uses This Product?

  • Company Size: 84% Large, 8% Medium

What Are Recent G2 Reviews of Watershed?

watsonx BI Assistant

IBM watsonx BI Assistant is an AI-powered business analyst and advisor designed to provide rapid, insightful answers to business questions. By leveraging advanced artificial intelligence, it enables users to understand past events, predict future outcomes, and receive actionable recommendations, all through a user-friendly, conversational interface. This empowers business users to make confident decisions swiftly, without the need for complex dashboards or extensive data analysis expertise. Key Features and Functionality: - Natural Language Interaction: Users can ask questions in everyday language and receive immediate, contextually relevant answers, eliminating the need for specialized training or technical skills. - AI-Driven Analytics: The assistant not only diagnoses past events but also predicts future trends and prescribes actionable strategies, offering a comprehensive analytical perspective. - Transparent Reasoning: Provides clear, step-by-step explanations of its analyses, ensuring users understand the basis of its insights and fostering trust in the decision-making process. - Semantic Automation: Automates data profiling, business term matching, and data modeling, reducing manual effort and enhancing data consistency across the organization. - Advanced Data Visualization: Offers customizable visualizations that can be tailored through conversational and graphical interactions, aiding in the clear communication of complex data. - Integration with Existing Tools: Seamlessly connects with platforms like Slack and Microsoft Teams, allowing users to access insights within their existing workflows and collaboration tools. Primary Value and User Solutions: Watsonx BI Assistant addresses the common challenge of complex and time-consuming data analysis by simplifying the process through AI-driven, natural language interactions. It democratizes access to business intelligence, enabling users across various roles to obtain timely and accurate insights without relying on data specialists. This leads to faster decision-making, improved operational efficiency, and a more agile response to business challenges. By providing a single source of truth through a centralized metrics catalog, it ensures data consistency and governance, enhancing the reliability of business insights.

Who Is the Company Behind watsonx BI Assistant?

  • Seller: IBM
  • Year Founded: 1911
  • HQ Location: Armonk, New York, United States
  • LinkedIn® Page: www.linkedin.com
    344,328 employees on LinkedIn®
  • Ownership: SWX:IBM
  • Phone: 1-866-277-7488

Waydev

Waydev is the leading Software Engineering Intelligence platform, trusted by Fortune 500 companies to measure engineering performance and accelerate delivery. We go beyond basic DORA metrics by providing over 130+ actionable insights across productivity, quality, DevOps performance, process hygiene, and team health. Our platform integrates seamlessly with Git, Jira, and CI/CD tools, giving engineering leaders full visibility into how their teams deliver software. With predictive analytics, benchmarking, and AI-powered recommendations, Waydev helps organizations improve velocity, reduce bottlenecks, and align engineering with business outcomes. Founded in 2017 and backed by Y Combinator, Waydev is the only scalable solution built for enterprises that need reliable, data-driven insights into software delivery. Companies like American Express, Dropbox, and Citibank trust Waydev to turn engineering data into business impact.

Average Rating: 4.7/5.0

Total Reviews: 63

How Do G2 Users Rate Waydev?

  • Has the product been a good partner in doing business?: 9.7/10 (Category avg: 9.0/10)

Who Is the Company Behind Waydev?

  • Seller: Waydev
  • Company Website:
  • Year Founded: 2017
  • HQ Location: San Francisco, California
  • LinkedIn® Page: www.linkedin.com
    41 employees on LinkedIn®

Who Uses This Product?

  • Who Uses This: CTO
  • Top Industries: Computer Software, Information Technology and Services
  • Company Size: 65% Small, 29% Medium

What Do G2 Reviewers Say About Waydev?

AI-generated summary from verified user reviews

Pros
  • Users appreciate the ease of integration with existing tools, enhancing performance tracking and visibility in engineering teams.
  • Users value the clear visibility into team performance offered by Waydev, enabling data-driven decisions and improved efficiency.
  • Users value the excellent visibility into engineering operations provided by Waydev, enhancing team performance insights.
  • Users value Waydev for its clear visibility into engineering performance, enabling actionable insights and enhanced workflow efficiency.
  • Users appreciate the clear visibility into performance that Waydev offers, enhancing tracking and decision-making across teams.
Cons
  • Users note metrics issues in Waydev, finding individual developer metrics cluttered and DevEx surveys needing flexibility.
  • Users find the individual developer metrics cluttered and not useful, detracting from the overall experience of Waydev.
  • Users find that access control requires more updates and improvements to align with industry standards effectively.
  • Users find the dashboard flexibility lacking, suggesting improvements for better integration and user experience.
  • Users find the difficult learning curve of Waydev to be more time-consuming than expected when getting started.

What Are Recent G2 Reviews of Waydev?

What Are G2 Users Discussing About Waydev?

WebDataRocks

WebDataRocks is a free web reporting tool, designed to offer fast data visualization online minutes after integration.

Average Rating: 3.5/5.0

Total Reviews: 2

Who Is the Company Behind WebDataRocks?

Who Uses This Product?

  • Company Size: 100% Small

What Are G2 Users Discussing About WebDataRocks?

Wet Dog Weather

Wet Dog Weather processes weather data to provide comprehensive visualization from public repositories and proprietary models, giving unparalleled insights into current and future conditions. Our platform transforms raw data into engaging visuals, allowing you to grasp complex weather patterns and make informed decisions quickly. Our customers rapidly integrate and customize our web or mobile visuals into their offerings.

Who Is the Company Behind Wet Dog Weather?

Whaly

We believe that analytics should benefit everyone. Whaly is an integrated, self-service business intelligence platform that enables data teams and business teams to work better together. Business teams are empowered to access, analyze, and share data from the tools they already use every day - HubSpot, Salesforce, Google Analytics, and more - with no technical expertise required. This means no more waiting on data teams for answers to every question. In parallel, data teams get some time back to focus on fewer menial tasks. With Whaly, you can connect, model, visualize and share your data - all from one place. Our mission is to boost adoption and foster company-wide trust in data, so that your company can make better, more informed decisions. Time to make your data work harder for you - not the other way around.

Average Rating: 4.8/5.0

Total Reviews: 25

How Do G2 Users Rate Whaly?

  • Has the product been a good partner in doing business?: 9.5/10 (Category avg: 9.0/10)

Who Is the Company Behind Whaly?

  • Seller: Whaly
  • Year Founded: 2020
  • HQ Location: Paris, FR
  • LinkedIn® Page: www.linkedin.com
    15 employees on LinkedIn®

Who Uses This Product?

  • Top Industries: Computer Software
  • Company Size: 44% Medium, 40% Small

What Are Recent G2 Reviews of Whaly?

WireBoard.io

WireBoard is a modern web analytics platform built for teams or solo website owners that need real-time insights without the steep learning curve of Google Analytics 4. Unlike traditional analytics tools that force you to choose between live data and historical reporting, WireBoard combines both in a single interface. Monitor traffic as it happens, compare today's performance to last week or last year, and drill into detailed reports: all from one customizable dashboard. Key capabilities include: - Real-time analytics with sub-second time resolution - Multi-site aggregation: view all your websites in a single, unified dashboard - 20+ real-time widgets and 11 report widgets, fully customizable - Custom event tracking that takes minutes to set up — no developer required - Funnels, user journey visualization, and conversion tracking - Period-over-period comparisons (yesterday, last week, last month, last year) - Per-widget timezone configuration - Scheduled data exports to S3 and automated email reports - Privacy-conscious data handling with no third-party sharing WireBoard is built for marketing teams, e-commerce operators, news publishers, and agencies managing multiple sites — anyone who needs to act on data immediately rather than wait for reports to load. Pricing starts free, with paid plans from $9 to $399/month.

Who Is the Company Behind WireBoard.io?

Woosmap

When location is part of your product, the data behind it needs to be accurate, secure, and yours. Woosmap gives product teams and developers the APIs to make that happen: address autocomplete, verification and validation, forward and reverse geocoding, store locator and proximity search, distance and travel time, interactive maps, and locality lookup. These power the moments that matter, from address entry at checkout to delivery routing to store discovery. When location works, conversion improves, costs drop, and customers trust the experience. Why teams choose Woosmap ∙ Accuracy at scale. Enterprise-grade data across 240+ countries. Structured, deliverable results that hold up at volume. ∙ Your data stays yours. Never used for advertising, model training, or other products. GDPR compliant, EU-hosted, full data residency control. ∙ Predictable cost. Around half the cost of comparable providers. Transparent pricing, no minimum commitments, no surprise rate changes. ∙ No lock-in. Modular infrastructure you adopt at your own pace. Replace services, run hybrid, or move away if you need to. ∙ Real support. Direct access to the engineering team. No ticket queues, no chatbots. A number to call when something breaks before launch. Used across retail, eCommerce, marketplaces, logistics, and mobility. Customers include Yespark, Carrefour, Decathlon, Leroy Merlin, Holland & Barrett, B&Q, Getaround, Sephora, and Lacoste.

Average Rating: 4.4/5.0

Total Reviews: 15

How Do G2 Users Rate Woosmap?

  • Has the product been a good partner in doing business?: 9.2/10 (Category avg: 9.0/10)

Who Is the Company Behind Woosmap?

  • Seller: Woosmap
  • Company Website:
  • Year Founded: 2018
  • HQ Location: Montpellier, FR
  • LinkedIn® Page: www.linkedin.com
    34 employees on LinkedIn®

Who Uses This Product?

  • Company Size: 63% Medium, 25% Large

What Are Recent G2 Reviews of Woosmap?

What Are G2 Users Discussing About Woosmap?

Worksheet Systems

Worksheet Systems is an online database software which allows anybody to build enterprise-worthy database solutions with ease, control and confidence. As easy to use as Excel and as powerful as SQL. No coding required!

Who Is the Company Behind Worksheet Systems?

Xapsys CRM

Xapsys create business software solutions including; - CRM - Live Business Intelligence - Live Planning systems and - E commerce sync software We offer a unique consultation service to tailor our systems to individual customer’s unique requirements, creating custom solutions without the usual costs attached. All of our modules are developed to be integrated with each other and with finance packages such as Sage, Xero and Quickbooks. Our goal is to make our customer’s work life easier, more profitable and therefore happier!

Average Rating: 4.5/5.0

Total Reviews: 1

How Do G2 Users Rate Xapsys CRM?

  • Has the product been a good partner in doing business?: 10.0/10 (Category avg: 9.0/10)

Who Is the Company Behind Xapsys CRM?

Who Uses This Product?

  • Company Size: 100% Medium

What Are Recent G2 Reviews of Xapsys CRM?

Bijou Barry
BB
Researched and written by Bijou Barry
Updated June 24, 2026