Best Container Monitoring Tools - Page 3

How Many Container Monitoring Tools Products Does G2 Track?

Total Products under this Category: 68

Category Stats (Sep 2026)

  • Average Rating: 4.51/5 The average rating of products in this category, based on all submitted ratings
  • Top Trending Product: Falcon Next-Gen SIEM (+7.14%) - Among all products in this category, Falcon Next-Gen SIEM recorded the largest rating increase compared to last month

Last updated: September 29, 2026

How Does G2 Rank Container Monitoring Tools Products?

Why You Can Trust G2's Software Rankings:

  • 30 Analysts and Data Experts
  • 9,800+ Authentic Reviews
  • 68+ Products
  • Unbiased Rankings

G2's software rankings are built on verified user reviews, rigorous moderation, and a consistent research methodology maintained by a team of analysts and data experts. Each product is measured using the same transparent criteria, with no paid placement or vendor influence. While reviews reflect real user experiences, which can be subjective, they offer valuable insight into how software performs in the hands of professionals. Together, these inputs power the G2 Score, a standardized way to compare tools within every category.

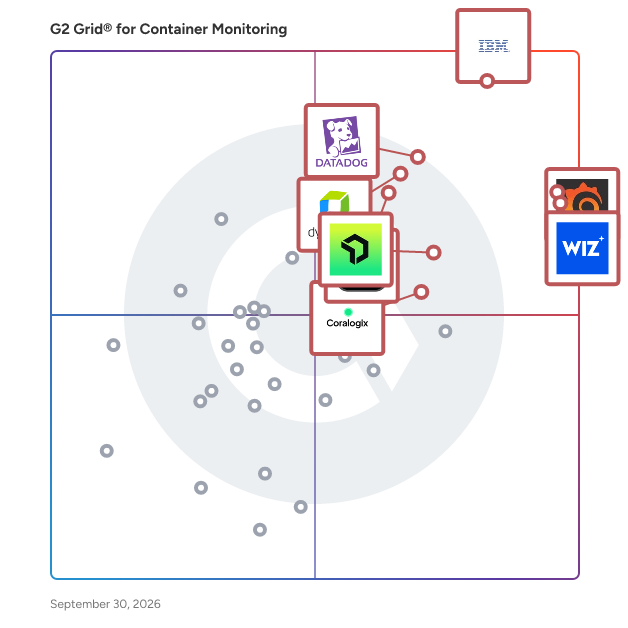
G2 Grid® for Container Monitoring Tools

G2 Grid® for Container Monitoring Tools plotting products by satisfaction and market presence

Highlighted products: IBM Instana, Grafana Labs, Wiz, Datadog, Dynatrace, Red Hat OpenShift, New Relic, and Coralogix.

Underlying data: [Grid® JSON](https://www.g2.com/categories/container-monitoring-tools/grids.json?focus%5B%5D=ibm-instana&focus%5B%5D=grafana-labs&focus%5B%5D=wiz-wiz&focus%5B%5D=datadog&focus%5B%5D=dynatrace&focus%5B%5D=red-hat-red-hat-openshift&focus%5B%5D=new-relic&focus%5B%5D=coralogix)

Splunk Infrastructure Monitoring

SignalFx is the only real-time cloud monitoring platform for infrastructure, microservices, and applications. The platform discovers and collects metrics across every component in your cloud environment, replacing traditional point tools and providing real-time predictive analytics. The massively scalable SignalFx architecture is optimized for cloud infrastructure and microservices-based applications, It provides powerful visualization, proactive alerting, and collaborative triage capabilities for organizations of all sizes. SignalFx is used by leading enterprises across high tech, financial services, consumer products, retail, communications, media, entertainment, and web-scale players like Yelp, HubSpot, Acquia, and Kayak. SignalFx is venture-funded by Andreessen Horowitz, Charles River Ventures, and General Catalyst

Average Rating: 4.3/5.0

Total Reviews: 49

How Do G2 Users Rate Splunk Infrastructure Monitoring?

  • Multi-mode alerts: 6.7/10 (Category avg: 8.4/10)
  • Proactive identification: 6.7/10 (Category avg: 8.6/10)
  • Automation: 5.0/10 (Category avg: 8.4/10)
  • Has the product been a good partner in doing business?: 9.2/10 (Category avg: 9.2/10)

Who Is the Company Behind Splunk Infrastructure Monitoring?

  • Seller: Cisco
  • Year Founded: 1984
  • HQ Location: San Jose, CA
  • Twitter: @Cisco
    720,366 Twitter followers
  • LinkedIn® Page: www.linkedin.com
    95,294 employees on LinkedIn®
  • Ownership: NASDAQ:CSCO

Who Uses This Product?

  • Who Uses This: Software Engineer
  • Top Industries: Computer Software, Information Technology and Services
  • Company Size: 45% Large, 37% Medium

What Do G2 Reviewers Say About Splunk Infrastructure Monitoring?

AI-generated summary from verified user reviews

Pros
  • Users value the real-time monitoring capabilities of Splunk Infrastructure Monitoring for ensuring seamless performance and uptime.
  • Users appreciate the real-time alerting systems in Splunk, ensuring smooth performance and minimal downtime across all environments.
  • Users value the versatile cloud monitoring capabilities of Splunk Infrastructure Monitoring, facilitating quick insights and alerts.
  • Users value the comprehensive monitoring capabilities of Splunk Infrastructure Monitoring, enhancing insights and operational efficiency.
Cons
  • Users find the difficult learning curve of Splunk Infrastructure Monitoring challenging, impacting their ability to utilize its features effectively.
  • Users face a steep learning curve with Splunk Infrastructure Monitoring, making it challenging to master the application.
  • Users criticize the complex pricing structure based on data volume, making it costly for large enterprises.
  • Users find the cost increase concerning, especially for large enterprises with high log data volumes.
  • Users raise concerns about data limitations, as costs escalate with high volumes of logs processed by Splunk.

What Are Recent G2 Reviews of Splunk Infrastructure Monitoring?

What Are G2 Users Discussing About Splunk Infrastructure Monitoring?

OpsPilot

OpsPilot OpsPilot is an AI-powered observability and autonomous reliability platform with an AI Site Reliability Engineering (SRE) teammate that helps engineering and operations teams detect, understand, and resolve incidents faster — and increasingly prevent them from happening at all. Your 24/7 stack expert Modern production systems — microservices, distributed architectures, cloud and hybrid environments — generate enormous volumes of telemetry. Your existing tools surface that data. But they still leave engineers responsible for interpreting signals, finding root causes, and deciding what to do next. OpsPilot closes that gap. It continuously analyzes telemetry across your applications, infrastructure, and services — then tells your team what is happening, why it is happening, and what to do about it. From dashboards to autonomous reliability OpsPilot goes beyond alerting and visualization. It correlates signals across metrics, logs, traces, and deployment events to identify abnormal behavior, explain root causes, and guide teams toward faster resolution — dramatically reducing time spent on incident investigation and operational troubleshooting. Over time, it evolves from reactive investigation toward proactive and autonomous operations. Your AI SRE teammate OpsPilot acts as an AI SRE teammate — augmenting your operations team by answering the questions engineers face during incidents: What changed? Where is the failure occurring? Which service is responsible? What should we investigate next? Three core capabilities Observability — collects and correlates telemetry across metrics, logs, traces, JVM data, and application-level diagnostics for a complete picture of system behavior. Operational Intelligence — applies AI-driven analysis to surface what changed, what is causing the issue, which components are involved, and what actions may resolve it. Foundational capabilities include anomaly detection, alert reduction, telemetry correlation, and root cause analysis. Action and Automation — supports guided incident response, runbook generation, automated remediation, and continuous operational learning — moving teams progressively toward autonomous reliability. OpenTelemetry-native. No new agents required. OpsPilot ingests telemetry via OTLP over gRPC or HTTP — no proprietary agent required. It works with your existing OpenTelemetry instrumentation across Kubernetes, microservices, cloud services, and serverless platforms. Prometheus-compatible metrics, Loki log ingestion, and Jaeger/Zipkin trace formats are also supported. For teams needing deep JVM or ColdFusion diagnostics, the optional FusionReactor APM agent provides additional application-level telemetry. Built for DevOps, SRE, and platform engineering teams OpsPilot is designed for organizations running modern production systems that require high reliability and operational efficiency — particularly teams moving toward SRE or platform engineering models who need deeper operational insight without increasing headcount. Deployed as SaaS, hybrid, or agentless via OpenTelemetry.

Average Rating: 4.8/5.0

Total Reviews: 174

How Do G2 Users Rate OpsPilot?

  • Multi-mode alerts: 8.3/10 (Category avg: 8.4/10)
  • Proactive identification: 8.3/10 (Category avg: 8.6/10)
  • Automation: 8.3/10 (Category avg: 8.4/10)
  • Has the product been a good partner in doing business?: 9.5/10 (Category avg: 9.2/10)

Who Is the Company Behind OpsPilot?

  • Seller: Intergral
  • Company Website:
  • Year Founded: 1998
  • HQ Location: Böblingen, DE
  • Twitter: @Fusion_Reactor
    9,345 Twitter followers
  • LinkedIn® Page: www.linkedin.com
    1 employees on LinkedIn®

Who Uses This Product?

  • Who Uses This: CTO, Developer
  • Top Industries: Information Technology and Services, Computer Software
  • Company Size: 61% Small, 29% Medium

What Do G2 Reviewers Say About OpsPilot?

AI-generated summary from verified user reviews

Pros
  • Users value the ease of use of OpsPilot, facilitating quick access to crucial metrics and troubleshooting insights.
  • Users find the real-time web metrics invaluable, enabling quick insights and identification of performance issues in their applications.
  • Users appreciate the real-time visibility and detailed insights provided by FusionReactor APM for effective monitoring.
  • Users value the real-time monitoring of OpsPilot, enabling effective performance management and quick issue resolution.
  • Users praise the responsive and friendly customer support of OpsPilot, making troubleshooting and assistance seamless.
Cons
  • Users find the learning curve challenging, as advanced features require careful configuration and can be overwhelming.
  • Users face difficult configuration challenges, leading to confusion and potentially missing out on important insights.
  • Users find the learning difficulty of OpsPilot challenging initially, requiring some research before effective use.
  • Users find the UI confusing, especially the Cloud version, despite ongoing improvements for clarity and usability.
  • Users find the UI design confusing, noting that it can complicate the initial experience with OpsPilot.

What Are Recent G2 Reviews of OpsPilot?

What Are G2 Users Discussing About OpsPilot?

Icinga Infrastructure Monitoring

Icinga is an open source monitoring platform for enterprise infrastructure and services. Organizations use Icinga to monitor servers, networks, cloud infrastructure, Kubernetes environments, applications, databases, VMware, and Windows systems across distributed and heterogeneous IT environments. Developed in Germany, Icinga is used by global enterprises, public institutions, service providers, and mid-sized companies that require flexible and scalable monitoring without vendor lock-in. The free and open source Icinga core already delivers comprehensive monitoring capabilities for infrastructure and services. Organizations can build and operate fully featured monitoring environments without licensing barriers while keeping full control over their monitoring data, workflows, and integrations. Icinga is designed for complex environments where standard monitoring approaches often reach their limits. Its distributed architecture supports everything from smaller deployments to large multi-site infrastructures with thousands of monitored systems and services. High availability and workload distribution help maintain operational resilience in critical environments. The platform integrates naturally into existing IT operations and DevOps ecosystems. Open APIs, Infrastructure as Code practices, and automation capabilities support standardized and scalable monitoring workflows. Icinga Director enables centralized configuration management and automated synchronization with external sources such as CMDBs, inventory systems, and cloud platforms. Monitoring data from different technologies and environments is consolidated into a unified operational view. Teams can combine health checks, metrics, and logs to troubleshoot incidents faster, analyze trends, and improve capacity planning. Dashboards, reporting, and business process views help operations teams and service owners focus on the information that matters most. Icinga supports integrations with tools such as PagerDuty, Opsgenie, Slack, Grafana, Prometheus, and many other operational platforms. Thousands of plugins and extensions allow organizations to adapt monitoring to their own infrastructure and operational requirements. Optional enterprise subscriptions provide professional support, long-term maintenance, and selected enterprise features such as Dependency Views and advanced team management capabilities. Organizations use Icinga to build scalable, vendor-independent monitoring strategies for modern infrastructure while maintaining flexibility across on-premises, cloud-native, and hybrid environments.

Average Rating: 4.4/5.0

Total Reviews: 22

How Do G2 Users Rate Icinga Infrastructure Monitoring?

  • Multi-mode alerts: 10.0/10 (Category avg: 8.4/10)
  • Proactive identification: 10.0/10 (Category avg: 8.6/10)
  • Automation: 8.3/10 (Category avg: 8.4/10)
  • Has the product been a good partner in doing business?: 8.3/10 (Category avg: 9.2/10)

Who Is the Company Behind Icinga Infrastructure Monitoring?

  • Seller: Icinga
  • Year Founded: 2018
  • HQ Location: Nuremberg, Bavaria
  • LinkedIn® Page: www.linkedin.com
    14 employees on LinkedIn®

Who Uses This Product?

  • Top Industries: Information Technology and Services
  • Company Size: 55% Large, 36% Medium

What Are Recent G2 Reviews of Icinga Infrastructure Monitoring?

Atatus

Atatus is an AI-SRE driven observability platform built to help teams monitor, understand, and improve the performance, reliability, and security of modern systems. It brings together application performance, APIs, infrastructure, databases, network activity, logs, and user experience into a single, unified platform, enabling teams to gain real-time visibility and context across their entire stack. Trusted by teams across industries, Atatus enables engineering, DevOps, SRE, and security teams to detect anomalies early, investigate issues with correlated insights, and resolve incidents faster. By combining full-stack observability with API intelligence, database and network monitoring, security log analysis, and AI-driven signal correlation, Atatus helps reduce mean time to resolution (MTTR), improve system reliability, strengthen security posture, and deliver better user experiences while maintaining visibility into critical business operations.

Average Rating: 4.7/5.0

Total Reviews: 95

How Do G2 Users Rate Atatus?

  • Multi-mode alerts: 10.0/10 (Category avg: 8.4/10)
  • Automation: 8.3/10 (Category avg: 8.4/10)
  • Has the product been a good partner in doing business?: 9.4/10 (Category avg: 9.2/10)

Who Is the Company Behind Atatus?

  • Seller: Atatus
  • Year Founded: 2014
  • HQ Location: Chennai, TamilNadu
  • Twitter: @atatusapp
    93 Twitter followers
  • LinkedIn® Page: www.linkedin.com
    64 employees on LinkedIn®

Who Uses This Product?

  • Who Uses This: CEO, CTO
  • Top Industries: Computer Software, Information Technology and Services
  • Company Size: 72% Small, 23% Medium

What Do G2 Reviewers Say About Atatus?

AI-generated summary from verified user reviews

Pros
  • Users highlight the fantastic customer support of Atatus, making it easy to resolve issues and enhance experience.
  • Users value the big-picture analytics of Atatus, enhancing their ability to monitor and optimize application performance effectively.
  • Users find Atatus to be easy to use, facilitating efficient navigation and excellent customer support.
  • Users find Atatus incredibly easy to set up, thanks to its intuitive interface and seamless integration.
  • Users value the efficiency of Atatus, enabling quick setup, insightful metrics, and proactive issue resolution.
Cons
  • Users find a lack of detailed information in Atatus documentation, leading to potential setup challenges.

What Are Recent G2 Reviews of Atatus?

What Are G2 Users Discussing About Atatus?

Apica

Apica provides agentic-ready infrastructure purpose-built for the AI era. Apica helps enterprises take control of exploding telemetry volumes by providing the pipeline control, metrics foundation, and data readiness that AI agents demand, at up to 40% lower total cost of ownership than legacy observability platforms. Unlike platform-centric solutions that ingest everything indiscriminately and charge at every step, Apica's pipeline-first architecture processes, enriches, and governs telemetry before costly platform ingestion, giving enterprises clean, governed, real-time data without vendor lock-in. Apica Ascent, the only complete telemetry data management product suite purpose-built for agentic AI environments, serves global enterprises across financial services, healthcare, retail, telecommunications, and technology sectors. Recognized as a Visionary in the 2025 Gartner Magic Quadrant for Observability Platforms. Learn more at www.apica.io or visit docs.apica.io.

Average Rating: 4.2/5.0

Total Reviews: 15

How Do G2 Users Rate Apica?

  • Has the product been a good partner in doing business?: 7.5/10 (Category avg: 9.2/10)

Who Is the Company Behind Apica?

  • Seller: Apica
  • Year Founded: 2005
  • HQ Location: Stockholm, SE
  • LinkedIn® Page: www.linkedin.com
    83 employees on LinkedIn®

Who Uses This Product?

  • Company Size: 47% Medium, 33% Large

What Do G2 Reviewers Say About Apica?

AI-generated summary from verified user reviews

Pros
  • Users find Apica easy to use, enabling effortless testing with a user-friendly interface for all skill levels.
  • Users value the real-time monitoring capability of Apica, enhancing system performance and decision-making through timely insights.
  • Users value the comprehensive data analysis of Apica, enabling insights into system opportunities and issues effectively.
  • Users find the easy setup of Apica very beneficial for quickly conducting load tests without complex configurations.
  • Users value the efficient issue detection features of Apica, enabling proactive management of system performance and health.
Cons
  • Users find Circonus' limited features frustrating during trials, wishing for broader access to explore its full capabilities.
  • Users note the limited features during the trial, suggesting a broader selection for better evaluation is needed.
  • Users find the complex setup of Apica challenging, requiring significant time to customize and train effectively.
  • Users note the high pricing of Apica, which may be challenging for smaller firms with limited budgets.
  • Users find difficult customization in Apica, requiring time to adjust it for specific needs before production use.

What Are Recent G2 Reviews of Apica?

What Are G2 Users Discussing About Apica?

Darktrace / HYBRID NETWORK

Darktrace / HYBRID NETWORK uses Adaptive AI to continuously learn behavior across your infrastructure, combining NDR, CDR, OT security, ITDR, exposure management, attack path modelling and forensic investigations into a single solution. - Unify visibility - Detect and contain known, novel and insider threats - AI-led triage and investigations - Increase resilience Named a Leader in the 2025 and 2026 Gartner® Magic Quadrant™ for NDR and the only Visionary in the 2025 Gartner® Magic Quadrant™ for CPS.

Average Rating: 4.4/5.0

Total Reviews: 47

How Do G2 Users Rate Darktrace / HYBRID NETWORK?

  • Has the product been a good partner in doing business?: 9.0/10 (Category avg: 9.2/10)

Who Is the Company Behind Darktrace / HYBRID NETWORK?

  • Seller: Darktrace
  • Company Website:
  • Year Founded: 2013
  • HQ Location: Cambridgeshire, England
  • Twitter: @Darktrace
    18,177 Twitter followers
  • LinkedIn® Page: www.linkedin.com
    2,597 employees on LinkedIn®

Who Uses This Product?

  • Top Industries: Financial Services, Information Technology and Services
  • Company Size: 63% Medium, 31% Large

What Do G2 Reviewers Say About Darktrace / HYBRID NETWORK?

AI-generated summary from verified user reviews

Pros
  • Users appreciate the excellent monitoring capabilities of Darktrace, offering impressive visibility and efficient network analysis.
  • Users appreciate the self-learning AI technology of Darktrace/Network, effectively adapting to threats without extensive configuration.
  • Users commend Darktrace's rapid threat detection, ensuring robust security with minimal manual intervention for maximum efficiency.
  • Users commend the responsive customer support of Darktrace/Network, enhancing learning and facilitating efficient troubleshooting.
  • Users highlight the autonomous AI-driven cybersecurity of Darktrace, which effectively detects and responds to threats in real time.
Cons
  • Users report a significant learning curve with Darktrace as the AI generates numerous alerts during initial setup.
  • Users note that the product can be expensive, particularly for smaller organizations with constrained budgets and significant training costs.
  • Users experience alert issues with Darktrace, needing extensive manual tuning to manage false positives during the learning phase.
  • Users find the complex setup of Darktrace challenging, requiring skilled teams for effective management and configuration.
  • Users experience false positives occasionally, requiring IT support to resolve issues affecting network connectivity.

What Are Recent G2 Reviews of Darktrace / HYBRID NETWORK?

What Are G2 Users Discussing About Darktrace / HYBRID NETWORK?

CubeAPM

CubeAPM is an OpenTelemetry-native observability and application performance monitoring (APM) platform that helps engineering and DevOps teams monitor applications, infrastructure, logs, and metrics from a single unified dashboard. Built for modern cloud and on-prem environments, CubeAPM offers full-stack visibility without sacrificing data control. It can be self-hosted inside your own cloud or data center, making it ideal for teams that need enterprise-grade observability while maintaining compliance with ISO 27001 standards. Most teams face a trade-off in observability — cloud SaaS tools are easy to run but send sensitive data outside your cloud, while open-source stacks demand heavy operations. CubeAPM removes this compromise by combining the control of self-hosting with the simplicity of SaaS. With flat usage-based pricing at $0.15 per GB, smart sampling, and unlimited retention, CubeAPM delivers predictable, affordable observability for organizations of any scale. Dashboards load instantly, data queries run fast, and teams can monitor microservices, Kubernetes clusters, APIs, and distributed systems in real time. Key Highlights OpenTelemetry-native: Ingest data from any stack with full compatibility. Self-hosted but managed: Runs in your environment while upgrades and maintenance are handled by CubeAPM. Unlimited retention: Store logs, traces, and metrics as long as you need. Transparent pricing: $0.15 / GB with no host-based fees or hidden charges. ISO 27001 compliant: Ensures quality, reliability, and operational excellence. CubeAPM is the ideal observability solution for teams seeking performance insights, compliance readiness, and total control — without the high costs or operational complexity of traditional APM tools.

Average Rating: 4.9/5.0

Total Reviews: 26

How Do G2 Users Rate CubeAPM?

  • Multi-mode alerts: 10.0/10 (Category avg: 8.4/10)
  • Proactive identification: 10.0/10 (Category avg: 8.6/10)
  • Automation: 10.0/10 (Category avg: 8.4/10)
  • Has the product been a good partner in doing business?: 10.0/10 (Category avg: 9.2/10)

Who Is the Company Behind CubeAPM?

Who Uses This Product?

  • Top Industries: Information Technology and Services
  • Company Size: 54% Small, 46% Medium

What Do G2 Reviewers Say About CubeAPM?

AI-generated summary from verified user reviews

Pros
  • Users highlight the responsive customer support of CubeAPM, appreciating quick assistance and availability on Slack.
  • Users value the cost optimization of CubeAPM, appreciating its affordability compared to other observability tools.
  • Users value the effective monitoring capabilities of CubeAPM, noting quick data integration and responsive support.
  • Users appreciate the affordable and predictable pricing of CubeAPM, making it a cost-effective observability solution.
  • Users commend the real-time monitoring capabilities of CubeAPM, enhancing visibility into performance and reducing downtime.
Cons
  • Users find CubeAPM has inadequate monitoring capabilities, particularly for mobile apps and advanced AI observability.
  • Users find the absence of mobile and security monitoring features in CubeAPM limits its overall capabilities.
  • Users note the limited mobile app monitoring capabilities of CubeAPM, particularly for iOS, affecting overall effectiveness.
  • Users note the limited features of CubeAPM, especially in AI-driven observability and mobile app monitoring.
  • Users highlight the feature limitations of CubeAPM, particularly in mobile app monitoring and dashboard effectiveness.

What Are Recent G2 Reviews of CubeAPM?

Falcon Next-Gen SIEM

Falcon Next-Gen SIEM stops breaches by unifying data, threat intelligence, and workflow automation on one complete AI-native SOC platform. Built from the ground up around a modern security analyst experience, it amplifies the speed and efficiency of incident response. Your team can search up to 150x faster and scale to 1PB/day of data ingestion while achieving 80% cost savings compared to legacy SIEMs. CrowdStrike Falcon Next-Gen SIEM uncovers threats instantly with real-time threat detection, live dashboards and world-class intelligence. AI-assist features transform your entire team into experts by visualizing incidents in an elegant graph and automating manual investigation steps. For the first time ever, you can unify security on one platform to hunt down and eliminate fast-moving threats and achieve compliance.

Average Rating: 4.5/5.0

Total Reviews: 39

How Do G2 Users Rate Falcon Next-Gen SIEM?

  • Has the product been a good partner in doing business?: 9.8/10 (Category avg: 9.2/10)

Who Is the Company Behind Falcon Next-Gen SIEM?

  • Seller: CrowdStrike
  • Year Founded: 2011
  • HQ Location: Sunnyvale, CA
  • Twitter: @CrowdStrike
    110,809 Twitter followers
  • LinkedIn® Page: www.linkedin.com
    21,058 employees on LinkedIn®
  • Ownership: NASDAQ: CRWD

Who Uses This Product?

  • Top Industries: Information Technology and Services, Financial Services
  • Company Size: 50% Medium, 36% Large

What Are Recent G2 Reviews of Falcon Next-Gen SIEM?

What Are G2 Users Discussing About Falcon Next-Gen SIEM?

CloudThinker

CloudThinker is an autonomous AI-powered cloud operations platform built for engineering teams that need to move fast without sacrificing reliability, security, or cost efficiency. Rather than another dashboard you have to interpret yourself, CloudThinker's AI agents work continuously across your stack, managing cloud resources, reviewing code, responding to incidents, and optimizing spend with minimal human intervention required. Six core platform modules: AI Code Review Agent — automated PR analysis for security vulnerabilities, logic errors, and performance issues, integrated into GitHub/GitLab Incident Response Agent — real-time detection, root cause analysis, and automated remediation via AI-driven runbooks, correlating logs, metrics, traces, and alerts Cloud Cost Optimization (FinOps Agent) — continuous spend analysis across AWS, Azure, GCP; identifies idle resources, oversized instances, and RI opportunities Security Monitoring Agent — continuous scanning for misconfigurations, exposed credentials, and IAM drift, mapped to CIS Benchmarks and SOC 2 Kubernetes Operations Agent — workload rightsizing, pod autoscaling, and automated remediation across EKS, AKS, GKE IT HelpDesk Automation Agent — resolves common employee requests, routes tickets, and provisions access Graduated Autonomy framework (a key differentiator): four configurable levels — Notify (AI observes only), Suggest (AI drafts recommendations, humans approve), Act with Approval (AI executes pending sign-off), and Autonomous (AI investigates, remediates, and verifies end-to-end) — configurable per agent, per environment, and per team role with RBAC governance. Integrations: 50+ pre-built connectors including AWS, Azure, GCP, Kubernetes, GitHub, GitLab, Slack, PagerDuty, Jira, Datadog, Prometheus, Grafana, Terraform, Pulumi, and ArgoCD — connects via API with no agents to install. Compliance & security: SOC 2 Type 1 and Type 2 certified. CloudThinker is also an AWS Partner (including AWS AI Services Competency) and is available directly on AWS Marketplace.

Average Rating: 4.7/5.0

Total Reviews: 19

How Do G2 Users Rate CloudThinker?

  • Has the product been a good partner in doing business?: 9.6/10 (Category avg: 9.2/10)

Who Is the Company Behind CloudThinker?

Who Uses This Product?

  • Top Industries: Information Technology and Services
  • Company Size: 80% Small, 15% Medium

What Are Recent G2 Reviews of CloudThinker?

Blue Matador

Set Up AWS Infrastructure Monitoring Instantly. For dev-focused teams with little dedicated ops, getting AWS Cloud monitoring set up for the first time is manual and cumbersome; it requires significant time and toil with a typical infrastructure monitoring tool. Blue Matador removes the burden of a complicated setup by automatically detecting and monitoring all of your AWS resources. Just hand it your AWS read-only credentials, and in minutes, it tracks resources, detects baselines, manages thresholds, and sends you insights.

Average Rating: 4.4/5.0

Total Reviews: 10

How Do G2 Users Rate Blue Matador?

  • Has the product been a good partner in doing business?: 10.0/10 (Category avg: 9.2/10)

Who Is the Company Behind Blue Matador?

  • Seller: Blue Matador
  • Year Founded: 2016
  • HQ Location: South Jordan, Utah
  • Twitter: @bluematadorinc
    191 Twitter followers
  • LinkedIn® Page: www.linkedin.com
    3 employees on LinkedIn®

Who Uses This Product?

  • Company Size: 60% Medium, 40% Small

What Are Recent G2 Reviews of Blue Matador?

What Are G2 Users Discussing About Blue Matador?

OverOps

OverOps root cause analysis at runtime instantly pinpoints why critical issues break backend Java and .NET environments in pre-prod through production. Detective-work such as searching logs is not required to reproduce critical issues. OverOps delivers the precise line of code and associated variables. OverOps requires no code changes so engineering teams can develop fast without sacrificing quality.

Average Rating: 3.6/5.0

Total Reviews: 12

How Do G2 Users Rate OverOps?

  • Multi-mode alerts: 10.0/10 (Category avg: 8.4/10)
  • Proactive identification: 10.0/10 (Category avg: 8.6/10)
  • Automation: 10.0/10 (Category avg: 8.4/10)
  • Has the product been a good partner in doing business?: 8.3/10 (Category avg: 9.2/10)

Who Is the Company Behind OverOps?

  • Seller: Overops
  • Year Founded: 2011
  • HQ Location: San Francisco, CA
  • Twitter: @OverOps
    7 Twitter followers
  • LinkedIn® Page: www.linkedin.com
    2 employees on LinkedIn®

Who Uses This Product?

  • Top Industries: Computer Software
  • Company Size: 67% Small, 25% Medium

What Are Recent G2 Reviews of OverOps?

What Are G2 Users Discussing About OverOps?

Motadata ObserveOps

Motadata ObserveOps (formerly known as AIOps) is a full-stack observability platform that gives IT and operations teams complete visibility across their infrastructure, networks, and applications. It unifies metrics, logs, and traces in one place, replacing scattered point tools with a single source of truth for the health of the environment. Built on DFIT (Deep Learning Framework for IT Operations), ObserveOps applies AI and machine learning to correlate signals, detect anomalies, and identify the root cause of incidents faster. Core capabilities include real-time monitoring, customizable dashboards and reports, intelligent alerting, network and flow analysis, log analytics, and automated network configuration backups. ObserveOps covers on-premises, cloud, and hybrid environments, and supports on-premises deployment for organizations with data control requirements. Teams use it to reduce downtime, resolve issues proactively, and base operational decisions on reliable, correlated data.

Average Rating: 4.6/5.0

Total Reviews: 31

How Do G2 Users Rate Motadata ObserveOps?

  • Has the product been a good partner in doing business?: 9.6/10 (Category avg: 9.2/10)

Who Is the Company Behind Motadata ObserveOps?

  • Seller: Mindarray Systems
  • Year Founded: 2010
  • HQ Location: Ahmedabad, India
  • Twitter: @MotadataSystems
    152 Twitter followers
  • LinkedIn® Page: www.linkedin.com
    25 employees on LinkedIn®
  • Phone: 1800 889 1915

Who Uses This Product?

  • Top Industries: Computer & Network Security
  • Company Size: 53% Medium, 31% Small

What Do G2 Reviewers Say About Motadata ObserveOps?

AI-generated summary from verified user reviews

Pros
  • Users love the powerful dashboard with customizable widgets, enhancing their ability to monitor and analyze data effectively.
  • Users value the powerful dashboards of Motadata ObserveOps for their detailed features and ease of use.
  • Users appreciate the ease of use of Motadata ObserveOps, valuing its clear interface and straightforward configuration.
  • Users appreciate the detailed implementation of features in Motadata ObserveOps, enhancing technical functionality and graphical representation.
  • Users value the comprehensive monitoring capabilities of Motadata ObserveOps, appreciating its detailed technical and graphical representations.
Cons
  • Users face challenges with complex configuration, including licensing for technicians and dual LAN issues.
  • Users face configuration difficulties with licensing for technicians and issues with dual LAN settings in Motadata ObserveOps.
  • Users express concern over licensing issues related to technicians, which complicates their operational experience with ObserveOps.
  • Users face technical issues with licensing for technicians and dual LAN configuration problems affecting usability.

What Are Recent G2 Reviews of Motadata ObserveOps?

What Are G2 Users Discussing About Motadata ObserveOps?

ServiceNow Cloud Observability (formerly LightStep)

Lightstep’s observability platform is the easiest way for developers and SREs to monitor health and respond to changes in cloud-native applications. Powered by cutting-edge distributed tracing and a groundbreaking metrics database, and built by the team that launched observability at Google, Lightstep’s Change Intelligence provides actionable insights to help teams answer the question “What caused that change? Lightstep empowers reliability and observability managers to minimize the impact of outages, improve software performance, and build org-wide standards to drive adoption and automation.

Average Rating: 4.6/5.0

Total Reviews: 19

How Do G2 Users Rate ServiceNow Cloud Observability (formerly LightStep)?

  • Has the product been a good partner in doing business?: 9.4/10 (Category avg: 9.2/10)

Who Is the Company Behind ServiceNow Cloud Observability (formerly LightStep)?

  • Seller: ServiceNow
  • Year Founded: 2004
  • HQ Location: Santa Clara, CA
  • Twitter: @servicenow
    55,548 Twitter followers
  • LinkedIn® Page: www.linkedin.com
    35,078 employees on LinkedIn®
  • Ownership: NYSE:NOW

Who Uses This Product?

  • Top Industries: Computer Software
  • Company Size: 45% Large, 35% Medium

What Are Recent G2 Reviews of ServiceNow Cloud Observability (formerly LightStep)?

Thoras AI

Meet your infrastructure Al toolkit: Thoras leverages bleeding-edge Al to predict and scale your GPU and CPU resources, prevent downtime, and optimize Kubernetes workloads—saving you money and keeping your systems running smoothly. Modern autoscalers react too late, forcing you to over provision compute or risk downtime. Thoras forecasts workload demand with precision using bleeding-edge ML modeling, so your infrastructure is always one step ahead.

Average Rating: 5.0/5.0

Total Reviews: 3

How Do G2 Users Rate Thoras AI?

  • Automation: 10.0/10 (Category avg: 8.4/10)
  • Has the product been a good partner in doing business?: 10.0/10 (Category avg: 9.2/10)

Who Is the Company Behind Thoras AI?

Who Uses This Product?

  • Company Size: 100% Medium

What Do G2 Reviewers Say About Thoras AI?

AI-generated summary from verified user reviews

Pros
  • Users value the automation in Thoras AI for effortless pod resizing, streamlining their workflow efficiently.
  • Users value the auto scaling feature of Thoras AI, enabling seamless pod re-sizing without manual intervention.
  • Users value the exceptional customer support from Thoras AI, highlighting their partnership in optimizing Kubernetes environments.
  • Users value the easy integrations with Thoras AI, appreciating the team's exceptional support in optimizing their systems.
  • Users value the exceptional support from the Thoras team, aiding in optimizing and integrating their Kubernetes environments.
Cons
  • Users note that complex configuration is needed for Thoras, making integration into existing pipelines time-consuming.
  • Users note the complexity of integrating Thoras into their pipelines, making onboarding time-consuming despite helpful support.
  • Users find the configuration complexity challenging, desiring a more automated setup from Thoras AI.
  • Users find the time-consuming onboarding process necessary for Thoras frustrating, particularly with complex pipelines.

What Are Recent G2 Reviews of Thoras AI?

Virtana Platform

Virtana delivers the industry's deepest hybrid infrastructure observability platform, empowering enterprises to ensure the availability, efficiency, and resiliency of their mission-critical services. Our AI-powered platform unifies visibility across on-premises, cloud, and Kubernetes environments, providing comprehensive real-time insights and intelligent automation. Key differentiators: · AI-driven early warning system and automated root cause analysis · Comprehensive topology discovery and mapping across your entire IT estate · Consolidated alerts with policy-based noise reduction · Natural language infrastructure querying through Virtana Copilot · Vendor-agnostic platform supporting both on-premises and cloud deployments Organizations choose Virtana to: · Reduce mean time to resolution (MTTR) through AI-powered automation · Lower infrastructure costs with intelligent optimization · Improve team productivity by eliminating alert noise · Support demanding AI workloads with deep infrastructure insights · Transform infrastructure from a cost center to a strategic asset Whether you're managing traditional IT, hybrid environments, or advanced AI data centers, Virtana provides the deep observability and intelligent automation needed to drive operational excellence and accelerate digital transformation.

Average Rating: 4.3/5.0

Total Reviews: 35

How Do G2 Users Rate Virtana Platform?

  • Has the product been a good partner in doing business?: 9.0/10 (Category avg: 9.2/10)

Who Is the Company Behind Virtana Platform?

  • Seller: Virtana
  • Year Founded: 2008
  • HQ Location: N/A
  • Twitter: @VirtanaCorp
    9,421 Twitter followers
  • LinkedIn® Page: www.linkedin.com
    168 employees on LinkedIn®

Who Uses This Product?

  • Company Size: 53% Large, 26% Medium

What Are Recent G2 Reviews of Virtana Platform?

What Are G2 Users Discussing About Virtana Platform?

Adam Crivello
AC
Researched and written by Adam Crivello
Updated October 3, 2024