Top Free Analytics Platforms - Page 5

How Many Analytics Platforms Products Does G2 Track?

Total Products under this Category: 604

Category Stats (Sep 2026)

  • Average Rating: 4.51/5 The average rating of products in this category, based on all submitted ratings
  • Top Trending Product: Cube (+2.46%) - Among all products in this category, Cube recorded the largest rating increase compared to last month

Last updated: September 26, 2026

How Does G2 Rank Analytics Platforms Products?

Why You Can Trust G2's Software Rankings:

  • 30 Analysts and Data Experts
  • 29,600+ Authentic Reviews
  • 604+ Products
  • Unbiased Rankings

G2's software rankings are built on verified user reviews, rigorous moderation, and a consistent research methodology maintained by a team of analysts and data experts. Each product is measured using the same transparent criteria, with no paid placement or vendor influence. While reviews reflect real user experiences, which can be subjective, they offer valuable insight into how software performs in the hands of professionals. Together, these inputs power the G2 Score, a standardized way to compare tools within every category.

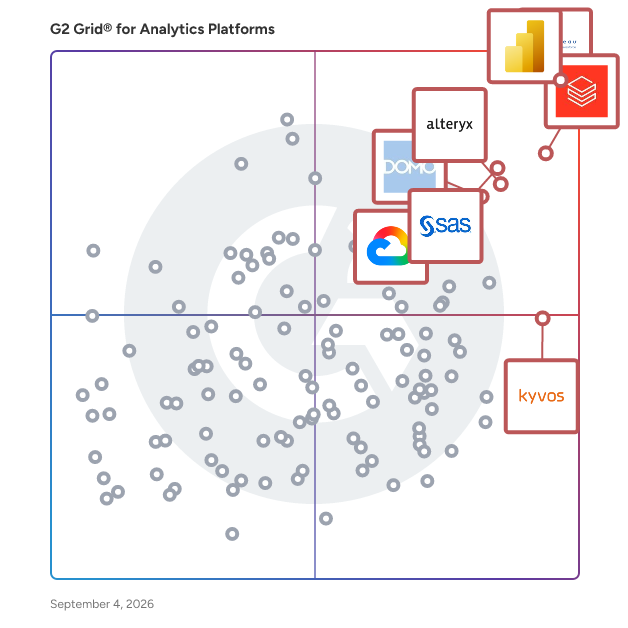
G2 Grid® for Analytics Platforms

G2 Grid® for Analytics Platforms plotting products by satisfaction and market presence

Highlighted products: Microsoft Power BI, Tableau, Databricks, SAS Viya, Alteryx, Domo, Looker, and Kyvos Semantic Layer.

Underlying data: [Grid® JSON](https://www.g2.com/categories/analytics-platforms/grids.json?focus%5B%5D=microsoft-microsoft-power-bi&focus%5B%5D=tableau&focus%5B%5D=databricks&focus%5B%5D=sas-sas-viya&focus%5B%5D=alteryx&focus%5B%5D=domo&focus%5B%5D=looker&focus%5B%5D=kyvos-semantic-layer)

panintelligence

Expand ARR and accelerate your product roadmap with secure, Generative Business Intelligence (GenBI). At Panintelligence, we bring over 10 years of expertise in helping 400+ global customers unlock deeper insights, reduce technical debt, and drive data-driven growth. Our platform seamlessly integrates with your existing data infrastructure, providing your users with an intuitive, immersive experience. Low Code for Developers: We minimize development effort, allowing your team to focus on innovation and accelerate your roadmap. No Code for Users: We empower users to explore data independently, leveraging Generative BI to surface insights without technical expertise. By embedding Panintelligence, you enable self-service analytics while future-proofing your platform. Our partnership-driven approach ensures your business stays ahead with secure, scalable, and cutting-edge GenBI. Unlock the full potential of your data with Panintelligence – the Generative BI leader for organizations worldwide.

Average Rating: 4.4/5.0

Total Reviews: 49

How Do G2 Users Rate panintelligence?

  • Has the product been a good partner in doing business?: 9.4/10 (Category avg: 9.2/10)
  • Steps to Answer: 8.6/10 (Category avg: 8.4/10)
  • Reports Interface: 8.2/10 (Category avg: 8.8/10)
  • Calculated Fields: 8.8/10 (Category avg: 8.5/10)

Who Is the Company Behind panintelligence?

  • Seller: Panintelligence
  • Company Website:
  • Year Founded: 2014
  • HQ Location: Leeds
  • Twitter: @panintelligence
    2,056 Twitter followers
  • LinkedIn® Page: www.linkedin.com
    34 employees on LinkedIn®

Who Uses This Product?

  • Top Industries: Computer Software, Information Technology and Services
  • Company Size: 43% Medium, 39% Small

What Do G2 Reviewers Say About panintelligence?

AI-generated summary from verified user reviews

Pros
  • Users commend the exceptional customer support from Panintelligence, enhancing their overall experience and investment effectiveness.
  • Users value the dashboard customization of panintelligence, allowing tailored setups for diverse needs and layouts.
  • Users value the ease of use of Panintelligence, appreciating its flexibility and seamless integration with existing systems.
  • Users appreciate the flexible data visualization of Panintelligence, enabling easy integration and customization for their needs.
  • Users value the user-friendly analytics of Panintelligence, enabling quick insights and efficient data-driven decision-making.
Cons
  • Users find the limited chart functionality of Panintelligence restricts their ability to customize visual elements effectively.
  • Users find the limited customization options of Panintelligence frustrating, hindering their ability to personalize visual elements.
  • Users find the limited visualization in panintelligence restricts interactivity and customization, impacting their overall experience.
  • Users express dissatisfaction with the missing features in Panintelligence, particularly in customization and advanced capabilities.
  • Users find the poor UI of Panintelligence limits customization options, making the platform feel overwhelming and less user-friendly.

What Are Recent G2 Reviews of panintelligence?

What Are G2 Users Discussing About panintelligence?

Grow.com

Grow is a no-code full-stack business intelligence (BI) platform that empowers everyone in your organization to make data-driven decisions. By combining ETL, data warehousing and visualization in one easy-to-use platform, any organization can connect and explore its data to surface insights. Our unlimited-user license model gives everyone access to the answers they need without waiting in line for an analyst. Now everyone can make great decisions in real-time to accelerate their growth.

Average Rating: 4.3/5.0

Total Reviews: 275

How Do G2 Users Rate Grow.com?

  • Has the product been a good partner in doing business?: 8.8/10 (Category avg: 9.2/10)
  • Steps to Answer: 7.8/10 (Category avg: 8.4/10)
  • Reports Interface: 8.6/10 (Category avg: 8.8/10)
  • Calculated Fields: 8.3/10 (Category avg: 8.5/10)

Who Is the Company Behind Grow.com?

  • Seller: Epicor
  • Company Website:
  • Year Founded: 1972
  • HQ Location: Austin, TX
  • Twitter: @Epicor
    9,286 Twitter followers
  • LinkedIn® Page: www.linkedin.com
    6,154 employees on LinkedIn®

Who Uses This Product?

  • Who Uses This: Data Analyst, Account Manager
  • Top Industries: Marketing and Advertising, Computer Software
  • Company Size: 64% Small, 34% Medium

What Do G2 Reviewers Say About Grow.com?

AI-generated summary from verified user reviews

Pros
  • Users find Grow.com to offer ease of use, enabling clear dashboards and seamless data integration for effective reporting.
  • Users appreciate the simple and user-friendly interface of Grow.com, facilitating easy performance tracking and clear insights.
  • Users value the excellent visual tools of Grow.com for creating accessible and engaging data visualizations effortlessly.
  • Users appreciate the easy integrations with various APIs, enhancing accessibility and data management for better insights.
  • Users value the seamless integrations with various data sources, enhancing their ability to monitor and visualize metrics effectively.
Cons
  • Users find Grow.com to be expensive, particularly challenging for small businesses and startups when managing costs.
  • Users note the missing features that limit flexibility, such as data transformation and advanced visualization options.
  • Users note the slow loading times of Grow.com can hinder efficiency and create frustration during use.
  • Users find that slow performance when syncing data may hinder their overall experience with Grow.com.
  • Users frequently experience performance issues with Grow.com, encountering slow updates and lagging visualizations that hinder usability.

What Are Recent G2 Reviews of Grow.com?

What Are G2 Users Discussing About Grow.com?

Bold Reports

Bold Reports® by Syncfusion® is a modern self-service and embedded reporting solution that empowers organizations to design, manage, and deliver pixel-perfect, paginated reports with ease. It supports both RDL and RDLC formats, offering full compatibility and flexibility for enterprise reporting needs. With support for embedding in over 10 application platforms, including JavaScript, Angular, React, Blazor, and ASP.NET Core, Bold Reports seamlessly integrates into any tech stack. Bold Reports serves a wide range of users—from individual developers and small teams to large enterprises and government organizations—offering scalable solutions with export options that include PDF, Excel, Word, PowerPoint, and HTML. With an intuitive, WYSIWYG, drag-and-drop Report Designer, users of all skill levels can create interactive, rich reports using a wide array of 40+ report items: charts, tables, matrices, gauges, maps, barcodes, sparklines, and more. It supports over 30 data connectors, including SQL databases, Excel files, REST APIs, cloud services, and the Bold Data Hub for centralized data management. Backed by the end-to-end expert support of Syncfusion®, Bold Reports is ideal for organizations looking to scale their reporting with speed and intelligence. Customers benefit from 24/5 assistance from onboarding to full implementation through free, scheduled support calls, live chat, and email. Note: Older reviews may reference the product’s previous name, “Syncfusion® Report Platform.”

Average Rating: 4.1/5.0

Total Reviews: 58

How Do G2 Users Rate Bold Reports?

  • Has the product been a good partner in doing business?: 8.7/10 (Category avg: 9.2/10)
  • Steps to Answer: 7.5/10 (Category avg: 8.4/10)
  • Reports Interface: 8.3/10 (Category avg: 8.8/10)
  • Calculated Fields: 8.2/10 (Category avg: 8.5/10)

Who Is the Company Behind Bold Reports?

  • Seller: Syncfusion
  • Company Website:
  • Year Founded: 2001
  • HQ Location: Morrisville, North Carolina
  • Twitter: @Syncfusion
    11,907 Twitter followers
  • LinkedIn® Page: www.linkedin.com
    2,741 employees on LinkedIn®

Who Uses This Product?

  • Top Industries: Computer Software, Information Technology and Services
  • Company Size: 58% Small, 32% Medium

What Do G2 Reviewers Say About Bold Reports?

AI-generated summary from verified user reviews

Pros
  • Users love the ease of use of Bold Reports, appreciating its intuitive design and seamless integrations.
  • Users commend the excellent customer support of Bold Reports, noting quick responses and helpful solutions.
  • Users value the easy integrations of Bold Reports, enhancing flexibility and usability across multiple applications.
  • Users appreciate the seamless integration of Bold Reports, enhancing their applications and simplifying report creation.
  • Users value the robust report generation capabilities of Bold Reports, enhancing functionality and client flexibility in applications.
Cons
  • Users face a notable learning difficulty with Bold Reports due to its complex interface and initial setup challenges.
  • Users report experiencing slow performance with Bold Reports, especially when handling large reports without proper tuning.
  • Users face reporting issues due to limitations in the designer and difficulty in implementation, slowing down development.
  • Users report encountering persistent bugs in Bold Reports, affecting functionality and overall user experience.
  • Users find the complex usage of Bold Reports frustrating, particularly during setup and navigating its intricate features.

What Are Recent G2 Reviews of Bold Reports?

What Are G2 Users Discussing About Bold Reports?

ManageEngine Analytics Plus

https://mnge.it/AL5ZN ManageEngine Analytics Plus is an AI-powered IT analytics and decision intelligence platform that transforms complex IT data into actionable strategies. It delivers unified visibility, predictive intelligence, and strategic decision-making across every layer of IT. By combining decision intelligence, GenAI, and no-code ML, IT teams can find hidden dependencies and inefficiencies, implement corrective strategies, and optimize performance across the entire IT stack. With contextual intelligence embedded across IT applications, the platform delivers actionable insights, expedites root cause analysis, and predicts outcomes through intuitive, no-code interactions. With Zia, Analytics Plus’ AI-powered assistant, gain instant insights, surface key drivers behind trends, and receive contextual recommendations to guide faster decision-making. With agentic AI-driven analytics and cross-domain insights, real-time IT intelligence is seamlessly woven into workflow orchestrations—no specialized expertise required. Create powerful, interactive dashboards and reports using Zia, and with intuitive drag-and-drop tools. Access a rich library of prebuilt dashboards and reports tailored for varied IT use cases such as monitoring network performance, detecting security anomalies, and optimizing technician efficiency, helping teams get started quickly and make faster data-driven decisions. With support for both cloud and on-premises deployments and 250+ integrations, including with the ManageEngine suite, Analytics Plus adapts to diverse organizational needs. Its enterprise-grade scalability, security, and governance framework ensure reliable performance and scalability across complex IT environments.

Average Rating: 4.4/5.0

Total Reviews: 13

How Do G2 Users Rate ManageEngine Analytics Plus?

  • Has the product been a good partner in doing business?: 9.6/10 (Category avg: 9.2/10)

Who Is the Company Behind ManageEngine Analytics Plus?

  • Seller: Zoho
  • Year Founded: 1996
  • HQ Location: Austin, TX
  • Twitter: @Zoho
    137,880 Twitter followers
  • LinkedIn® Page: www.linkedin.com
    30,913 employees on LinkedIn®
  • Phone: +1 (888) 900-9646

Who Uses This Product?

  • Company Size: 54% Large, 38% Medium

What Do G2 Reviewers Say About ManageEngine Analytics Plus?

AI-generated summary from verified user reviews

Pros
  • Users appreciate the dynamic and modern dashboards of ManageEngine Analytics Plus, enhancing their data visualization experience.
  • Users appreciate the ease of use of ManageEngine Analytics Plus, finding its features intuitive and efficient for their needs.
  • Users appreciate the easy integrations of ManageEngine Analytics Plus, enhancing functionality and delivering valuable insights seamlessly.
  • Users value the seamless integrations of ManageEngine Analytics Plus, enhancing insights and overall functionality significantly.
  • Users appreciate the dynamic dashboards and effective governance of ManageEngine Analytics Plus, enhancing data management experiences.

What Are Recent G2 Reviews of ManageEngine Analytics Plus?

The Ikigai platform

Ikigai's operational BI platform transforms the way businesses make tactical decisions. Business-user-friendly UI/UX enables anyone to infuse and prepare data and run robust AI-powered analyses to achieve their business goals. DeepMatch stitches together even the most disparate datasets in minutes without any data pre-processing. This patented technology improves over time and learns from humans. The proprietary DeepCasting technology generates forecasts on as little as a few weeks of data, also with higher accuracy than any other method. Instead of comparing a handful of what-if scenarios, Ikigai's proprietary DeepPlan analysis evaluates up to 10^19 options and identifies the most optimal ones for any given parameters. Built upon cutting-edge MIT research on AI and machine learning, Ikigai is uniquely positioned to help operational teams improve the speed and accuracy of their decisions under uncertainty and constant change, ultimately increasing the ROI for their business, while making the latest data science techniques accessible to any data professional. Learn more https://www.ikigailabs.io

Average Rating: 4.6/5.0

Total Reviews: 16

How Do G2 Users Rate The Ikigai platform?

  • Steps to Answer: 8.9/10 (Category avg: 8.4/10)
  • Reports Interface: 9.6/10 (Category avg: 8.8/10)
  • Calculated Fields: 9.5/10 (Category avg: 8.5/10)

Who Is the Company Behind The Ikigai platform?

  • Seller: Celonis
  • Year Founded: 2011
  • HQ Location: New York
  • Twitter: @Celonis
    17,449 Twitter followers
  • LinkedIn® Page: www.linkedin.com
    4,433 employees on LinkedIn®

Who Uses This Product?

  • Company Size: 63% Small, 25% Large

What Are Recent G2 Reviews of The Ikigai platform?

Spotfire Analytics

Spotfire® is a visual data science platform designed to help organizations address complex, industry-specific challenges by effectively utilizing data. This solution offers a range of flexible packaging options tailored to meet the diverse needs of teams at various stages of their visual data science journey. Turn raw data into real-time decisions with powerful, interactive visual analytics with Spotfire® Analytics. Spotfire Analytics is designed for business agility, enabling every user to explore data visually, uncover patterns quickly, and make confident, data-driven decisions without writing a single line of code. As a self-service visual data science solution, it empowers teams across roles and departments to gain fast, actionable insights that drive impact. With its no-code interactive dashboards and rich visual exploration capabilities, Spotfire Analytics connects natively to hundreds of cloud, on-premises, and real-time data sources. Built-in geoanalytics extend the power of analysis with multi-layer mapping and seamless integration of spatial data, while data wrangling and transformation can be performed directly within the visual interface, making it easy to clean, shape, and blend data as you analyze. AI-assisted recommendations and anomaly detection help uncover hidden patterns, suggest the most meaningful visualizations, and accelerate the path to discovery. Customizable visualizations, workflows, and an intuitive interface ensure that insights are not only easier to create but also easier to share. With seamless collaboration features, Spotfire Analytics enables teams to work together, align on insights, and act decisively. Whether the goal is to analyze trends, detect anomalies, or unlock location-based intelligence, Spotfire Analytics delivers the speed, flexibility, and depth needed to make smarter decisions with confidence. Explore and understand your data visually, uncover hidden insights, and build powerful analytics applications - all without writing a single line of code. Spotfire Analytics combines advanced interactive visualizations and intuitive data wrangling in one environment. Connect to hundreds of data sources, from files to real-time streaming data, and transform messy data directly within your visuals. Built-in AI recommendations help you find patterns, anomalies, and trends faster. With flexible visualizations, spatial analytics, and custom applications, anyone can turn raw data into actionable insights in minutes. Designed for business agility, Spotfire Analytics empowers every user to explore, analyze, and share results confidently - turning questions into decisions. Best for: Analysts, data-savvy professionals, and teams looking to explore and share data visually with maximum flexibility.

Average Rating: 4.2/5.0

Total Reviews: 328

How Do G2 Users Rate Spotfire Analytics?

  • Has the product been a good partner in doing business?: 8.4/10 (Category avg: 9.2/10)
  • Steps to Answer: 7.9/10 (Category avg: 8.4/10)
  • Reports Interface: 8.3/10 (Category avg: 8.8/10)
  • Calculated Fields: 8.5/10 (Category avg: 8.5/10)

Who Is the Company Behind Spotfire Analytics?

Who Uses This Product?

  • Who Uses This: Student, Manager
  • Top Industries: Oil & Energy, Information Technology and Services
  • Company Size: 52% Large, 26% Medium

What Do G2 Reviewers Say About Spotfire Analytics?

AI-generated summary from verified user reviews

Pros
  • Users appreciate the powerful and flexible data visualization capabilities of Spotfire Analytics, enhancing their data exploration experience.
  • Users appreciate the ease of use of Spotfire Analytics, enabling quick insights and effective decision-making with complex data.
  • Users appreciate the easy integrations of Spotfire Analytics, enhancing accuracy and enabling robust AI-powered analytics seamlessly.
  • Users rave about Spotfire's powerful analytics capabilities, enabling advanced data handling and insightful visualizations seamlessly.
  • Users love the transformative interactive visualizations of Spotfire, simplifying complex data for clear understanding across teams.
Cons
  • Users find Spotfire's steep learning curve challenging, particularly for those unfamiliar with data modeling and scripting.
  • Users find the learning difficulty significant, especially for beginners navigating advanced features and options in Spotfire.
  • Users find the licensing costs high, making Spotfire Analytics less accessible for smaller organizations.
  • Users often face a steep learning curve with Spotfire Analytics, making initial use challenging for newcomers.
  • Users note that there are limitations in data comparison and features, affecting usability and clarity of Spotfire Analytics.

What Are Recent G2 Reviews of Spotfire Analytics?

What Are G2 Users Discussing About Spotfire Analytics?

Autonmis

𝗔𝘂𝘁𝗼𝗻𝗺𝗶𝘀 - 𝗔𝗜 𝘁𝗼 𝗲𝗹𝗶𝗺𝗶𝗻𝗮𝘁𝗲 𝗯𝘂𝘀𝗶𝗻𝗲𝘀𝘀 𝗼𝗽𝘀 𝗳𝗮𝗶𝗹𝘂𝗿𝗲𝘀 Operations run the business. Yet most teams still rely on spreadsheets, siloed systems, and delayed reports to track issues - creating blind spots across workflows, compliance, and outcomes. 𝗔𝘂𝘁𝗼𝗻𝗺𝗶𝘀 𝗳𝗶𝗹𝗹𝘀 𝘁𝗵𝗮𝘁 𝗺𝗶𝘀𝘀𝗶𝗻𝗴 𝗹𝗮𝘆𝗲𝗿: 𝗕𝘂𝘀𝗶𝗻𝗲𝘀𝘀 𝗢𝗽𝘀 𝗜𝗻𝘁𝗲𝗹𝗹𝗶𝗴𝗲𝗻𝗰𝗲. We plug into your existing tools and workflows, learn what “healthy operations” look like, and help your team detect, diagnose, and de-risk problems in real time: 𝗗𝗲𝘁𝗲𝗰𝘁: Stuck files, delays, mismatches, and broken workflows as they happen. 𝗗𝗶𝗮𝗴𝗻𝗼𝘀𝗲: Root causes across systems, not just surface-level tickets. 𝗗𝗲-𝗿𝗶𝘀𝗸: Early signals on operational, regulatory, customer, or revenue impact. Autonmis doesn’t replace your tools - it connects and illuminates them, giving your team clear visibility, audit-ready insights, and the freedom to focus on impact, not firefighting. For teams of any size managing critical operations, 𝗔𝘂𝘁𝗼𝗻𝗺𝗶𝘀 𝗯𝗲𝗰𝗼𝗺𝗲𝘀 𝘁𝗵𝗲 𝘀𝘆𝘀𝘁𝗲𝗺 𝗯𝗲𝗵𝗶𝗻𝗱 𝘀𝗺𝗼𝗼𝘁𝗵𝗲𝗿, 𝗳𝗮𝘀𝘁𝗲𝗿, 𝗮𝗻𝗱 𝗺𝗼𝗿𝗲 𝗿𝗲𝗹𝗶𝗮𝗯𝗹𝗲 - 𝗶𝗻𝘁𝗲𝗹𝗹𝗶𝗴𝗲𝗻𝘁 𝗯𝘂𝘀𝗶𝗻𝗲𝘀𝘀 𝗼𝗽𝗲𝗿𝗮𝘁𝗶𝗼𝗻𝘀.

Average Rating: 4.6/5.0

Total Reviews: 17

How Do G2 Users Rate Autonmis?

  • Has the product been a good partner in doing business?: 9.2/10 (Category avg: 9.2/10)
  • Steps to Answer: 9.2/10 (Category avg: 8.4/10)
  • Reports Interface: 9.8/10 (Category avg: 8.8/10)
  • Calculated Fields: 9.7/10 (Category avg: 8.5/10)

Who Is the Company Behind Autonmis?

  • Seller: Autonmis
  • Year Founded: 2024
  • HQ Location: Bangalore, IN
  • Twitter: @helloautonmis
    7 Twitter followers
  • LinkedIn® Page: www.linkedin.com
    7 employees on LinkedIn®

Who Uses This Product?

  • Top Industries: Computer Software
  • Company Size: 76% Small, 24% Medium

What Do G2 Reviewers Say About Autonmis?

AI-generated summary from verified user reviews

Pros
  • Users commend the efficiency of Autonmis, streamlining tasks and enhancing productivity with integrated features and AI assistance.
  • Users find Autonmis to be very easy to use, simplifying their data management with all tools integrated on one platform.
  • Users value the time-saving automation of Autonmis, significantly reducing task completion times and enhancing productivity.
  • Users appreciate the easy integrations of Autonmis, which consolidate multiple data management tools into one powerful platform.
  • Users value the AI-powered optimization in Autonmis, transforming complex tasks into faster, efficient processes.
Cons
  • Users find the poor visualization experience challenging, indicating a need for more intuitive and user-friendly design.
  • Users find Autonmis lacking in essential features, noting limited customization, visualization, and analytics capabilities.
  • Users find the limited chart functionality hinders their ability to create intuitive and user-friendly visualizations.
  • Users find the limited customization of Autonmis restricts their ability to create tailored workflows effectively.
  • Users find the dependency issues with Autonmis challenging, suggesting improvements for a smoother, more intuitive experience.

What Are Recent G2 Reviews of Autonmis?

Tellius

Kaiya, our agentic worker, reasons across every data and documents while keeping your definitions and playbooks applied. Then, rather than stopping at the answer like a chat or copilot system, it outputs polished work, fully functional apps, and repeatable (governered) agentic workflows that run recurring work on a schedule and watch the business around the clock. Everywhere your team works Slack/ Teams/ CRM/ ERP etc. Need something new? Describe the tweak to the workflow, the insight, the app and it's tailored on your governed data in minutes. Tellius inherits the semantic layer you already have — Snowflake, dbt, your catalog — instead of replacing it. Connect and Architect resolves your entities and metrics into one model. A deterministic engine handles the numbers, so the answer is the same every run and traceable to source. Governed memory writes approved corrections back, so nothing gets taught twice.

Average Rating: 4.3/5.0

Total Reviews: 27

How Do G2 Users Rate Tellius?

  • Has the product been a good partner in doing business?: 8.6/10 (Category avg: 9.2/10)
  • Steps to Answer: 8.9/10 (Category avg: 8.4/10)
  • Reports Interface: 8.4/10 (Category avg: 8.8/10)
  • Calculated Fields: 8.0/10 (Category avg: 8.5/10)

Who Is the Company Behind Tellius?

  • Seller: Tellius
  • Year Founded: 2016
  • HQ Location: Reston, Virginia
  • Twitter: @TelliusData
    534 Twitter followers
  • LinkedIn® Page: www.linkedin.com
    123 employees on LinkedIn®

Who Uses This Product?

  • Company Size: 41% Large, 33% Medium

What Do G2 Reviewers Say About Tellius?

AI-generated summary from verified user reviews

Pros
  • Users value the data visualization tools of Tellius, appreciating the ability to create interactive and informative dashboards.
  • Users value the advanced analytics capabilities of Tellius, utilizing AI-driven insights for deeper data understanding.
  • Users appreciate the ease of use of Tellius, particularly for its natural language querying capabilities.
  • Users value the advanced analytics capabilities of Tellius, enhancing their ability to uncover insights in data.
  • Users value the advanced analytics capabilities of Tellius, enabling them to uncover hidden patterns and trends effortlessly.
Cons
  • Users express concern over the confusing pricing of Tellius, which may not fit small businesses or startups.
  • Users find Tellius expensive, making it less accessible for small businesses and startups seeking affordable solutions.
  • Users often face integration issues with Tellius, as it lacks the extensive third-party app support of other BI tools.
  • Users mention a complex learning curve with Tellius, making it challenging for those new to advanced analytics.
  • Users experience missing functionality in Tellius, particularly regarding integrations and mobile app capabilities.

What Are Recent G2 Reviews of Tellius?

What Are G2 Users Discussing About Tellius?

ibi WebFOCUS

The ibi WebFOCUS® platform is an enterprise business intelligence and analytics solution equipped with data management, visual discovery, predictive analytics, and powerful visualizations. Combining these capabilities and data science in one unified platform, the WebFOCUS solution helps make data-driven decisions across the enterprise providing reports, dashboards, and customer-facing applications at scale.

Average Rating: 4.4/5.0

Total Reviews: 149

How Do G2 Users Rate ibi WebFOCUS?

  • Has the product been a good partner in doing business?: 8.9/10 (Category avg: 9.2/10)
  • Steps to Answer: 8.0/10 (Category avg: 8.4/10)
  • Reports Interface: 8.7/10 (Category avg: 8.8/10)
  • Calculated Fields: 8.4/10 (Category avg: 8.5/10)

Who Is the Company Behind ibi WebFOCUS?

  • Seller: ibi
  • Year Founded: 1975
  • HQ Location: Fort Lauderdale, FL
  • Twitter: @infobldrs
    32,864 Twitter followers
  • LinkedIn® Page: www.linkedin.com
    890 employees on LinkedIn®
  • Phone: 212-736-4433

Who Uses This Product?

  • Top Industries: Information Technology and Services, Government Administration
  • Company Size: 57% Large, 32% Medium

What Are Recent G2 Reviews of ibi WebFOCUS?

What Are G2 Users Discussing About ibi WebFOCUS?

CorralData

CorralData is an AI-powered analytics platform that transforms how organizations interact with their data, offering businesses instant, actionable insights without requiring technical expertise. Designed with ease of use and speed in mind, CorralData helps businesses quickly centralize and analyze data from over 500 built-in integrations. This vast connectivity allows organizations to unify their data seamlessly, making it accessible and actionable from one central platform. Key Features and Functionality: CorralData is built for non-technical users, enabling them to explore data through natural language queries and generate AI-driven reports effortlessly. The platform includes features like real-time dashboards, customizable reporting, and secure collaboration tools that empower teams to work with data collaboratively and make informed decisions faster. With CorralData, users can simply ask questions in plain English, and the platform instantly translates these queries into data insights, democratizing data access across the organization. Primary Value and Solution: CorralData solves a core challenge for many businesses: transforming complex, siloed data into accessible insights quickly, without the need for lengthy onboarding or engineering support. Traditional BI tools often require specialized teams and long lead times to implement, but CorralData’s intuitive design and instant integration capabilities eliminate these barriers. The platform’s HIPAA-compliant security measures also ensure that data is protected, making it a trusted choice for industries like healthcare and finance. CorralData’s primary value lies in its ability to make data-driven decision-making fast, accessible, and impactful. By equipping business users with immediate insights and robust analytical tools, CorralData enables companies to respond to market changes in real time, optimize operations, and drive growth, all while reducing dependency on technical resources. For businesses aiming to become data-driven overnight, CorralData is an ideal solution.

Average Rating: 4.9/5.0

Total Reviews: 20

How Do G2 Users Rate CorralData?

  • Has the product been a good partner in doing business?: 10.0/10 (Category avg: 9.2/10)
  • Steps to Answer: 9.8/10 (Category avg: 8.4/10)
  • Reports Interface: 9.7/10 (Category avg: 8.8/10)
  • Calculated Fields: 9.2/10 (Category avg: 8.5/10)

Who Is the Company Behind CorralData?

  • Seller: Corraldata
  • Company Website:
  • Year Founded: 2021
  • HQ Location: New York, NY
  • Twitter: @CorralData
    6 Twitter followers
  • LinkedIn® Page: www.linkedin.com
    30 employees on LinkedIn®

Who Uses This Product?

  • Company Size: 50% Medium, 45% Small

What Do G2 Reviewers Say About CorralData?

AI-generated summary from verified user reviews

Pros
  • Users find CorralData's platform incredibly easy to use, streamlining reporting and enhancing data visibility effectively.
  • Users praise the exceptional customer support from CorralData, highlighting their responsive and proactive assistance throughout onboarding and integration.
  • Users praise the ease of implementation with CorralData, highlighting quick setup and efficient support throughout the process.
  • Users value the seamless integrations of CorralData, which unify systems and enhance decision-making effortlessly.
  • Users benefit from the time-saving integration of CorralData, streamlining metrics tracking and enhancing decision-making processes.
Cons
  • Users find the complexity of data validation to be a time-consuming challenge with CorralData's integration process.
  • Users find data inaccuracy problematic, as validating and checking data is often time-consuming and challenging.
  • Users find CorralData expensive compared to other options, though it offers more value for the price.
  • Users struggle with filtering problems, finding it time-consuming to validate data accuracy post-widget creation.
  • Users face long integration times due to complexities associated with Zenoti, impacting overall implementation experience with CorralData.

What Are Recent G2 Reviews of CorralData?

Kyubit Business Intelligence

Kyubit is a collaborative, web-based Business Intelligence platform designed for simplicity, speed, and performance. Easy to implement and intuitive to use, it empowers teams to transform existing data into meaningful insights without complex setup or long development cycles. Kyubit BI connects directly to your SSAS OLAP (Tabular and Multidimensional) models, SQL databases, and Excel/CSV data sources — leveraging your existing infrastructure to deliver fast, visually compelling reports and interactive dashboards. Users can effortlessly slice, drill down, and explore data to uncover the insights that matter most. Advanced analytic capabilities are available both for your existing OLAP databases and for new analytic models created within Kyubit using SQL or Excel/CSV data. This flexibility allows organizations to enhance their current Microsoft BI environment while also expanding their analytics strategy when needed. BI content in Kyubit is secure, centrally managed, and built for collaboration. Reports and dashboards can be safely shared across teams, embedded into other applications, or distributed automatically through scheduled subscriptions. With role-based security and governance controls, organizations maintain full control over their data while enabling broader access to insights. With Kyubit BI, analytic dashboards and reports are created in minutes — not weeks — and are immediately ready for secure collaboration, interactive data exploration, and automated delivery. The result is faster decision-making, reduced reporting bottlenecks, and a more agile approach to enterprise analytics. Kyubit turns your existing data into a powerful, collaborative intelligence platform — helping your organization move from static reporting to dynamic, insight-driven performance.

Average Rating: 4.4/5.0

Total Reviews: 12

How Do G2 Users Rate Kyubit Business Intelligence?

  • Has the product been a good partner in doing business?: 9.4/10 (Category avg: 9.2/10)
  • Reports Interface: 8.1/10 (Category avg: 8.8/10)
  • Calculated Fields: 7.1/10 (Category avg: 8.5/10)

Who Is the Company Behind Kyubit Business Intelligence?

Who Uses This Product?

  • Company Size: 42% Small, 33% Medium

What Are Recent G2 Reviews of Kyubit Business Intelligence?

Infor Birst

Birst is a native cloud business intelligence (BI) and business analytics platform that helps organizations understand and optimize complex processes in less time than traditional BI solutions. Built with patented automation and machine learning technologies, Birst’s Data-as-a-Service approach connects teams and applications across the enterprise via a trusted network of analytics and insights to inform smarter decisions. This unique approach helps leading organizations leverage all their siloed and diverse data sources and extract insights to improve workforce productivity, asset optimization, process efficiencies, and customer satisfaction—often in 90 days or less.

Average Rating: 4.0/5.0

Total Reviews: 84

How Do G2 Users Rate Infor Birst?

  • Has the product been a good partner in doing business?: 8.3/10 (Category avg: 9.2/10)
  • Steps to Answer: 8.3/10 (Category avg: 8.4/10)
  • Reports Interface: 8.3/10 (Category avg: 8.8/10)
  • Calculated Fields: 8.3/10 (Category avg: 8.5/10)

Who Is the Company Behind Infor Birst?

  • Seller: Infor
  • Year Founded: 2002
  • HQ Location: New York
  • Twitter: @Infor
    18,472 Twitter followers
  • LinkedIn® Page: www.linkedin.com
    22,165 employees on LinkedIn®
  • Phone: 800-260-2640

Who Uses This Product?

  • Top Industries: Information Technology and Services, Computer Software
  • Company Size: 44% Medium, 34% Large

What Are Recent G2 Reviews of Infor Birst?

What Are G2 Users Discussing About Infor Birst?

Zenlytic

Most orgs have more data than they know what to do with. Zenlytic changes that. Zenlytic is the AI Data Analyst for your entire org. Zoë answers the hardest questions and builds the decks, memos, and Excel models to back them up. She onboards in under an hour and surfaces verified answers on demand. Companies in retail, SaaS, technology, and finance use Zenlytic to stop waiting on data and start acting on it. Business teams get answers without the backlog. Data teams get out of the weeds. Curious what that looks like for your org? Start here.

Average Rating: 4.1/5.0

Total Reviews: 17

How Do G2 Users Rate Zenlytic?

  • Has the product been a good partner in doing business?: 8.3/10 (Category avg: 9.2/10)
  • Steps to Answer: 5.0/10 (Category avg: 8.4/10)
  • Reports Interface: 8.3/10 (Category avg: 8.8/10)
  • Calculated Fields: 5.0/10 (Category avg: 8.5/10)

Who Is the Company Behind Zenlytic?

  • Seller: Zenlytic
  • Year Founded: 2018
  • HQ Location: New York, US
  • LinkedIn® Page: www.linkedin.com
    34 employees on LinkedIn®

Who Uses This Product?

  • Company Size: 41% Medium, 29% Small

What Are Recent G2 Reviews of Zenlytic?

Explo

Explo provides a powerful embedded dashboard and reporting solution. Securely share customizable product analytics, project reports, and KPIs with each of your customers all while seamlessly matching your product's design. Give your users the power to explore their data on their on by editing dashboards and building their own self serve data reports.

Average Rating: 4.9/5.0

Total Reviews: 137

How Do G2 Users Rate Explo?

  • Has the product been a good partner in doing business?: 9.1/10 (Category avg: 9.2/10)
  • Steps to Answer: 9.2/10 (Category avg: 8.4/10)
  • Reports Interface: 9.2/10 (Category avg: 8.8/10)
  • Calculated Fields: 9.1/10 (Category avg: 8.5/10)

Who Is the Company Behind Explo?

  • Seller: Explo
  • Year Founded: 2019
  • HQ Location: San Francisco, CA
  • Twitter: @tryexplo
    657 Twitter followers
  • LinkedIn® Page: www.linkedin.com
    11 employees on LinkedIn®

Who Uses This Product?

  • Who Uses This: Co-Founder
  • Top Industries: Computer Software, Financial Services
  • Company Size: 77% Small, 22% Medium

What Do G2 Reviewers Say About Explo?

AI-generated summary from verified user reviews

Pros
  • Users praise the flexible charting features of Explo, enabling quick data connection and stunning visualizations.
  • Users love the flexible dashboard customization in Explo, enabling tailored data visualizations and effortless reporting.
  • Users love the ease of use of Explo, enjoying its intuitive UI for quick dashboard creation and customization.
  • Users love the easy creation of customizable dashboards in Explo, enhancing flexibility and speeding up data visualization.
  • Users value the customizability of Explo, allowing easy linking of datasets and intuitive dashboard creation.
Cons
  • Users find the complexity of customer dashboards implementation challenging, with a steep learning curve due to poor design.
  • Users find the complex usage of Explo challenging due to its unintuitive design and difficult learning curve.
  • Users find the initial difficulty in implementing dashboards challenging due to the unintuitive design and complexity.
  • Users find the layout issues of Explo challenging, making dashboard implementation and learning quite complex.
  • Users find the learning curve steep due to the unintuitive design, complicating the implementation of customer-facing dashboards.

What Are Recent G2 Reviews of Explo?

What Are G2 Users Discussing About Explo?

MachEye

MachEye’s augmented analytics platform transforms the way organizations integrate their data, decisions, and operations. While current business intelligence platforms only answer “what” questions on data, MachEye helps users answer “what, why, and how” scenarios for everyone at an organization. Decision makers at any level can now receive actionable insights and recommendations through a “Google like” search experience and “YouTube like” audio-visual experience, in addition to charts and self-service analytics. MachEye adds an actionable “play” button to data! For more information, visit https://www.macheye.com.

Average Rating: 4.7/5.0

Total Reviews: 10

How Do G2 Users Rate MachEye?

  • Has the product been a good partner in doing business?: 8.9/10 (Category avg: 9.2/10)
  • Steps to Answer: 8.3/10 (Category avg: 8.4/10)
  • Reports Interface: 9.4/10 (Category avg: 8.8/10)
  • Calculated Fields: 9.4/10 (Category avg: 8.5/10)

Who Is the Company Behind MachEye?

  • Seller: MachEye
  • Year Founded: 2018
  • HQ Location: San Jose, US
  • Twitter: @MachEyeInc
    58 Twitter followers
  • LinkedIn® Page: www.linkedin.com
    11 employees on LinkedIn®

Who Uses This Product?

  • Company Size: 70% Medium, 20% Large

What Are Recent G2 Reviews of MachEye?

What Are G2 Users Discussing About MachEye?

Tian Lin
TL
Researched and written by Tian Lin
Updated July 2, 2025