Best Observability Software - Page 8

How Many Observability Software Products Does G2 Track?

Total Products under this Category: 134

Category Stats (Sep 2026)

  • Average Rating: 4.56/5 (↑0.01 vs Aug 2026) The average rating of products in this category, based on all submitted ratings
  • Top Trending Product: Honeycomb (+0.62%) - Among all products in this category, Honeycomb recorded the largest rating increase compared to last month

Last updated: September 05, 2026

How Does G2 Rank Observability Software Products?

Why You Can Trust G2's Software Rankings:

  • 30 Analysts and Data Experts
  • 17,700+ Authentic Reviews
  • 134+ Products
  • Unbiased Rankings

G2's software rankings are built on verified user reviews, rigorous moderation, and a consistent research methodology maintained by a team of analysts and data experts. Each product is measured using the same transparent criteria, with no paid placement or vendor influence. While reviews reflect real user experiences, which can be subjective, they offer valuable insight into how software performs in the hands of professionals. Together, these inputs power the G2 Score, a standardized way to compare tools within every category.

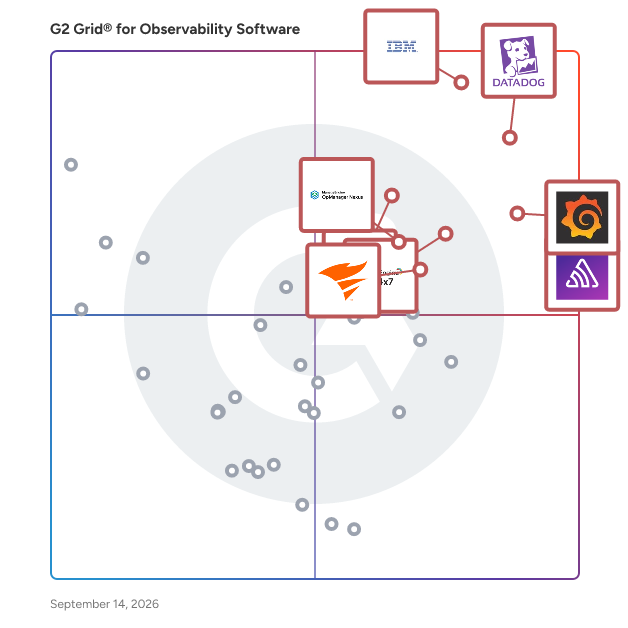
G2 Grid® for Observability Software

G2 Grid® for Observability Software plotting products by satisfaction and market presence

Highlighted products: IBM Instana, Datadog, Sentry, Grafana Labs, Site24x7, Dynatrace, OpManager Nexus, and SolarWinds Observability.

Underlying data: [Grid® JSON](https://www.g2.com/categories/observability-software/grids.json?focus%5B%5D=ibm-instana&focus%5B%5D=datadog&focus%5B%5D=sentry&focus%5B%5D=grafana-labs&focus%5B%5D=site24x7&focus%5B%5D=dynatrace&focus%5B%5D=opmanager-nexus&focus%5B%5D=solarwinds-worldwide-llc-solarwinds-observability)

Overwatch

Overwatch is an on-premises observability appliance that unifies monitoring of Nutanix HCI, server hardware, the network, data protection, and Windows/Linux workloads into a single correlated view. Most infrastructure teams run a different tool for each layer of the stack: one for virtualization, another for hardware health, another for the network, another for backups. Overwatch replaces that patchwork. It collects from all of those domains and correlates them, so an operator can trace cause and effect across the entire environment from one pane of glass, without sending any data to the cloud. Overwatch deploys as a self-contained appliance inside your own datacenter. It natively monitors Nutanix AHV, Prism Element, and Prism Central (clusters, hosts, VMs, storage, capacity, DR, Nutanix Files, and Nutanix Kubernetes Platform), and ties each virtual machine back to the physical host, the switch port it depends on, and the underlying server hardware. Server hardware is monitored over IPMI and Redfish for power, thermals, CPU, memory, storage, and firmware, with failing components correlated to the Nutanix host that owns them. On the network side, Overwatch adds multi-vendor SNMP monitoring, auto-discovered L2/L3 topology, routing (BGP/OSPF), configuration backup with diff and rollback, IPAM, and NetFlow/IPFIX traffic analysis with built-in threat detection. It also provides HYCU backup observability, Windows and Linux workload monitoring, an application dependency map, and UPS/battery power monitoring for capacity planning. Because everything is correlated in one place, teams spend less time stitching signals together across tools and more time resolving issues. Unified alerting, a real-time Command Center overview, custom dashboards, and exportable reports (CSV, JSON, PDF) round out the platform.

Who Is the Company Behind Overwatch?

Papaya

Papaya is the optimization engine for AI agents. Engineers don't have time to continually improve the agents they've shipped — the context bloat, overly chatty subagents, and broken tool calls sit in production traces nobody reads. With Papaya they connect their agent directly via SDK, get actionable recommendations on how to improve quality, latency, and cost, and the ones they approve are pushed to production as pull requests. Papaya runs 200+ research-backed analyses across context, prompts, prompt caching, subagents, and tool calls. Every recommendation is ranked by impact and comes with the production runs that produced it — typically a 10%+ quality improvement on the first workflow analysis.

Who Is the Company Behind Papaya?

  • Seller: Papaya
  • Year Founded: 2026
  • HQ Location: San Francisco, US
  • LinkedIn® Page: www.linkedin.com
    1 employees on LinkedIn®

Process Radar

Process Radar is a process intelligence platform for IT service management. It automatically analyzes ticket workflow data to detect structural anomalies — routing loops, bottlenecks, cascade effects, and capacity issues — that traditional dashboards miss. Instead of more charts, Process Radar surfaces prioritized situations with clear delegation workflows, helping IT leaders identify where to invest in efficiency, gain systemic visibility beyond conflicting perspectives, and find the highest-leverage intervention points.

Who Is the Company Behind Process Radar?

  • Seller: DataKyra
  • Year Founded: 2018
  • HQ Location: Zorneding, DE
  • LinkedIn® Page: www.linkedin.com
    2 employees on LinkedIn®

Riverbed NPM+

Riverbed NPM+ is a SaaS-based network observability solution that provides IT teams with unparalleled visibility into network performance across diverse environments, including remote work setups, cloud-native infrastructures, and Zero Trust architectures. By utilizing the Riverbed Unified Agent, NPM+ collects packet data at every user and server endpoint before encryption, effectively eliminating blind spots caused by encrypted tunnels and ensuring comprehensive monitoring capabilities. Key Features and Functionality: - Comprehensive Packet Capture: NPM+ captures and analyzes packet data from all endpoints, including remote users, hybrid access points, cloud services, and Zero Trust environments, ensuring no area of the network is left unmonitored. - Simplified Deployment and Management: The Riverbed Unified Agent streamlines the deployment process by consolidating monitoring capabilities into a single, lightweight footprint, reducing complexity and administrative overhead. - Advanced Diagnostics and Troubleshooting: NPM+ offers smart, interactive workflows that facilitate rapid root cause analysis, diagnostics, and resolution, minimizing downtime and enhancing service availability. - Unified Communications Monitoring: The solution provides real-time monitoring for VoIP and video conferencing platforms, including Microsoft Teams, Zoom, WebEx, and Google Meet, ensuring optimal performance of unified communications. - Enhanced Security Monitoring: NPM+ integrates security monitoring alongside network performance metrics, allowing IT teams to detect potential security threats while managing performance, thereby safeguarding sensitive data. Primary Value and User Solutions: Riverbed NPM+ addresses the critical need for comprehensive network visibility in today's complex IT landscapes. By eliminating blind spots caused by encrypted tunnels and remote work scenarios, it empowers IT teams to detect and resolve issues swiftly, reducing downtime and ensuring superior service availability. The solution's advanced diagnostics and unified communications monitoring enhance overall network performance, while its security monitoring capabilities protect against potential threats. Ultimately, NPM+ enables organizations to maintain optimal network health, support seamless remote work experiences, and uphold stringent security standards.

Who Is the Company Behind Riverbed NPM+?

  • Seller: Riverbed Technology
  • Year Founded: 2002
  • HQ Location: San Francisco, CA
  • Twitter: @RIVERBED
    23,829 Twitter followers
  • LinkedIn® Page: www.linkedin.com
    1,590 employees on LinkedIn®

Riverbed Portal

Riverbed Portal is a centralized, dynamic visibility solution that integrates user experience, application, and network data into unified dashboards. This comprehensive observability platform enables IT teams to quickly detect and resolve issues, enhancing performance management across the enterprise. By providing a single source of truth, Riverbed Portal redefines how organizations visualize, monitor, and troubleshoot problems, allowing resources to focus on strategic initiatives. Key Features and Functionality: - Total Visibility: Offers holistic visibility across the entire enterprise, including on-premises, private, public, and hybrid cloud environments, all accessible from a single dashboard. - Improved IT Collaboration: Unifies data from network flows, packets, device metrics, application transactions, user experiences, and synthetic tests into a powerful console, enabling seamless collaboration among IT operations teams. - Accelerated Diagnosis and Resolution: Provides a unified view of the IT environment, revolutionizing how organizations visualize, monitor, and troubleshoot applications, thereby speeding up issue resolution. Primary Value and User Solutions: Riverbed Portal simplifies performance management by consolidating diverse data sources into cohesive dashboards, offering comprehensive observability. This integration allows IT teams to detect and resolve issues swiftly, improving overall operational efficiency. By serving as a single source of truth, it enhances collaboration, reduces downtime, and frees up resources for strategic projects, ultimately delivering valuable insights across the enterprise.

Who Is the Company Behind Riverbed Portal?

  • Seller: Riverbed Technology
  • Year Founded: 2002
  • HQ Location: San Francisco, CA
  • Twitter: @RIVERBED
    23,829 Twitter followers
  • LinkedIn® Page: www.linkedin.com
    1,590 employees on LinkedIn®

Sazabi

Who Is the Company Behind Sazabi?

  • Seller: Sazabi
  • Year Founded: 2025
  • HQ Location: N/A
  • LinkedIn® Page: www.linkedin.com
    11 employees on LinkedIn®

Sematext Cloud

Sematext Cloud is an innovative, unified platform with all-in-one solutions for infrastructure monitoring, application performance monitoring, log management, real user monitoring, and synthetic monitoring to provide unified, real-time observability of your entire technology stack. It's used by organizations of all sizes and across a wide range of industries, with the goal of driving collaboration between engineering and business teams, reduce the time of root-cause-analysis, understand user behavior and track key business metrics.

Average Rating: 4.7/5.0

Total Reviews: 38

Who Is the Company Behind Sematext Cloud?

  • Seller: Sematext
  • Year Founded: 2007
  • HQ Location: Brooklyn, NY
  • Twitter: @sematext
    3,758 Twitter followers
  • LinkedIn® Page: www.linkedin.com
    16 employees on LinkedIn®

Who Uses This Product?

  • Top Industries: Information Technology and Services
  • Company Size: 47% Medium, 45% Small

What Are Recent G2 Reviews of Sematext Cloud?

What Are G2 Users Discussing About Sematext Cloud?

Sentrock

Sentrock is a product health monitoring platform for SaaS teams. Infrastructure monitoring tells you your servers are up. It doesn't tell you your product actually works: that payments complete, logins succeed, and the sync job is really syncing. Teams with green Datadog dashboards still find out about breakage from customer support tickets, and by then trust is already damaged. Sentrock is a health monitoring platform for all the products a company runs. Enterprises operate dozens or hundreds of purchased tools and products, and there is no single place to see the state of them all: whether each one is up, configured correctly, actually being used to its full capability, and worth its licensing cost. Today that picture lives across a dozen vendor consoles, spreadsheets, and tribal knowledge. Infrastructure monitoring doesn't answer it, because the question isn't 'is the server up,' it's 'is this product doing what we bought it to do.' Teams find out the answer is no when something breaks, an audit finds the gap, or a renewal invoice arrives for a tool nobody fully uses. Sentrock gives each team one place to define what healthy means for every product in their estate. Teams onboard their products, then create health rules across availability, performance, security, configuration, and compliance, from standard checks down to custom Python logic that runs in an isolated sandbox on their schedule. Every product shows as healthy, degraded, or unhealthy on one dashboard with full status history, and the owning team is alerted the moment a rule degrades rather than after it fails. Sentrock also watches the failure modes nobody owns: expiring credentials and service accounts get advance warnings at 90, 30, 7, and 1 days instead of silently breaking an integration at 3am.

Who Is the Company Behind Sentrock?

ServiceNow Cloud Observability (formerly LightStep)

Lightstep’s observability platform is the easiest way for developers and SREs to monitor health and respond to changes in cloud-native applications. Powered by cutting-edge distributed tracing and a groundbreaking metrics database, and built by the team that launched observability at Google, Lightstep’s Change Intelligence provides actionable insights to help teams answer the question “What caused that change? Lightstep empowers reliability and observability managers to minimize the impact of outages, improve software performance, and build org-wide standards to drive adoption and automation.

Average Rating: 4.6/5.0

Total Reviews: 19

Who Is the Company Behind ServiceNow Cloud Observability (formerly LightStep)?

  • Seller: ServiceNow
  • Year Founded: 2004
  • HQ Location: Santa Clara, CA
  • Twitter: @servicenow
    55,548 Twitter followers
  • LinkedIn® Page: www.linkedin.com
    35,078 employees on LinkedIn®
  • Ownership: NYSE:NOW

Who Uses This Product?

  • Top Industries: Computer Software
  • Company Size: 45% Large, 35% Medium

What Are Recent G2 Reviews of ServiceNow Cloud Observability (formerly LightStep)?

ServicePilot

ServicePilot is a comprehensive, intelligent observability platform designed to help organizations maintain high‑performing, resilient IT environments. By unifying metrics, traces, logs and topology insights into a single, cohesive solution, ServicePilot enables IT teams to detect issues earlier, troubleshoot faster and prevent outages before they impact users or business operations. Its mission is simple: deliver full‑stack visibility that empowers organizations to ensure the continuity, reliability and performance of their digital services. Modern IT environments are increasingly complex, spanning on‑premise infrastructure, hybrid architectures, cloud‑native applications and legacy systems that still play a critical role. ServicePilot brings clarity to this complexity by consolidating monitoring across: - Servers - Networks - Applications - Websites - Databases - Telephony systems - Mainframes - IT and IoT infrastructure - And more. This unified approach eliminates operational silos and provides a single source of truth for IT operations, DevOps and SRE teams. At the core of the platform is an intelligent analytics engine that correlates data from every layer of the stack. By combining real‑time telemetry with automated detection, dynamic dashboards and contextual insights, ServicePilot helps teams quickly identify root causes, reduce mean time to resolution and optimize performance. Whether the challenge is application latency, network degradation, infrastructure saturation, or service disruptions, ServicePilot equips teams with the visibility and intelligence needed to act decisively. Beyond monitoring, ServicePilot delivers a scalable observability foundation that grows with the organization. Its extensive library of integrations, customizable dashboards and automated discovery capabilities make it easy to adapt to evolving architectures and emerging technologies. With a focus on simplicity, speed and actionable insights, ServicePilot helps IT teams shift from reactive firefighting to proactive service assurance. ServicePilot continues to innovate to meet the demands of modern IT operations, offering a powerful, unified platform that strengthens reliability, improves user experience and supports long‑term digital transformation. ServicePilot is available in both SaaS and On‑Premise deployment models, offering flexibility for organizations with diverse operational, regulatory, or security requirements. Enterprises, government agencies and managed service providers rely on ServicePilot to support mission‑critical environments where uptime, performance and compliance are non‑negotiable.

Who Is the Company Behind ServicePilot?

  • Seller: ServicePilot
  • Year Founded: 2001
  • HQ Location: Pornichet, FR
  • Twitter: @ServicePilot
    39 Twitter followers
  • LinkedIn® Page: www.linkedin.com
    10 employees on LinkedIn®

Splunk IT Service Intelligence‎ (ITSI)

Splunk IT Service Intelligence (ITSI) is an AIOps and event management solution that correlates and applies machine learning to all data for real-time, predictive performance monitoring and integrated IT management workflows. This enables teams to prevent incidents before they impact the business, and detect, respond and resolve incidents all from one place.

Average Rating: 4.9/5.0

Total Reviews: 5

Who Is the Company Behind Splunk IT Service Intelligence‎ (ITSI)?

  • Seller: Cisco
  • Year Founded: 1984
  • HQ Location: San Jose, CA
  • Twitter: @Cisco
    720,366 Twitter followers
  • LinkedIn® Page: www.linkedin.com
    95,294 employees on LinkedIn®
  • Ownership: NASDAQ:CSCO

Who Uses This Product?

  • Company Size: 80% Large, 20% Small

What Are Recent G2 Reviews of Splunk IT Service Intelligence‎ (ITSI)?

What Are G2 Users Discussing About Splunk IT Service Intelligence‎ (ITSI)?

SquaredUp

SquaredUp is a unified observability portal. Say goodbye to blind spots and data silos. Using data mesh and cutting-edge data visualization, SquaredUp gives IT and engineering teams one place to see everything that matters. Bring together data from across your tech stack without the headache of moving the data. Unlike other monitoring and observability tools that rely on a data warehouse, SquaredUp leaves your data where it is, plugging directly into each data source to index and stitch the data together using a data mesh. Teams have one place to go where they can search, visualize, and analyze data across all their tools. Take control of infrastructure, application, and product performance with unified visibility. Learn more at squaredup.com What you get: > Cutting-edge data visualization > Access to 100+ data sources > Any custom data source via Web API > Multi-cloud observability > Cost monitoring > Unlimited dashboards > Unlimited monitors Key features: > Out-of-box dashboards > Simple, flexible dashboard designer > Real-time monitoring > High-level roll-up views > Object drill downs > Notifications (Slack, Teams, email, etc.) > SQL analytics Free for up to 3 users. Head over to SquaredUp - The Unified Observability Portal to learn more >>> https://squaredup.com/ We also have a dedicated SCOM product, Dashboard Server for SCOM. See our product page to learn how we help to transform SCOM with end-to-end visibility >>> https://ds.squaredup.com/ To find out what plan is best for you, go to >>> https://squaredup.com/pricing/

Average Rating: 4.9/5.0

Total Reviews: 15

Who Is the Company Behind SquaredUp?

  • Seller: SquaredUp
  • Year Founded: 2011
  • HQ Location: Maidenhead, GB
  • Twitter: @squared_up
    1,170 Twitter followers
  • LinkedIn® Page: www.linkedin.com
    80 employees on LinkedIn®

Who Uses This Product?

  • Company Size: 60% Large, 33% Medium

What Do G2 Reviewers Say About SquaredUp?

AI-generated summary from verified user reviews

Pros
  • Users appreciate the easy dashboard customization in SquaredUp, enhancing their ability to visualize system performance effortlessly.
  • Users value the ease of visualization in SquaredUp, enhancing clarity and reducing stress in monitoring systems.
  • Users appreciate the interactive dashboard quality of SquaredUp, making it easy to visualize system data effectively.
  • Users appreciate the interactive dashboards of SquaredUp for their clarity and ease of use across systems.
  • Users appreciate the easy-to-use interactive dashboards of SquaredUp, enhancing visibility and simplifying system monitoring.
Cons
  • Users face a noticeable learning curve and prolonged setup times with SquaredUp, impacting initial user experience.
  • Users note a complex setup process for integrations and visualizations, requiring time and patience to master.
  • Users find the configuration difficulty of SquaredUp can be time-consuming and requires a steep learning curve.
  • Users report a difficult configuration process with SquaredUp, requiring patience and time for custom setups and integrations.
  • Users experience a noticeable learning curve when trying to fully utilize SquaredUp's features, requiring extra patience.

What Are Recent G2 Reviews of SquaredUp?

What Are G2 Users Discussing About SquaredUp?

Superlog

Who Is the Company Behind Superlog?

  • Seller: Superlog
  • Year Founded: 2026
  • HQ Location: San Francisco, US
  • LinkedIn® Page: www.linkedin.com
    2 employees on LinkedIn®

Sycope

Sycope was created and developed by engineers who have been working in the fields of network performance, application efficiency, and IT security for over 20 years. Our mission is to provide intelligent tools that automate network monitoring, ensuring the stability, security, and performance of IT infrastructures worldwide. Sycope is a real-time network traffic monitoring and security tool. It addresses the challenges posed by limited visibility, unpredictable network and application performance, and increasing cybersecurity threats, using four smart modules: Visibility, Performance, Security, and Asset Discovery. What differentiates Sycope? Collecting data from sources that others cannot Automatic alerting based on multiple data sources Customizable without development Scalable data retention – compliance, security, performance Business continuity – constant high performance 24/7

Who Is the Company Behind Sycope?

  • Seller: Sycope
  • Year Founded: 2019
  • HQ Location: Warszawa, PL
  • Twitter: @SycopeIT
    17 Twitter followers
  • LinkedIn® Page: pl.linkedin.com
    23 employees on LinkedIn®
  • Phone: +48 691 512 219
Tian Lin
TL
Researched and written by Tian Lin
Updated June 12, 2025