# Best Enterprise Monitoring Software - Page 2

## How Many Enterprise Monitoring Software Products Does G2 Track?

**Total Products under this Category:** 74

### Category Stats (Aug 2026)

- **Average Rating:** 4.49/5 (↑0.01 vs Jul 2026) The average rating of products in this category, based on all submitted ratings
- **Top Trending Product:** Motadata ObserveOps (+1.35%) - Among all products in this category, Motadata ObserveOps recorded the largest rating increase compared to last month

_Last updated: August 04, 2026_

## How Does G2 Rank Enterprise Monitoring Software Products?

**Why You Can Trust G2's Software Rankings:**

- 30 Analysts and Data Experts
- 8,700+ Authentic Reviews
- 74+ Products
- Unbiased Rankings

G2's software rankings are built on verified user reviews, rigorous moderation, and a consistent research methodology maintained by a team of analysts and data experts. Each product is measured using the same transparent criteria, with no paid placement or vendor influence. While reviews reflect real user experiences, which can be subjective, they offer valuable insight into how software performs in the hands of professionals. Together, these inputs power the G2 Score, a standardized way to compare tools within every category.

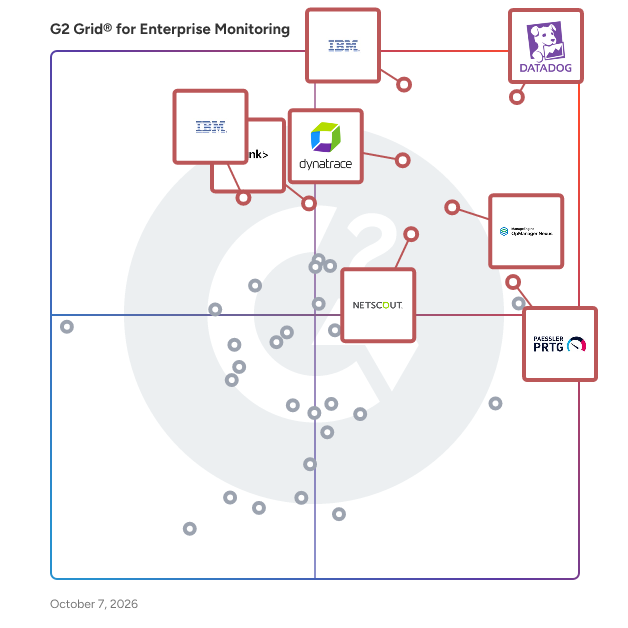
## G2 Grid® for Enterprise Monitoring Software
 ![G2 Grid® for Enterprise Monitoring Software plotting products by satisfaction and market presence](https://www.g2.com/categories/enterprise-monitoring/grids.png?focus%5B%5D=3824&focus%5B%5D=2056&focus%5B%5D=10874&focus%5B%5D=17351&focus%5B%5D=75171&focus%5B%5D=2965&focus%5B%5D=27540&focus%5B%5D=17801)

Highlighted products: Datadog, Dynatrace, Paessler PRTG, OpManager Nexus, NETSCOUT Network & Application Observability, Splunk Enterprise, IBM Instana, and IBM SevOne.

Underlying data: [Grid® JSON](https://www.g2.com/categories/enterprise-monitoring/grids.json?focus%5B%5D=datadog&focus%5B%5D=dynatrace&focus%5B%5D=paessler-prtg&focus%5B%5D=opmanager-nexus&focus%5B%5D=netscout-network-application-observability&focus%5B%5D=splunk-enterprise&focus%5B%5D=ibm-instana&focus%5B%5D=ibm-sevone&segment=enterprise)

**Sponsored**

### Google Cloud Monitoring

Cloud Monitoring collects metric data and provides tools that let you monitor and visualize how your applications and services are performing.

[Visit website](https://www.g2.com/external_clickthroughs/record?secure%5Bad_program%5D=ppc&secure%5Bad_slot%5D=category_product_list_llm&secure%5Bcategory_id%5D=2126&secure%5Bchosen_at%5D=2026-08-11T20%3A30%3A38Z&secure%5Bdisplayable_resource_id%5D=2126&secure%5Bdisplayable_resource_type%5D=Category&secure%5Bmedium%5D=sponsored&secure%5Bplacement_reason%5D=page_category&secure%5Bplacement_resource_ids%5D%5B%5D=2126&secure%5Bprioritized%5D=false&secure%5Bproduct_id%5D=40548&secure%5Bresource_id%5D=2126&secure%5Bresource_type%5D=Category&secure%5Bsource_type%5D=category_page&secure%5Bsource_url%5D=https%3A%2F%2Fwww.g2.com%2Fcategories%2Fenterprise-monitoring%2Fenterprise%3Fpage%3D2&secure%5Btoken%5D=c84182a190b8539764011ecd25b1c5a3f7bea3ec8d6c396e77d7a9bac904fa05&secure%5Burl%5D=https%3A%2F%2Fcloud.google.com%2Fmonitoring%2F%3Futm_source%3DG2%26utm_medium%3Ddisplay%26utm_campaign%3DCloud-SS-DR-GCP-1713658-GCP-DR-NA-US-en-G2-Display-Banner-All-%25epid%21-%25ecid%21-monitoring%26utm_content%3D%7Bdevice%7D-%7Badgroupid%7D-%7Bnetwork%7D-%7Btargetid%7D-%7Bloc_physical_ms%7D-%7Bcampaignid%7D&secure%5Burl_type%5D=custom_url)

### [Zabbix](https://www.g2.com/products/zabbix/reviews)

Zabbix is an all-in-one, open source monitoring and observability solution that makes any hardware, software, service, or web application more efficient and reliable. Available on-premise and in the cloud, Zabbix can deploy anywhere and monitor any device, system, or app in any environment – while providing comprehensive data protection, easy integration, and limitless data visualization options. Zabbix uses a wide range of data collection methods to collect metrics, defining smart problem thresholds and harnessing the power of machine learning to suppress unwanted alert storms and notify users regarding the root cause of issues. Metrics are displayed on intuitive, easy-to-understand dashboards that allow users to access issues, reports, and maps with a single click. Users can monitor anything from physical and virtual servers or containers to network infrastructure and applications. Zabbix allows users to: • Control their infrastructure by collecting any metric from any source • Detect problems instantly • Get alerted on critical issues • Gain additional insights and extend observability via powerful data visualization • Leverage a single pane of glass for an entire infrastructure • Keep track of KPI's with business service monitoring • Seamlessly deploy Zabbix within any infrastructure • Deploy with just a few clicks, either on-premise or in the cloud • Scale quickly and without limits • Do business with the peace of mind that enterprise-grade security provides Zabbix also offers a full range of professional services, including: • Technical support subscriptions • Zabbix professional training • Migration • Upgrades • Template building • Development • Integration • Consulting • Turnkey solution

**Average Rating:** 4.3/5.0

**Total Reviews:** 206

#### How Do G2 Users Rate Zabbix?

- **Has the product been a good partner in doing business?:** 8.1/10 (Category avg: 8.8/10)
- **Dashboards and Visualization:** 8.8/10 (Category avg: 8.7/10)
- **Observability:** 8.6/10 (Category avg: 9.0/10)
- **Single Pane of Glass:** 9.1/10 (Category avg: 8.8/10)

#### Who Is the Company Behind Zabbix?

- **Seller:** [Zabbix](https://www.g2.com/sellers/zabbix)
- **Company Website:** www.zabbix.com
- **Year Founded:** 2005
- **HQ Location:** Riga, Latvia
- **Twitter:** @zabbix  
9,943 Twitter followers
- **LinkedIn® Page:** [www.linkedin.com](https://www.g2.com/external_clickthroughs/record?secure%5Bsource_type%5D=product_profile&secure%5Btoken%5D=becb6bf7d3bb131e8435950df03ebb44adb49a62b152a824ecbe83b9f6712048&secure%5Burl%5D=https%3A%2F%2Fwww.linkedin.com%2Fcompany%2F2476879%2F&secure%5Burl_type%5D=linkedin_company_website)  
170 employees on LinkedIn®

#### Who Uses This Product?

- **Top Industries:** Information Technology and Services, Telecommunications
- **Company Size:** 61% Medium, 27% Large

#### What Do G2 Reviewers Say About Zabbix?

_AI-generated summary from verified user reviews_

##### Pros

- Users value the **customizable alerts** and fast notifications of Zabbix, enhancing their monitoring experience effectively.
- Users appreciate the **ease of use** of Zabbix, finding integration and setup remarkably straightforward and efficient.
- Users value the **robust monitoring capabilities** of Zabbix, effectively overseeing their networks, servers, and applications.
- Users appreciate the **monitoring ease** of Zabbix, benefiting from its intuitive dashboard and prompt alerting capabilities.
- Users love the **real-time monitoring** capabilities of Zabbix, providing fast alerts and comprehensive infrastructure oversight.

##### Cons

- Users face a challenging **learning curve** initially, which can complicate the early experience with Zabbix.
- Users find the **dashboard limitations** frustrating, as it doesn't fully meet their expectations for data presentation.
- Users find **data limitations** in Zabbix, leading to unmet expectations and suggestions for improved customization options.
- Users find the **difficult configuration** of Zabbix challenging, especially for newcomers during setup and alert implementation.
- Users find the **difficult learning curve** challenging at first, especially with dashboard limitations and fast updates.

#### What Are Recent G2 Reviews of Zabbix?

**["Powerful, Flexible Monitoring with Highly Customizable Dashboards and Alerts"](https://www.g2.com/survey_responses/zabbix-review-12824684)**

**Rating:** 4.0/5.0 stars

_— Deepanshu N._

[Read full review](https://www.g2.com/survey_responses/zabbix-review-12824684)

**["Robust Real-Time Infrastructure Monitoring with Helpful Alerts and Reports"](https://www.g2.com/survey_responses/zabbix-review-12661459)**

**Rating:** 4.5/5.0 stars

_— Ratin S._

[Read full review](https://www.g2.com/survey_responses/zabbix-review-12661459)

#### What Are G2 Users Discussing About Zabbix?

- [What is Zabbix used for?](https://www.g2.com/discussions/what-is-zabbix-used-for) - 2 comments
- [Is zabbix a DevOps tool?](https://www.g2.com/discussions/is-zabbix-a-devops-tool) - 1 comment
- [Is zabbix safe?](https://www.g2.com/discussions/is-zabbix-safe) - 1 comment
- [How does Zabbix monitoring work?](https://www.g2.com/discussions/how-does-zabbix-monitoring-work)
- [What can you monitor with Zabbix?](https://www.g2.com/discussions/what-can-you-monitor-with-zabbix) - 1 comment

### [Splunk Infrastructure Monitoring](https://www.g2.com/products/splunk-infrastructure-monitoring/reviews)

SignalFx is the only real-time cloud monitoring platform for infrastructure, microservices, and applications. The platform discovers and collects metrics across every component in your cloud environment, replacing traditional point tools and providing real-time predictive analytics. The massively scalable SignalFx architecture is optimized for cloud infrastructure and microservices-based applications, It provides powerful visualization, proactive alerting, and collaborative triage capabilities for organizations of all sizes. SignalFx is used by leading enterprises across high tech, financial services, consumer products, retail, communications, media, entertainment, and web-scale players like Yelp, HubSpot, Acquia, and Kayak. SignalFx is venture-funded by Andreessen Horowitz, Charles River Ventures, and General Catalyst

**Average Rating:** 4.3/5.0

**Total Reviews:** 49

#### How Do G2 Users Rate Splunk Infrastructure Monitoring?

- **Has the product been a good partner in doing business?:** 9.2/10 (Category avg: 8.8/10)
- **Dashboards and Visualization:** 9.3/10 (Category avg: 8.7/10)
- **Observability:** 9.0/10 (Category avg: 9.0/10)
- **Single Pane of Glass:** 9.2/10 (Category avg: 8.8/10)

#### Who Is the Company Behind Splunk Infrastructure Monitoring?

- **Seller:** [Cisco](https://www.g2.com/sellers/cisco)
- **Year Founded:** 1984
- **HQ Location:** San Jose, CA
- **Twitter:** @Cisco  
720,366 Twitter followers
- **LinkedIn® Page:** [www.linkedin.com](https://www.g2.com/external_clickthroughs/record?secure%5Bsource_type%5D=product_profile&secure%5Btoken%5D=476aeabc5a712d049453edd5c54ea0318890d9e60d93782e37fe028224df1cbd&secure%5Burl%5D=https%3A%2F%2Fwww.linkedin.com%2Fcompany%2Fcisco%2F&secure%5Burl_type%5D=linkedin_company_website)  
95,545 employees on LinkedIn®
- **Ownership:** NASDAQ:CSCO

#### Who Uses This Product?

- **Who Uses This:** Software Engineer
- **Top Industries:** Computer Software, Information Technology and Services
- **Company Size:** 45% Large, 37% Medium

#### What Do G2 Reviewers Say About Splunk Infrastructure Monitoring?

_AI-generated summary from verified user reviews_

##### Pros

- Users find Splunk Infrastructure Monitoring to be **easy to use** , offering versatile modules and seamless integrations for effective monitoring.
- Users value the **real-time monitoring** capabilities of Splunk, ensuring optimal performance and minimal production downtime.
- Users appreciate the **flexible log aggregation and monitoring features** of Splunk, enhancing infrastructure and security management.
- Users appreciate the **real-time monitoring** capabilities of Splunk, ensuring optimal performance and minimizing downtime across systems.
- Users value the **real-time monitoring capabilities** of Splunk Infrastructure Monitoring for ensuring smooth operations and performance.

##### Cons

- Users find Splunk Infrastructure Monitoring to be **expensive** , especially for large data volumes and a steep learning curve.
- Users find the **steep learning curve** of Splunk Infrastructure Monitoring challenging, especially for customization and complex queries.
- Users find the **difficult learning** curve of Splunk Infrastructure Monitoring challenging, hindering efficient use of the product.
- Users find the **learning difficulty** significant due to the steep curve and non-intuitive features of Splunk Infrastructure Monitoring.
- Users find **complex pricing** challenging, as costs escalate significantly with large data volumes from multiple devices.

#### What Are Recent G2 Reviews of Splunk Infrastructure Monitoring?

**["Splunk: Infrastructure Monitoring Application"](https://www.g2.com/survey_responses/splunk-infrastructure-monitoring-review-9103873)**

**Rating:** 4.5/5.0 stars

_— Verified User in Information Technology and Services_

[Read full review](https://www.g2.com/survey_responses/splunk-infrastructure-monitoring-review-9103873)

**["Versatile suite of tools for various security needs"](https://www.g2.com/survey_responses/splunk-infrastructure-monitoring-review-7975767)**

**Rating:** 4.5/5.0 stars

_— Verified User in Telecommunications_

[Read full review](https://www.g2.com/survey_responses/splunk-infrastructure-monitoring-review-7975767)

#### What Are G2 Users Discussing About Splunk Infrastructure Monitoring?

- [Why did splunk buy SignalFx?](https://www.g2.com/discussions/splunk-infrastructure-monitoring-why-did-splunk-buy-signalfx)
- [Why did splunk buy SignalFx?](https://www.g2.com/discussions/why-did-splunk-buy-signalfx)
- [What is SignalFx?](https://www.g2.com/discussions/splunk-infrastructure-monitoring-what-is-signalfx)
- [What is SignalFx?](https://www.g2.com/discussions/what-is-signalfx)
- [What can splunk monitor?](https://www.g2.com/discussions/what-can-splunk-monitor)

### [UptimeRobot](https://www.g2.com/products/uptimerobot/reviews)

The free online uptime monitoring service with an App available for iOS and Android (https://uptimerobot.com). With the Free Plan, you can monitor up to 50 URLs, check for the content of a website (using the keyword monitor), ping your server or monitor your ports in 5-minute intervals. You can create a status page to showcase your uptime. SMS or Call alerts can be bought anytime. Receive notifications via email, phone call, SMS, or integrations like Microsoft Teams, Telegram, Slack, Twitter, Zapier, Pagerduty, Splunk On-Call, Pushbullet, Webhooks, Google Chat, or Pushover. Upgrade to Pro to get more monitors, 1-minute intervals, unlimited status pages that you can customize, share announcements on your status page to which your customers can subscribe and receive them via email. With the Pro Plan, you can monitor SSL certificates or use the Heartbeat monitor to keep an eye on your cron jobs. Adjust and manage your monitoring with maintenance windows or advanced notifications, to avoid getting alerts during maintenance, or to receive notifications after a certain time of downtime.

**Average Rating:** 4.7/5.0

**Total Reviews:** 301

#### How Do G2 Users Rate UptimeRobot?

- **Has the product been a good partner in doing business?:** 9.5/10 (Category avg: 8.8/10)
- **Dashboards and Visualization:** 5.0/10 (Category avg: 8.7/10)
- **Single Pane of Glass:** 10.0/10 (Category avg: 8.8/10)

#### Who Is the Company Behind UptimeRobot?

- **Seller:** [Uptime Robot](https://www.g2.com/sellers/uptime-robot)
- **Year Founded:** 2010
- **HQ Location:** Sliema, Malta
- **Twitter:** @uptimerobot  
17,426 Twitter followers
- **LinkedIn® Page:** [www.linkedin.com](https://www.g2.com/external_clickthroughs/record?secure%5Bsource_type%5D=product_profile&secure%5Btoken%5D=4cecfc716b2cfdc092477b5c1bff8265af7acba6ee506bd69b58fc89279313b4&secure%5Burl%5D=https%3A%2F%2Fwww.linkedin.com%2Fcompany%2F9396064%2F&secure%5Burl_type%5D=linkedin_company_website)  
17 employees on LinkedIn®

#### Who Uses This Product?

- **Who Uses This:** CEO, CTO
- **Top Industries:** Information Technology and Services, Computer Software
- **Company Size:** 71% Small, 19% Medium

#### What Do G2 Reviewers Say About UptimeRobot?

_AI-generated summary from verified user reviews_

##### Pros

- Users love the **immediate notifications** from UptimeRobot, enabling proactive issue management and enhancing overall customer service.
- Users find the **easy setup** process of UptimeRobot efficient, enabling quick monitoring without complexities.
- Users value the **quick monitoring and notifications** of UptimeRobot, ensuring they stay informed about website status changes.
- Users find UptimeRobot's interface **easy to use** , enabling quick setup and efficient monitoring with timely notifications.
- Users praise UptimeRobot for its **reliability** , ensuring applications stay online and issues are promptly addressed.

##### Cons

- Users are frustrated by **inadequate notifications** , receiving multiple emails and experiencing missed alerts during downtime.
- Users find the **free plan limitations** of UptimeRobot restrictive, lacking features like shorter monitoring intervals and more detailed data.
- Users find the pricing **expensive** and the lack of customizable alerts frustrating, especially for external notifications.
- Users find the **poor UI** of UptimeRobot frustrating, leading to confusion and hindering overall user experience.
- Users find UptimeRobot's **limited monitoring capabilities** inadequate for internal parameters and complex needs.

#### What Are Recent G2 Reviews of UptimeRobot?

**["Simple, Reliable Uptime Monitoring That Just Works"](https://www.g2.com/survey_responses/uptimerobot-review-12671436)**

**Rating:** 4.0/5.0 stars

_— Javier C._

[Read full review](https://www.g2.com/survey_responses/uptimerobot-review-12671436)

**["Catches outages before my clients do"](https://www.g2.com/survey_responses/uptimerobot-review-13182659)**

**Rating:** 5.0/5.0 stars

_— Verified User in Information Technology and Services_

[Read full review](https://www.g2.com/survey_responses/uptimerobot-review-13182659)

#### What Are G2 Users Discussing About UptimeRobot?

- [What are the benefits and drawbacks of using UptimeRobot for website uptime monitoring?](https://www.g2.com/discussions/what-are-the-benefits-and-drawbacks-of-using-uptimerobot-for-website-uptime-monitoring) - 1 comment
- [Where is UptimeRobot located?](https://www.g2.com/discussions/where-is-uptimerobot-located) - 1 comment
- [Is UptimeRobot down?](https://www.g2.com/discussions/is-uptimerobot-down)
- [How do I cancel UptimeRobot?](https://www.g2.com/discussions/how-do-i-cancel-uptimerobot) - 1 upvote
- [How do I use UptimeRobot?](https://www.g2.com/discussions/how-do-i-use-uptimerobot)

### [Pandora FMS](https://www.g2.com/products/pandora-fms/reviews)

Pandora FMS is a unified monitoring and observability platform designed to consolidate visibility, alerting, reporting, and automation across heterogeneous IT environments. Instead of combining multiple point tools for networks, servers, applications, and cloud services, Pandora FMS centralizes data collection and operational workflows in a single console, reducing integration effort and operational complexity in on-premise, hybrid, and multi-cloud architectures. The platform collects telemetry using multiple methods, including agents, remote checks, standard protocols (e.g., SNMP/WMI), APIs, and log/event ingestion. This enables teams to monitor infrastructure and services end-to-end, correlate signals, and maintain consistent alerting policies and dashboards across distributed estates. Pandora FMS also supports capacity and trend analysis to anticipate resource constraints and identify recurring patterns, and includes AI-assisted capabilities for anomaly detection and automated thresholds to surface hard-to-spot operational signals. Pandora FMS is extensible through a large plugin ecosystem (500+ plugins and integrations), covering a wide range of enterprise and infrastructure technologies such as SAP, Oracle, Citrix, JBoss, VMware, AWS, SQL Server, Red Hat, and WebSphere. This extensibility helps organizations standardize monitoring across legacy and modern stacks without redesigning their monitoring approach per technology. Core capabilities: -Unified monitoring for networks, servers, applications, cloud services, endpoints, and logs -Centralized alerting, event correlation, dashboards, and scheduled reporting -Flexible data collection via agents, remote checks, APIs, and plugins -Scalability for distributed environments and large numbers of monitored elements -Analytics for trend/capacity planning plus AI-assisted anomaly detection and dynamic thresholds -A key differentiator is direct vendor support, which simplifies escalation and ensures continuity of expertise for deployment, tuning, and ongoing operations.

**Average Rating:** 4.6/5.0

**Total Reviews:** 212

#### How Do G2 Users Rate Pandora FMS?

- **Has the product been a good partner in doing business?:** 9.0/10 (Category avg: 8.8/10)
- **Dashboards and Visualization:** 8.9/10 (Category avg: 8.7/10)
- **Observability:** 9.2/10 (Category avg: 9.0/10)
- **Single Pane of Glass:** 9.0/10 (Category avg: 8.8/10)

#### Who Is the Company Behind Pandora FMS?

- **Seller:** [Pandora FMS](https://www.g2.com/sellers/pandora-fms)
- **Company Website:** pandorafms.com
- **Year Founded:** 2004
- **HQ Location:** Madrid, Spain
- **Twitter:** @pandorafms  
5,458 Twitter followers
- **LinkedIn® Page:** [www.linkedin.com](https://www.g2.com/external_clickthroughs/record?secure%5Bsource_type%5D=product_profile&secure%5Btoken%5D=61d7801b672bcc3a5cfb4d3ed56b7b1a3a133a8d7502bbad6f151e6ab0c02fdd&secure%5Burl%5D=https%3A%2F%2Fwww.linkedin.com%2Fcompany%2Fpandora-pfms%2F&secure%5Burl_type%5D=linkedin_company_website)  
56 employees on LinkedIn®

#### Who Uses This Product?

- **Who Uses This:** Data Analyst
- **Top Industries:** Information Technology and Services, Telecommunications
- **Company Size:** 50% Medium, 37% Small

#### What Do G2 Reviewers Say About Pandora FMS?

_AI-generated summary from verified user reviews_

##### Pros

- Users value the **reliable remote monitoring** of Pandora FMS, appreciating its seamless integration and ease of access.
- Users appreciate the **ease of use** of Pandora FMS, making server monitoring and management seamless and efficient.
- Users value the **real-time monitoring** capabilities of Pandora FMS, enhancing visibility and quick response across IT systems.
- Users value the **flexibility** of Pandora FMS, easily adapting monitoring to diverse systems and specific needs.
- Users value the **real-time network monitoring** of Pandora FMS, which provides instant alerts for any issues.

##### Cons

- Users find the **learning curve steep** , especially for beginners navigating complex scripts and configurations.
- Users find the **complex setup** of Pandora FMS to be challenging, impacting initial experiences and usability.
- Users find the **learning curve steep** with Pandora FMS, particularly when customizing and integrating specific functionalities.
- Users struggle with the **complex configuration** of Pandora FMS, finding the setup process time-consuming and challenging to navigate.
- Users find the **difficult learning curve** of Pandora FMS challenging, affecting their overall experience with the software.

#### What Are Recent G2 Reviews of Pandora FMS?

**["Fast Deployment, Easy to Use, and Strong Performance Even in the Community Version"](https://www.g2.com/survey_responses/pandora-fms-review-12677659)**

**Rating:** 5.0/5.0 stars

_— David D._

[Read full review](https://www.g2.com/survey_responses/pandora-fms-review-12677659)

**["Why we decided to bet on PandoraFMS"](https://www.g2.com/survey_responses/pandora-fms-review-7666873)**

**Rating:** 4.5/5.0 stars

_— Verified User in Commercial Real Estate_

[Read full review](https://www.g2.com/survey_responses/pandora-fms-review-7666873)

#### What Are G2 Users Discussing About Pandora FMS?

- [What are the benefits and drawbacks of using Pandora FMS for IT monitoring?](https://www.g2.com/discussions/what-are-the-benefits-and-drawbacks-of-using-pandora-fms-for-it-monitoring)

### [Centreon Infra Monitoring](https://www.g2.com/products/centreon-infra-monitoring/reviews)

Centreon is a comprehensive IT monitoring solution designed to help organizations gain full visibility and control over their IT operations. By providing real-time insights into system performance, network health, and application availability, Centreon enables businesses to proactively manage their IT environments, ensuring uninterrupted operations and optimal resource utilization. Targeted primarily at IT departments and operations teams, Centreon serves a diverse range of industries, from small businesses to large enterprises. Its user-friendly interface and customizable dashboards make it accessible for both technical and non-technical users. This versatility allows organizations to tailor the monitoring experience to their specific needs, making it an invaluable tool for maintaining operational efficiency and enhancing service delivery. One of the key use cases for Centreon is its ability to prevent downtime through proactive issue detection. By continuously monitoring critical systems and applications, Centreon alerts IT teams to potential problems before they escalate into significant outages. This proactive approach minimizes disruptions and helps organizations maintain a reliable IT infrastructure, which is essential for meeting business demands and ensuring customer satisfaction. Centreon also emphasizes resource optimization, allowing businesses to maximize efficiency and reduce IT costs. By providing detailed insights into resource utilization, organizations can identify underperforming assets and make informed decisions about capacity planning and resource allocation. This capability enables businesses to streamline their IT operations, ultimately leading to cost savings and improved performance. In addition, Centreon enhances the user experience by delivering consistent, high-quality IT services. With its comprehensive monitoring capabilities, IT teams can ensure that applications and services are running smoothly, providing end-users with the reliable performance they expect. This focus on user experience fosters customer loyalty and supports overall business success by aligning IT services with organizational goals. Centreon distinguishes itself in the IT monitoring category by combining powerful monitoring features with a user-centric approach. Its ability to deliver actionable insights, prevent downtime, optimize resources, and enhance user experience makes it a vital tool for organizations looking to improve their IT operations and achieve business success.

**Average Rating:** 4.6/5.0

**Total Reviews:** 89

#### How Do G2 Users Rate Centreon Infra Monitoring?

- **Has the product been a good partner in doing business?:** 8.1/10 (Category avg: 8.8/10)
- **Dashboards and Visualization:** 7.5/10 (Category avg: 8.7/10)
- **Observability:** 7.7/10 (Category avg: 9.0/10)
- **Single Pane of Glass:** 7.7/10 (Category avg: 8.8/10)

#### Who Is the Company Behind Centreon Infra Monitoring?

- **Seller:** [Centreon](https://www.g2.com/sellers/centreon)
- **Company Website:** www.centreon.com
- **Year Founded:** 2005
- **HQ Location:** Paris, France
- **Twitter:** @Centreon  
697 Twitter followers
- **LinkedIn® Page:** [www.linkedin.com](https://www.g2.com/external_clickthroughs/record?secure%5Bsource_type%5D=product_profile&secure%5Btoken%5D=0568a477c2ac032ab8b4670b41f6a7e7a56f16c51a561dc04943e67a9912d266&secure%5Burl%5D=https%3A%2F%2Fwww.linkedin.com%2Fcompany%2F830051%2F&secure%5Burl_type%5D=linkedin_company_website)  
155 employees on LinkedIn®

#### Who Uses This Product?

- **Who Uses This:** Network Engineer
- **Top Industries:** Information Technology and Services, Internet
- **Company Size:** 63% Medium, 25% Large

#### What Do G2 Reviewers Say About Centreon Infra Monitoring?

_AI-generated summary from verified user reviews_

##### Pros

- Users appreciate the **ease of use** of Centreon Infra Monitoring, enabling organized and efficient infrastructure management.
- Users appreciate the **ease of centralized monitoring** with Centreon, enjoying an intuitive interface and clear visualizations.
- Users value the **centralized monitoring capabilities** of Centreon, appreciating the clear visualization and ease of use.
- Users value the **real-time monitoring capabilities** of Centreon Infra Monitoring, enhancing control over their infrastructure.
- Users value the **easy integrations** of Centreon Infra Monitoring, enabling seamless setups and comprehensive support for various devices.

##### Cons

- Users find the **complex configuration** challenging, particularly during setup and integration with other tools like Jira.
- Users find the **interface not user-friendly** , particularly during setup and upgrades, which can be quite challenging.
- Users find the **complex setup** of Centreon Infra Monitoring to be challenging, especially for newcomers.
- Users find **difficult learning** curves in Centreon Infra Monitoring due to complex setup and inadequate documentation.
- Users find the **learning curve steep** for Centreon, as setup and documentation can be challenging for newcomers.

#### What Are Recent G2 Reviews of Centreon Infra Monitoring?

**["Centreon: Save time and achieve efficient monitoring with advanced features"](https://www.g2.com/survey_responses/centreon-infra-monitoring-review-12113590)**

**Rating:** 4.5/5.0 stars

_— Jean-Philippe C._

[Read full review](https://www.g2.com/survey_responses/centreon-infra-monitoring-review-12113590)

**["Clear interface, advanced reporting, and responsive support to oversee the entire infrastructure"](https://www.g2.com/survey_responses/centreon-infra-monitoring-review-12119400)**

**Rating:** 5.0/5.0 stars

_— Verified User in Government Administration_

[Read full review](https://www.g2.com/survey_responses/centreon-infra-monitoring-review-12119400)

#### What Are G2 Users Discussing About Centreon Infra Monitoring?

- [What is centreon Nagios?](https://www.g2.com/discussions/what-is-centreon-nagios)
- [How does Centreon work?](https://www.g2.com/discussions/how-does-centreon-work)
- [What is centreon product?](https://www.g2.com/discussions/what-is-centreon-product)
- [What is centreon used for?](https://www.g2.com/discussions/what-is-centreon-used-for)

### [ManageEngine Applications Manager](https://www.g2.com/products/manageengine-applications-manager/reviews)

ManageEngine Applications Manager is an application performance & IT infrastructure monitoring solution that is designed to combat modern infrastructure problems and ensure that your business and end users are unaffected by substandard performance and downtime. By leveraging deep application performance monitoring with byte-code instrumentation, infrastructure monitoring, hybrid cloud monitoring, and digital experience monitoring from a single console, IT and DevOps teams will be able to gain code-level insights, automate their processes, pinpoint & resolve performance issues, and deliver better business outcomes. Overall, our product will help businesses optimize application usage & revenue, reduce MTTR, improve DevOps processes, migrate to the cloud with confidence, respond to incidents faster, and ensure seamless user experiences.

**Average Rating:** 4.7/5.0

**Total Reviews:** 111

#### How Do G2 Users Rate ManageEngine Applications Manager?

- **Has the product been a good partner in doing business?:** 9.3/10 (Category avg: 8.8/10)
- **Dashboards and Visualization:** 8.6/10 (Category avg: 8.7/10)
- **Observability:** 8.0/10 (Category avg: 9.0/10)
- **Single Pane of Glass:** 7.7/10 (Category avg: 8.8/10)

#### Who Is the Company Behind ManageEngine Applications Manager?

- **Seller:** [Zoho](https://www.g2.com/sellers/zoho-b00ca9d5-bca8-41b5-a8ad-275480841704)
- **Year Founded:** 1996
- **HQ Location:** Austin, TX
- **Twitter:** @Zoho  
137,880 Twitter followers
- **LinkedIn® Page:** [www.linkedin.com](https://www.g2.com/external_clickthroughs/record?secure%5Bsource_type%5D=product_profile&secure%5Btoken%5D=9c8e45ddb296c32c6c5597ef9ba945c94562c57624f7bd1dcf1a9e9931f71578&secure%5Burl%5D=https%3A%2F%2Fwww.linkedin.com%2Fcompany%2F38373%2F&secure%5Burl_type%5D=linkedin_company_website)  
30,766 employees on LinkedIn®
- **Phone:** +1 (888) 900-9646 

#### Who Uses This Product?

- **Top Industries:** Information Technology and Services, Computer Software
- **Company Size:** 46% Medium, 42% Large

#### What Do G2 Reviewers Say About ManageEngine Applications Manager?

_AI-generated summary from verified user reviews_

##### Pros

- Users appreciate the **comprehensive end-to-end monitoring** offered by ManageEngine Applications Manager, enhancing performance management and operational efficiency.
- Users value the **monitoring capabilities** of ManageEngine Applications Manager, enabling proactive responses to system issues before client impact.
- Users value the **comprehensive monitoring capabilities** of ManageEngine Applications Manager, ensuring quick issue resolution and enhanced performance.
- Users appreciate the **real-time monitoring** of ManageEngine Applications Manager, facilitating prompt detection and resolution of performance issues.
- Users value the **real-time visibility** in ManageEngine Applications Manager, enabling proactive issue resolution and performance monitoring.

##### Cons

- Users note **limited features** , particularly in integration and scalability, which hampers effectiveness in larger environments.
- Users note **integration limitations** and scalability issues, impacting usability in large enterprise environments.
- Users face **integration issues** with ManageEngine Applications Manager, complicating setups and limiting compatibility with modern tools.
- Users face a **steep learning curve** during initial setup, complicating the configuration of monitoring parameters in larger environments.
- Users find the **initial setup complexity** to be time-consuming and challenging, especially in larger environments.

#### What Are Recent G2 Reviews of ManageEngine Applications Manager?

**["Reliable Tool for Application Performance Monitoring for ManageEngine Applications Manager."](https://www.g2.com/survey_responses/manageengine-applications-manager-review-12516609)**

**Rating:** 5.0/5.0 stars

_— Ankur P._

[Read full review](https://www.g2.com/survey_responses/manageengine-applications-manager-review-12516609)

**["Comprehensive Tool for Application Performance Management"](https://www.g2.com/survey_responses/manageengine-applications-manager-review-12533668)**

**Rating:** 5.0/5.0 stars

_— Rashmita T._

[Read full review](https://www.g2.com/survey_responses/manageengine-applications-manager-review-12533668)

#### What Are G2 Users Discussing About ManageEngine Applications Manager?

- [Which of the following statistics do APM provide?](https://www.g2.com/discussions/which-of-the-following-statistics-do-apm-provide) - 1 comment
- [What is APM tool?](https://www.g2.com/discussions/what-is-apm-tool) - 1 comment
- [What is the use of ManageEngine?](https://www.g2.com/discussions/what-is-the-use-of-manageengine) - 1 comment
- [What is ManageEngine Applications Manager?](https://www.g2.com/discussions/what-is-manageengine-applications-manager) - 1 comment

### [Honeycomb](https://www.g2.com/products/honeycomb/reviews)

Honeycomb is the observability platform that enables engineering teams to find and solve problems they couldn't before. Honeycomb’s approach is fundamentally different from other tools that claim observability, and is built to help teams answer novel questions about their ever-evolving cloud applications. Honeycomb is a modern observability platform built to help engineering teams quickly find and fix issues, including the ones they didn’t know to look for. Teams use Honeycomb to understand how their systems behave in production, get full context around every request, and resolve problems before customers notice. Where traditional tools separate logs, metrics, and traces, Honeycomb combines all telemetry into a single, unified event model. This enables fast, interactive querying across high-cardinality and high-dimensional data, so engineers can ask new questions without hitting limits or waiting minutes for results. Powered by a trace-first data store and designed for real-time exploration, Honeycomb makes it easy to pinpoint what’s broken, why it’s happening, and who is affected. It’s observability designed for modern, complex systems—simple to adopt, fast to query, and built to scale.

**Average Rating:** 4.5/5.0

**Total Reviews:** 37

#### How Do G2 Users Rate Honeycomb?

- **Has the product been a good partner in doing business?:** 9.3/10 (Category avg: 8.8/10)
- **Dashboards and Visualization:** 6.7/10 (Category avg: 8.7/10)
- **Observability:** 9.2/10 (Category avg: 9.0/10)
- **Single Pane of Glass:** 7.5/10 (Category avg: 8.8/10)

#### Who Is the Company Behind Honeycomb?

- **Seller:** [Honeycomb.io](https://www.g2.com/sellers/honeycomb-io)
- **Company Website:** www.honeycomb.io
- **Year Founded:** 2016
- **HQ Location:** San Francisco, US
- **Twitter:** @honeycombio  
14,830 Twitter followers
- **LinkedIn® Page:** [www.linkedin.com](https://www.g2.com/external_clickthroughs/record?secure%5Bsource_type%5D=product_profile&secure%5Btoken%5D=c8e6eaf5e555c759aa617c939e43add163610bb668e32dbf9833c25a19acabe6&secure%5Burl%5D=https%3A%2F%2Fwww.linkedin.com%2Fcompany%2Fhoneycomb.io&secure%5Burl_type%5D=linkedin_company_website)  
296 employees on LinkedIn®

#### Who Uses This Product?

- **Top Industries:** Information Technology and Services, Computer Software
- **Company Size:** 47% Medium, 39% Large

#### What Do G2 Reviewers Say About Honeycomb?

_AI-generated summary from verified user reviews_

##### Pros

- Users find Honeycomb to be **intuitive and easy to use** , significantly improving their system monitoring and issue resolution.
- Users value the **efficient and deep data analysis** capabilities of Honeycomb, transforming their understanding of production systems.
- Users value the **intuitive data visualization** of Honeycomb, enhancing efficiency in analyzing system performance and issues.
- Users value Honeycomb for its **real-time monitoring** , enhancing system health awareness and facilitating rapid issue resolution.
- Users value the **intuitive data visualization and tracing features** of Honeycomb, enhancing system monitoring and incident handling.

##### Cons

- Users note that the **difficult learning curve** with Honeycomb hinders quick understanding and exploration of its features.
- Users find the **learning curve steep** due to complex documentation and limited information for new users.
- Users find the **learning difficulty** high due to poor documentation and the need for self-learning and external tools.
- Users wish for more **feature flexibility** in Honeycomb, particularly regarding quota management and data aggregation options.
- Users find Honeycomb's **limited reporting capabilities** restrictive, as it requires additional tools for effective analytics.

#### What Are Recent G2 Reviews of Honeycomb?

**["Fast, Flexible Querying That Speeds Up Debugging"](https://www.g2.com/survey_responses/honeycomb-review-13166990)**

**Rating:** 4.5/5.0 stars

_— Vishnu Vardhan N._

[Read full review](https://www.g2.com/survey_responses/honeycomb-review-13166990)

**["Honeycomb Makes Observability Easy with Powerful Analytics and Clear Visualizations"](https://www.g2.com/survey_responses/honeycomb-review-13202014)**

**Rating:** 5.0/5.0 stars

_— Venkata Adithya K._

[Read full review](https://www.g2.com/survey_responses/honeycomb-review-13202014)

### [OpenText Operations Bridge (OpsBridge)](https://www.g2.com/products/opentext-operations-bridge-opsbridge/reviews)

Micro Focus is now part of OpenText! OpenText™ Operations Bridge (OpsBridge) automatically monitors and analyzes the health and performance of Hybrid IT resources across any device, operating system, database, application, or service on all data types. With industry-leading AIOps capabilities, including event consolidation engines and noise reduction technology, it uniquely integrates end-to-end service awareness with rule and machine learning-based event correlation capabilities. Problems identified using a Vertica big data lake and machine learning, for example, to identify significant logs, can be manually or automatically remediated with flexible runbook automation and orchestration. These capabilities also apply to over 200 integrations with third-party tools and technology stacks. Executive stakeholders gain actionable insight on any device that has a browser with tailored dashboards showing vital status, business, and IT KPIs. Hybrid Cloud Monitoring for the Digital Enterprise Hybrid IT has quickly become the new normal, and IT operations teams are expected to offer both cloud and on-premises infrastructure options, whichever best meets the needs of the application or service. IT operations teams must adapt to new technologies, adopt new cloud vendors and other services chosen by the business, and monitor new applications and application releases with increasing frequency. OpenText™ OpsBridge exploits all AIOps capabilities to consolidate and analyze all your data. It reduces event volumes, isolates root-cause, and provides chatbots for ChatOps. It includes automation to remediate problems quickly while reducing human error with over 8000 provided runbook – or you can build your own. Deliver What the Business Needs When It Needs It Designed to deliver real business value, OpenText™ OpsBridge integrates all your tools and automates manual tasks. It focuses operations teams on the business services and users being impacted by automatically identifying root cause faster than ever before possible. Built-in AIOps intelligent analytics drives historical analysis, applying machine learning and 50+ patented algorithms to logs, events, metrics, and topology, which is so much more powerful than search alone. Key Benefits - Increased effectiveness (time, money, resources) of tools and services - Reduced effort and time to process service requests and resolve problems - Confidence from the lines of business in IT’s ability to deliver consistent, compliant services - Business needs and strategy that are on time and budget, and in stronger collaboration with IT - Reduced business risk, better service price performance, and accelerated time-to-market for new services Key Features - Automated Hybrid IT Discovery and Monitoring: Discovery and monitoring consolidates and exploits all your data types (events, metrics, logs, and topology) within a dynamically updated and accurate model. It shows the impact of incidents, ensuring no new service goes overlooked with dynamic top-down and bottoms-up service modeling and with monitoring automation. Aggregate all our your Hybrid IT resources into a single view with 200+ technology integrations. OpsBridge solution templates and management packs provide in-depth domain-specific monitoring, including infrastructure, databases, Microsoft environments, SAP environments, middleware, cloud, big data, application platforms, automation, load balancers, and web servers. The data is integrated into collect once store one technology (COSO), a containerized common data collection and storage for real-time streaming data ingestion and processing. - Consolidate Data and Reduce Noise: IT experts advise that the application of common data ingestion and algorithmic Big Data driven analytics to all your data is the key to improving service excellence. OpsBridge includes analytics and incorporates 50+ patents for high-speed, high-volume data analysis. Automated log, metric, and event analysis, plus anomaly detection, proactively alerts operators to abnormal activity and uncovers the most relevant insights from hundreds of millions of records to help your team better prioritize. With “time machine” replay, which correlates disparate data over any time range and in relation to topology graphs, users can visualize with ease when the problem started and find the offending resource. To enhance your control of virtualized resources and dynamically changing workloads, OpsBridge proposes optimized recipes for your resources. These recipes give you the ability to visualize resources, forecast their allocation impact, and master costs to set the right level of service. - Automated AIOps: OpsBridge incorporates all 11 AIOps capabilities, from agent-based intelligence and real-time performance analytics to multi-mode stream-based and topology-based correlation of event streams over time and across dependencies. - Robotize Processes and Remediation: With more than 8,000 runbooks to choose from, including hundreds of out-of-the-box integrations to popular IT Service Management tools, OpsBridge simplifies and accelerates the automation of tasks such as remedial actions, notifications, and recovery procedures. Orchestration of complex and conditional execution and rollback provides the means to strengthen compliance, remove manual errors, and develop IT Process Automation (ITPA) to slash costs and drive compliance, releasing rare resources for more critical business priorities. Adapting to changing circumstances is a core requirement for an agile organization. That’s the DevOps methodology, and OpsBridge supports it with: \> A dynamically updating model that reflects the deployment of new application and infrastructure instances, automatically activating the required monitoring. \> Robotized features for ChatOps-based collaboration across teams and tools such as Sitescope, OpsBridge Reporter and Operations Orchestration \> Automated tasks capture and share vital production information to the extended teams, as well as activating alternative configurations to keep your business on track. - Analyze Application Health: OpsBridge provides probes dispersed across the world to measure service quality, control SLAs, and application health. That data is also fed to COSO, processed by the AIOps based analytics, and shown in reports and dashboards. - Customize Dashboards and Reporting: The Business Value Dashboard (BVD) can exploit all the status and KPI data at your disposal to provide a TV-like, live channel of business and IT news that the BVD “paints” onto any device with a browser. BVD software can display online information—such as internet news feeds, live programs, and streaming videos—in views developed using popular office tools. BVD can consume historical data stored in COSO, preprocessing, and analyzing that data before being displayed for reporting. OpsBridge Performance Engine and BVD provide highly scalable, real-time performance collection, analysis, and graphing for hundreds of metrics and consume data from COSO. You can build and combine different metrics and IT status information into powerful dashboards you can quickly tailor into domain-specific or contextually-specific dashboard mashups. Supported Technologies Management Packs are domain-specific add-ons to OpsBridge that provide pre-programmed intelligence for that domain, domain-specific reports, and correlation rules. Full details are available here: https://www.microfocus.com/media/data-sheet/operations\_bridge\_ds.pdf - Infrastructure AIX CentOS Cluster Debian HPE-UX HyperV IBM LPAR KVM Oracle Enterprise Linux RedHat Solaris Solaris Zone SUSE Ubuntu VMware vSphere Windows XEN - Databases Cassandra Couchbase Apache CouchDB Informix Marklogic Microsoft SQL Server MongoDB MySQL Oracle Database Oracle RAC PostgreSQL Riak SAP Sybase ASE - Microsoft Environments Microsoft Active Directory Microsoft Azure Microsoft Exchange Server Microsoft IIS Microsoft SharePoint Server Microsoft Skype for Business - SAP Environments SAP SAP HANA - Middleware Apache ActiveMQ Apache Kafka Apache Tomcat Apache Web Server Glassfish IBM WebSphere Application Server iPlanet JBoss Memcached Oracle Weblogic Application Server Rabbit MQ Redis Varnish - Cloud Amazon Services (EC2, EBS, ECS, Dynamo DB, Beanstalk Services, AWS Service Status, RDS, ASG, ELB, SQS, RedShift, KMS, S3, AWS Billing, AWS Service Health Dashboards) Microsoft Azure (Azure Data Factory, Azure Data Lake, Virtual Machines, Azure SQL, Storage Account, Azure App Service Plan, Azure Web Apps, Azure Active Directory Discovery, Activity Logs, Windows Activity Logs hosted on the Azure environment, Azure Load Balancer, Multi-instance support for Storage account service) Google Cloud Platform OpenStack Kubernetes - Big Data Apache Falcon Apache Flume Apache Oozie Apache Spark Apache Storm Apache Zookeeper Hadoop (Apache, Cloudera distributions) HBase Micro Focus Vertica Database Solr - Application Platforms Docker (certified) Node.js - Automation Chef Jenkins - Generic BIND DHCP File Change Monitor FTP server Generic SMTP JMX Microsoft .NET OpenSSH Perfmon SNMP - Load Balancer HAProxy Nginx - Partner IBM AS/400 IBM DB2 IBM Mainframe - Web Server gUnicorn HTTP Lighttpd - Others Github Postfix - Integrations are connectors to other tools that bring in their data for display and analysis: Ambari AppDynamics Aternity BMC Impact Manager BMC Remedy CA Spectrum Cherwell ITSM CollectD DynaTrace APM (Compuware) Dynatrace Data Center RUM (Do IT WiSE) Dynatrace Data Center RUM (J9) Dynatrace Synthetics (Do IT Wise) ExtraHop Networks Helion Monasca HEP OneView HPE Systems Insight Manager IBM NetCool IBM Tivoli (J9) OpenText™ APM OpenText™ AppPulse Active / Mobile OpenText™ ArcSight Logger / ESM OpenText™ AppManager OpenText™ Network Node Manager i (NNMi) OpenText™ Operations Manager for UNIX OpenText™ Operations Manager for Windows OpenText™ Service Manager OpenText™ Universal CMDB Microsoft SCOM Nagios New Relic Nutanix Oracle Enterprise Manager Propel Service Exchange RemedyForce / Salesforce SAP Solution Manager Service Anywhere ServiceNow (AppLink) ServiceNow (Do IT WiSE) Solarwinds Network Performance Monitor Solarwinds Server and Application Monitor Splunk VMWare vCenter Operations Manager VMware vRealize Operations (VROPS) xMatters Zabbix Zenoss

**Average Rating:** 4.0/5.0

**Total Reviews:** 16

#### How Do G2 Users Rate OpenText Operations Bridge (OpsBridge)?
- **Has the product been a good partner in doing business?:** 8.0/10 (Category avg: 8.8/10)
- **Dashboards and Visualization:** 10.0/10 (Category avg: 8.7/10)
- **Observability:** 10.0/10 (Category avg: 9.0/10)
- **Single Pane of Glass:** 10.0/10 (Category avg: 8.8/10)

#### Who Is the Company Behind OpenText Operations Bridge (OpsBridge)?

- **Seller:** [OpenText](https://www.g2.com/sellers/opentext)
- **Year Founded:** 1991
- **HQ Location:** Waterloo, ON
- **Twitter:** @OpenText  
21,565 Twitter followers
- **LinkedIn® Page:** [www.linkedin.com](https://www.g2.com/external_clickthroughs/record?secure%5Bsource_type%5D=product_profile&secure%5Btoken%5D=6c339a6555764b5ffce77c3df08d6ed9c9b1cb1ee1baeebac8435f0485b7cca5&secure%5Burl%5D=https%3A%2F%2Fwww.linkedin.com%2Fcompany%2F2709%2F&secure%5Burl_type%5D=linkedin_company_website)  
23,048 employees on LinkedIn®
- **Ownership:** NASDAQ:OTEX

#### Who Uses This Product?

- **Top Industries:** Information Technology and Services, Retail
- **Company Size:** 106% Large, 3% Medium

#### What Do G2 Reviewers Say About OpenText Operations Bridge (OpsBridge)?

_AI-generated summary from verified user reviews_

##### Pros

- Users appreciate the **powerful infrastructure monitoring** capabilities of OpenText OpsBridge, enhancing their operational efficiency.
- Users commend the **powerful infrastructure monitoring** capabilities of OpenText OpsBridge, enhancing their operational efficiency.
- Users appreciate the **monitoring ease** of OpenText OpsBridge, making infrastructure management straightforward and efficient.
- Users appreciate the **powerful infrastructure monitoring** capabilities of OpenText OpsBridge, enhancing their operational efficiency significantly.

##### Cons

- Users report significant **delay issues** with support, as tickets often remain unresolved for extended periods.
- Users experience significant **delays** with the support team, with unresolved tickets and unnecessary requests prolonging issues.
- Users face challenges with the **logging issues** as the support team often asks for irrelevant logs, delaying resolutions.
- Users are frustrated with the **poor support team** , as many tickets remain unresolved for extended periods.
- Users express frustration over **poor customer support** , as unresolved tickets lead to wasted time and ineffective assistance.

#### What Are Recent G2 Reviews of OpenText Operations Bridge (OpsBridge)?

**["Micro focus - operation manager"](https://www.g2.com/survey_responses/opentext-operations-bridge-opsbridge-review-6536212)**

**Rating:** 5.0/5.0 stars

_— Verified User in Information Technology and Services_

[Read full review](https://www.g2.com/survey_responses/opentext-operations-bridge-opsbridge-review-6536212)

**["Streamlining IT Operations with Micro Focus Operations Bridge (OpsBridge)"](https://www.g2.com/survey_responses/opentext-operations-bridge-opsbridge-review-7960528)**

**Rating:** 5.0/5.0 stars

_— Shubham D._

[Read full review](https://www.g2.com/survey_responses/opentext-operations-bridge-opsbridge-review-7960528)

#### What Are G2 Users Discussing About OpenText Operations Bridge (OpsBridge)?

- [What is Micro Focus Operations Bridge (OpsBridge) used for?](https://www.g2.com/discussions/what-is-micro-focus-operations-bridge-opsbridge-used-for)

### [Netreo](https://www.g2.com/products/netreo/reviews)

Netreo is the most comprehensive IT Operations full stack monitoring and AIOps company. We provide a single source of truth for proactive performance and availability monitoring for large enterprise networks, infrastructure, applications and business services. Our solution is used by: - IT Executives to have full visibility from the business service right down into the infrastructure and network that supports it. - IT Engineering departments as a decision support system for capacity planning, and architecting modern solutions. - IT Operations teams for real time visibility into what is failing in their environment, what bottlenecks exist and who it is affecting. We provide all of these insights for systems and vendor mixes in large heterogeneous and constantly evolving environments. We have an extensive and growing list of supported vendors (over 350 integrations) including network vendors, servers, storage, virtualization, cloud platforms and others. Our platform is also an extensible environment with the ability for our user community to build and share their integrations with others in our customer community.

**Average Rating:** 4.5/5.0

**Total Reviews:** 54

#### How Do G2 Users Rate Netreo?

- **Has the product been a good partner in doing business?:** 9.2/10 (Category avg: 8.8/10)
- **Dashboards and Visualization:** 8.6/10 (Category avg: 8.7/10)
- **Observability:** 8.9/10 (Category avg: 9.0/10)
- **Single Pane of Glass:** 9.1/10 (Category avg: 8.8/10)

#### Who Is the Company Behind Netreo?

- **Seller:** [BMC Helix](https://www.g2.com/sellers/bmc-helix)
- **Year Founded:** 2025
- **HQ Location:** N/A
- **LinkedIn® Page:** [www.linkedin.com](https://www.g2.com/external_clickthroughs/record?secure%5Bsource_type%5D=product_profile&secure%5Btoken%5D=63b4dbbe36c184b8e0bcfe321196485a32ca82b8a8050b7bdd9dc630481c3b87&secure%5Burl%5D=https%3A%2F%2Fwww.linkedin.com%2Fcompany%2Fbmchelix%2F&secure%5Burl_type%5D=linkedin_company_website)  
1,266 employees on LinkedIn®

#### Who Uses This Product?

- **Top Industries:** Information Technology and Services, Primary/Secondary Education
- **Company Size:** 37% Medium, 34% Large

#### What Are Recent G2 Reviews of Netreo?

**[""Netreo: The Best Vendor for Full-Stack Monitoring and AIOps Solutions""](https://www.g2.com/survey_responses/netreo-review-7793121)**

**Rating:** 5.0/5.0 stars

_— Victor A._

[Read full review](https://www.g2.com/survey_responses/netreo-review-7793121)

**["Netreo Amazing IT Observability and Operations experience"](https://www.g2.com/survey_responses/netreo-review-8778727)**

**Rating:** 5.0/5.0 stars

_— Rodrigo V._

[Read full review](https://www.g2.com/survey_responses/netreo-review-8778727)

#### What Are G2 Users Discussing About Netreo?

- [What is Netreo used for?](https://www.g2.com/discussions/what-is-netreo-used-for) - 1 comment

- [&lsaquo; Prev‹ Prev](/categories/enterprise-monitoring/enterprise?order=g2_score#product-list)
- [1](/categories/enterprise-monitoring/enterprise?order=g2_score#product-list)
- 2
- Next &rsaquo;Next ›

Spotlight Categories

[Purchasing Software](https://www.g2.com/categories/purchasing-software)

[Accounts Receivable Software](https://www.g2.com/categories/accounts-receivable)

[Customer Service Automation Software](https://www.g2.com/categories/customer-service-automation)

[Video Conferencing Software](https://www.g2.com/categories/video-conferencing)

[Social Media Management Tools](https://www.g2.com/categories/social-media-mgmt)

Similar Categories

- [AI Agent Observability](/categories/ai-agent-observability)
- [Application Performance Monitoring (APM)](/categories/application-performance-monitoring-apm)
- [Cloud Infrastructure Monitoring](/categories/cloud-infrastructure-monitoring)
- [Database Monitoring](/categories/database-monitoring)

- [Hardware Monitoring](/categories/hardware-monitoring)
- [Log Monitoring](/categories/log-monitoring)
- [Network Monitoring](/categories/network-monitoring)
- [Observability Pipeline](/categories/observability-pipeline)

- [Observability Software](/categories/observability-software)
- [Other Monitoring](/categories/other-monitoring)
- [Website Monitoring](/categories/website-monitoring)

[Browse Enterprise Monitoring Themes](/categories/enterprise-monitoring/themes)