PayHelm
Who Is the Company Behind PayHelm?
- Seller: PayHelm
- HQ Location: N/A
-
LinkedIn® Page: www.linkedin.com
1 employees on LinkedIn®
Total Products under this Category: 344
Last updated: September 01, 2026
Why You Can Trust G2's Software Rankings:
G2's software rankings are built on verified user reviews, rigorous moderation, and a consistent research methodology maintained by a team of analysts and data experts. Each product is measured using the same transparent criteria, with no paid placement or vendor influence. While reviews reflect real user experiences, which can be subjective, they offer valuable insight into how software performs in the hands of professionals. Together, these inputs power the G2 Score, a standardized way to compare tools within every category.
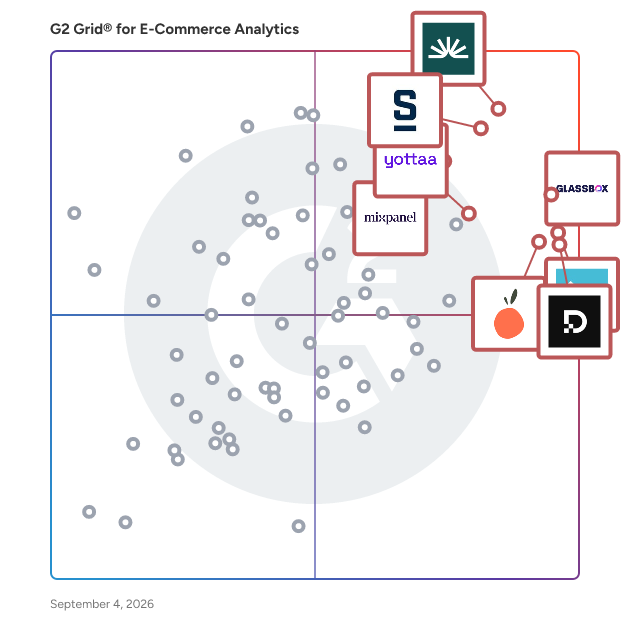
Highlighted products: Fullstory, Glassbox, Stackline, Luigi's Box, Decodo (formerly Smartproxy), Lucky Orange, Mixpanel, and Yottaa.
Underlying data: [Grid® JSON](https://www.g2.com/categories/e-commerce-analytics/grids.json?focus%5B%5D=fullstory&focus%5B%5D=glassbox&focus%5B%5D=stackline&focus%5B%5D=luigi-s-box&focus%5B%5D=decodo-formerly-smartproxy&focus%5B%5D=lucky-orange&focus%5B%5D=mixpanel&focus%5B%5D=yottaa&segment=all)
Pervasive Mind is "Revolutionizing Data for Brands." Our AI-driven solutions empower brands to quickly and easily gather insights, automate key decisions, and optimize daily operations. By leveraging our home-grown AI technology, brands can rely on market-leading speed and accuracy to confidently make critical business decisions that protect brand integrity, enhance their online presence, and consistently maintain a competitive edge. Come see how Pervasive Mind can help you maximize growth with the speed and precision needed in today's fast-paced market.
ProductDataCloud is a product intelligence platform for e-commerce. Connect any Shopify store by URL — ProductDataCloud automatically scans the entire product catalog, identifies every product, and enriches it with external market data. No manual data entry required. Individual products can also be looked up by GTIN, UPC, EAN, ISBN, or ASIN. The platform delivers three types of output: Product content. Titles, descriptions, specifications, images, product videos, and reviews — aggregated from hundreds of global retailers including Amazon, eBay, Otto, Target, Kroger, MediaMarkt, Macy's, Kmart, Globus, Rite Aid, and manufacturer websites. All data is matched, validated, and formatted for direct import. The data is Google UPC-ready, so AI shopping agents can read and verify product listings. Market intelligence. For every product: global price comparison across retailers, Amazon Best Seller Rank tracking, Google Trends demand signals, YouTube review analysis, and Reddit and social media mention tracking. Users see how a product is priced worldwide, whether demand is rising or falling, and what consumers are saying about it. Portfolio analytics. ProductDataCloud analyzes not just individual products but entire catalogs. Users identify pricing anomalies, trending products, underperforming SKUs, and competitive gaps across thousands of products at once. Portfolio-level dashboards aggregate social sentiment, price positioning, and demand trends across the full inventory. AI-powered enrichment. AI generates optimized product descriptions, identifies content gaps, and suggests actions based on market signals — automatically, at scale. Integration. REST API, Shopify plugin, and a web dashboard. Data can be pulled into existing systems or accessed directly through the platform.
ProfitPilot Insights & Reports is a Shopify analytics and profit reporting solution designed to help merchants understand their true business profitability beyond basic revenue and sales figures. The app brings revenue, expenses, margins, fees, shipping costs, taxes, and marketing spend together in one centralized platform. Merchants can monitor total revenue, sales, and net profit in real time, giving them a clearer view of how their store is performing. Instead of relying only on gross sales, businesses can account for the costs associated with selling products and operating their store to better understand their actual profitability. ProfitPilot Insights & Reports provides detailed product-level analysis, allowing merchants to identify products that generate strong profits as well as products that may be negatively affecting margins. This information can help businesses make better decisions about pricing, inventory, product selection, and marketing strategies. The app also enables merchants to analyze performance across different countries and sales channels. This makes it easier to understand which markets and channels are generating the strongest financial results and where improvements may be needed. Visual charts and forecasting tools help merchants monitor performance trends and understand how their store is progressing over time. By combining financial data with performance reporting, businesses can identify opportunities, detect potential losses, and make more informed decisions. Whether you're managing a growing Shopify store, multiple sales channels, or a large product catalog, ProfitPilot Insights & Reports provides a centralized view of revenue, costs, and profitability to help merchants improve margins, optimize performance, and make data-driven business decisions.
ProfitShield protects your Shopify margins in real time. Built on Shopify Functions — compiled Rust running at the edge — it calculates an order's true profitability during checkout, factoring in COGS, shipping, payment fees, and stacked discounts, and can block or flag orders that fall below your configured margin threshold before they're placed. Built by JMS Dev Lab, it also surfaces AI-powered margin insights so you can see which products and discounts are quietly losing money. Prevention, not just post-sale reporting: no other Shopify app validates order profitability at checkout. 14-day free trial; honest, transparent billing.
ProfitSpace automates the most crucial time consuming everyday calculations for eCommerce. Discover how your advertising efforts are actually impacting your business, know exactly when to order the next batch, and most important, reveal your true net profit in real time!
Qia is a utilitarian analytical workspace designed for Shopify merchants who require custom data engineering without maintaining manual spreadsheets, SQL databases, or complex BI dashboard configurations. Instead of generating fixed charts or pre-built visual dashboards, Qia utilizes a text-based input terminal. Users write precise operational or financial queries in plain English. The engine processes these requests by executing live Query Algebra directly against raw Shopify store data (including order volumes, UTM attribution strings, discount code logs, and inventory levels). Core Functionality - Direct Data Handshake: Connects directly to Shopify to query raw transactional data and attribution tables in real time, bypassing standard row limits and template restrictions. - Wide Intermediate Tables (WIT): Aggregates complex, multi-source data points into structured, clean tabular layouts where merchants can modify, filter, and structure columns at zero computational tier-cost. - Autonomous Strategy Synthesis: Converts extensive multi-column data tables into clear, written analytical narratives. It calculates real-world metrics like true contribution margins, cohort purchase latency, and inventory velocity decay trends. - Shop Personalization Engine: Allows merchants to inject real-world operational constraints directly into the analytical model (e.g., specifying custom 3PL manual restock labor rates, open-box asset depreciation percentages, or founder opportunity-cost values). By prioritizing plain-text queries and objective structural audits over visual clutter, Qia eliminates the manual labor of exporting multiple CSV files into custom spreadsheet pivot tables, delivering direct mathematical answers to complex retail questions.
Radix Haven offers a complete suite of forecasting, goal setting, and data labeling software.
ReportGuru is an advanced analytics and reporting platform built specifically for Shopify merchants and eCommerce businesses. It empowers store owners to understand their data, uncover trends, and make smarter decisions through AI-driven insights and automated reporting. Instead of relying on complicated spreadsheets or time-consuming manual analysis, ReportGuru transforms complex data into clear, actionable dashboards that anyone can understand. At its core, ReportGuru combines AI-powered analytics with automation to help merchants stay ahead of performance trends. It tracks everything — sales, revenue, inventory, customers, and marketing — all in one unified platform. With its intuitive interface, users can easily monitor store performance, identify growth opportunities, and optimize operations for better profitability. One of ReportGuru’s standout features is its AI Insights engine, which automatically highlights key changes and opportunities in your store’s performance. Whether it’s spotting products that are trending, identifying underperforming items, or analyzing customer behavior, ReportGuru delivers insights that drive growth. Its Cohort and Trend Analysis tools provide deeper visibility into customer retention, repeat purchases, and lifetime value, enabling merchants to build stronger, more loyal customer bases. The platform also supports Automated Reporting, allowing users to schedule recurring reports and receive them via email at regular intervals. This means merchants no longer need to manually generate reports — they get the data they need, when they need it. Additionally, Seamless Exports make it easy to download data in multiple formats like Excel or CSV, or integrate directly with business intelligence tools for deeper analysis. Beyond analytics, ReportGuru integrates smoothly with Shopify and other essential business apps, ensuring your data is always accurate and up to date. The interface is user-friendly, with clear visualizations and filters that make it simple to compare performance across products, regions, or time periods. In short, ReportGuru is designed to save time, simplify analysis, and support smarter business decisions. By automating data reporting and providing intelligent insights, it helps eCommerce businesses focus on what matters most — growth and customer satisfaction. Whether you’re managing one Shopify store or multiple brands, ReportGuru ensures you always have the right information to make confident, data-driven choices.
AI-generated summary from verified user reviews
RevHapi is an analytics platform that aligns ad performance data with verified sales data across channels. It connects Shopify stores and publisher sites ( Adsense and Admanager ) to major ad networks like Meta Ads, Google Ads, and TikTok Ads, syncing data automatically. The platform resolves discrepancies between reported ad spend returns and actual Shopify order data, auto updates without manual input. RevHapi provides detailed reports, including profit and loss statements that merge Shopify revenue with ad spend to calculate net profit. It tracks transactions with UTM-level attribution, showing campaign-driven sales and accounting for refunds. Customer lifetime value analysis identifies acquisition channels based on long-term value. Features include product analytics, a UTM builder, landing page creation, and A/B testing. It detects attribution overlap across ad networks, identifying when platforms claim credit for the same conversion. Data can be exported in CSV format.
Roasberry is the low-cost alternative for successful Shopify brands looking to reduce SaaS costs while keeping access to multi-touch attribution and essential marketing analytics. Roasberry allows merchants to compare campaign, ad set, and ad performance together with creatives, visitor analyses, and Assistantship—helping brands make smarter decisions and drive higher ROAS.
RoasLens is a Polish e-commerce profitability analytics tool. It connects Allegro, Meta Ads, Google Ads, BaseLinker, Google Analytics 4 and Fakturownia in one panel and shows real net profit in PLN — today, not at month-end — after product cost, marketplace commissions, shipping, ad spend and tax. Every ad and sales panel shows only its own slice, so the one number that matters — how much you actually keep — is hidden. RoasLens joins these sources and calculates net profit, ROAS and profit-on-ad-spend automatically and daily, plus plain recommendations (what to scale, trim or turn off), a bookkeeping/tax module (net income, PIT, foreign invoices at the Polish NBP rate, AI reading of PDF amounts) and a demand calendar. Built for Polish e-commerce sellers by a seller, not a software house — created by Sebastian Pietrzak (P.P.H.U. DEOZE) out of the need to know his own shop's real profit. Read-only access, encrypted API keys (AES-256-GCM), two-factor login, one-click disconnect.
