Best Database Monitoring Tools for Small Business - Page 2

How Many Database Monitoring Tools Products Does G2 Track?

Total Products under this Category: 153

Category Stats (Nov 2026)

  • Average Rating: 4.48/5 (↑0.01 vs Oct 2026) The average rating of products in this category, based on all submitted ratings
  • Top Trending Product: DataBuck (+12.18%) - Among all products in this category, DataBuck recorded the largest rating increase compared to last month

Last updated: November 01, 2026

How Does G2 Rank Database Monitoring Tools Products?

Why You Can Trust G2's Software Rankings:

  • 30 Analysts and Data Experts
  • 11,300+ Authentic Reviews
  • 153+ Products
  • Unbiased Rankings

G2's software rankings are built on verified user reviews, rigorous moderation, and a consistent research methodology maintained by a team of analysts and data experts. Each product is measured using the same transparent criteria, with no paid placement or vendor influence. While reviews reflect real user experiences, which can be subjective, they offer valuable insight into how software performs in the hands of professionals. Together, these inputs power the G2 Score, a standardized way to compare tools within every category.

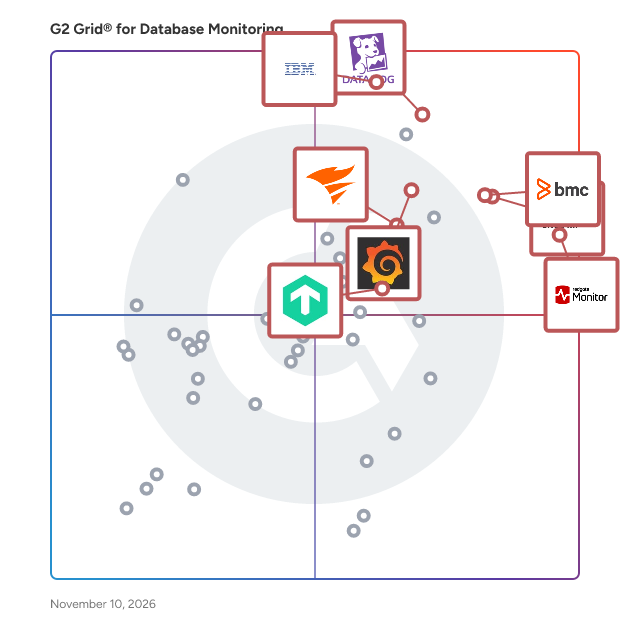
G2 Grid® for Database Monitoring Tools

G2 Grid® for Database Monitoring Tools plotting products by satisfaction and market presence

Highlighted products: Site24x7, Redgate Monitor, BMC AMI Data, Datadog, SolarWinds Database Observability, Checkmk, Grafana Labs, and IBM Instana.

Underlying data: [Grid® JSON](https://www.g2.com/categories/database-monitoring/grids.json?focus%5B%5D=site24x7&focus%5B%5D=redgate-monitor&focus%5B%5D=bmc-ami-data&focus%5B%5D=datadog&focus%5B%5D=database-observability&focus%5B%5D=checkmk&focus%5B%5D=grafana-labs&focus%5B%5D=ibm-instana&segment=small-business)

OpsPilot

OpsPilot is an AI-led observability platform that helps engineering and IT operations teams detect problems, investigate incidents and improve reliability — with less manual effort. Unlike traditional monitoring tools that leave engineers to interpret dashboards, correlate alerts and search through logs, OpsPilot brings observability and AI-assisted investigation together. Meet Coworker — Your 24/7 AI SRE Teammate At the heart of OpsPilot is Coworker, an AI-powered operations teammate that continuously investigates what's happening across your applications, infrastructure and services. Coworker analyses available metrics, logs and traces, investigates anomalies and operational alerts, and brings related findings together into clear, prioritised situations. Rather than presenting another stream of alerts, Coworker helps engineers understand what's happening, why it matters and what they should investigate or do next. From Monitoring to Actionable Intelligence OpsPilot combines three complementary capabilities: Observability: Collect, explore and correlate metrics, logs and traces from applications, servers, databases, containers and cloud infrastructure. Gain visibility across distributed systems through OpenTelemetry and supported integrations. AI-Assisted Investigation: Coworker continuously investigates operational signals, examines supporting evidence, identifies likely causes and groups related findings into meaningful situations. It keeps investigations updated as conditions change, helping teams focus on problems that genuinely need attention. Operational Guidance: Receive prioritised findings, explanations and recommended next steps. Reduce repetitive investigation work and help engineers move more quickly from identifying a problem to deciding how to resolve it. OpenTelemetry-Native and Built on Open Standards OpsPilot supports OpenTelemetry ingestion and integrates with Grafana, allowing teams to build on familiar observability technologies. It works with existing OpenTelemetry instrumentation, without requiring a proprietary OpsPilot agent. Supported environments include Kubernetes, containers, cloud infrastructure and distributed applications. For teams requiring deeper Java and Adobe ColdFusion application diagnostics, the optional FusionReactor APM agent provides additional visibility. Designed for Modern IT Operations OpsPilot is built for DevOps, SRE, platform engineering and IT operations teams responsible for keeping production systems reliable. Whether you're monitoring applications, investigating infrastructure issues or managing complex distributed environments, OpsPilot helps your team spend less time searching for answers and more time resolving problems. Beyond Observability Traditional observability tells you what your systems are doing. OpsPilot goes further by helping you understand what matters and what to do next. With Coworker continuously investigating your environment, OpsPilot provides a practical foundation for moving from reactive monitoring towards more proactive, AI-assisted operations.

Average Rating: 4.8/5.0

Total Reviews: 184

How Do G2 Users Rate OpsPilot?

  • Monitoring: 9.4/10 (Category avg: 9.0/10)
  • Has the product been a good partner in doing business?: 9.5/10 (Category avg: 9.0/10)
  • Reporting: 9.1/10 (Category avg: 8.7/10)
  • Logging: 9.2/10 (Category avg: 8.6/10)

Who Is the Company Behind OpsPilot?

  • Seller: Intergral
  • Company Website:
  • Year Founded: 1998
  • HQ Location: Böblingen, DE
  • LinkedIn® Page: www.linkedin.com
    1 employees on LinkedIn®

Who Uses This Product?

  • Who Uses This: Developer, CTO
  • Top Industries: Information Technology and Services, Computer Software
  • Company Size: 64% Small, 27% Medium

What Do G2 Reviewers Say About OpsPilot?

AI-generated summary from verified user reviews

Pros
  • Users value the real-time monitoring capabilities of OpsPilot, enhancing troubleshooting and application performance visibility substantially.
  • Users value the real-time monitoring of OpsPilot, enhancing troubleshooting and ensuring application stability with precise insights.
  • Users appreciate the ease of use of OpsPilot, enjoying straightforward setup and excellent integration across platforms.
  • Users value the real-time performance monitoring of OpsPilot, enhancing troubleshooting and application stability significantly.
  • Users value the real-time monitoring capabilities of OpsPilot, enhancing troubleshooting efficiency and application performance insights.
Cons
  • Users find the learning curve steep due to complex features and confusing settings that hinder effective use.
  • Users find OpsPilot to be expensive, but recognize its value justifies the cost for managing infrastructure.
  • Users find the learning difficulty of OpsPilot challenging, requiring time to fully grasp its features and functionalities.
  • Users find the cloud version's confusing UI challenging to navigate, impacting their overall experience with OpsPilot.
  • Users express concern over data limitations in OpsPilot, noting restricted history and potential insight loss without proper configuration.

What Are Recent G2 Reviews of OpsPilot?

What Are G2 Users Discussing About OpsPilot?

pganalyze

pganalyze is a Postgres performance optimization product for engineering teams. It captures query performance, wait events, and other critical data, finds the root cause of slow queries, bad indexes, and table bloat in minutes, and lets you investigate safely with AI tools such as Claude Code through the pganalyze MCP Server. More than 700 teams, including Notion, Auto Trader UK, and Fivetran, use pganalyze. With pganalyze, teams: ✓ Find and fix slow queries before customers notice ✓ Ship index and plan changes with confidence ✓ Keep autovacuum running smoothly ✓ Spend on tuning, not bigger instances ✓ Make every engineer and AI agent a Postgres expert ✓ Meet security and compliance standards The Index Advisor, Query Advisor, and VACUUM Advisor recommend indexes, query rewrites, and autovacuum settings, and pganalyze Workbooks let you test and validate a fix before you ship. The pganalyze collector filters PII on your own infrastructure before anything leaves, and sign-in supports SAML SSO. pganalyze works with Amazon RDS and Aurora, Google Cloud SQL and AlloyDB, Azure Database for PostgreSQL, Heroku, Crunchy Bridge, Aiven, Supabase, Neon, and self-managed Postgres, including Kubernetes. Use it as a cloud service, or self-host with pganalyze Enterprise Server.

Average Rating: 4.4/5.0

Total Reviews: 43

How Do G2 Users Rate pganalyze?

  • Monitoring: 8.6/10 (Category avg: 9.0/10)
  • Has the product been a good partner in doing business?: 8.5/10 (Category avg: 9.0/10)
  • Reporting: 7.8/10 (Category avg: 8.7/10)
  • Logging: 8.1/10 (Category avg: 8.6/10)

Who Is the Company Behind pganalyze?

  • Seller: pganalyze
  • Company Website:
  • Year Founded: 2012
  • HQ Location: San Francisco, US
  • LinkedIn® Page: www.linkedin.com
    11 employees on LinkedIn®

Who Uses This Product?

  • Who Uses This: Software Engineer
  • Top Industries: Computer Software, Information Technology and Services
  • Company Size: 56% Medium, 28% Small

What Do G2 Reviewers Say About pganalyze?

AI-generated summary from verified user reviews

Pros
  • Users appreciate the expert insights from pganalyze, enhancing their understanding and optimizing PostgreSQL performance effortlessly.
  • Users appreciate the ease of use of pganalyze, enabling quick setup and seamless optimization of PostgreSQL databases.
  • Users appreciate the performance optimization capabilities of pganalyze, enhancing their database management and query efficiency.
  • Users appreciate the excellent performance monitoring of pganalyze, enabling quick identification and resolution of database issues.
  • Users value the insightful SQL query analysis from pganalyze, significantly enhancing database performance and optimization efforts.
Cons
  • Users find pganalyze's learning curve steep, especially for beginners trying to grasp its complex features.
  • Users find pganalyze to be expensive, particularly for smaller teams or startups with budget constraints.
  • Users find the difficult setup of pganalyze to be daunting and requires significant effort to understand.
  • Users find pricing issues with pganalyze, noting potential barriers for smaller teams and startups due to costs.
  • Users find the confusing details of pganalyze overwhelming initially, requiring time to understand essential metrics and recommendations.

What Are Recent G2 Reviews of pganalyze?

What Are G2 Users Discussing About pganalyze?

Monte Carlo

Monte Carlo is the agent trust platform, trusted by Nasdaq, Cisco, PepsiCo, and hundreds of enterprise organizations worldwide. Founded in 2019 and backed by leading investors, Monte Carlo pioneered data observability and has expanded into the full AI reliability stack. We're consistently ranked #1 in data observability on G2 — and we're built for what comes next. As enterprises scale from dozens to thousands of AI agents across mission-critical use cases, Monte Carlo monitors, troubleshoots, and improves both those agents and the underlying data powering them. Our platform covers the full trust stack — from the data pipelines feeding agents, to the context they retrieve, the decisions they make, and the outputs they produce — across four trust dimensions: context quality, performance, behavior, and outputs. Only Monte Carlo closes the full trust loop across both data and AI, and we meet enterprises wherever they are on the spectrum from human-guided oversight to fully autonomous operations. With 100+ integrations across Snowflake, Databricks, and the rest of your stack, you get full coverage without ripping anything out. Traditional monitoring tools stop at the pipeline or cover only one dimension of reliability — leaving teams to manually investigate, diagnose, and fix failures across disconnected tools. Monte Carlo closes that gap. Teams using Monte Carlo dramatically reduce time to detect and resolve data and AI incidents, scale monitoring coverage without scaling headcount, and build the internal trust that turns AI investments into real business outcomes. If your organization is serious enough about AI to put it in front of customers, executives, and critical decisions — Monte Carlo is the foundation it needs.

Average Rating: 4.3/5.0

Total Reviews: 578

How Do G2 Users Rate Monte Carlo?

  • Monitoring: 9.0/10 (Category avg: 9.0/10)
  • Has the product been a good partner in doing business?: 9.3/10 (Category avg: 9.0/10)
  • Reporting: 7.7/10 (Category avg: 8.7/10)
  • Logging: 7.8/10 (Category avg: 8.6/10)

Who Is the Company Behind Monte Carlo?

  • Seller: Monte Carlo
  • Company Website:
  • Year Founded: 2019
  • HQ Location: San Francisco, US
  • LinkedIn® Page: www.linkedin.com
    550 employees on LinkedIn®

Who Uses This Product?

  • Who Uses This: Data Engineer, Senior Data Engineer
  • Top Industries: Financial Services, Computer Software
  • Company Size: 51% Large, 41% Medium

What Do G2 Reviewers Say About Monte Carlo?

AI-generated summary from verified user reviews

Pros
  • Users appreciate the ease of use of Monte Carlo, benefiting from intuitive tools and quick navigation features.
  • Users appreciate the reliable alerts from Monte Carlo, enhancing confidence in code quality and bug detection.
  • Users appreciate the reliable monitoring of Monte Carlo, which enhances data quality and swiftly identifies issues in pipelines.
  • Users value the automated alerting system in Monte Carlo for its quick detection of data issues, enhancing reliability.
  • Users appreciate the reliable data quality of Monte Carlo, enhancing confidence and simplifying bug detection in their code.
Cons
  • Users express frustration with ineffective alert management, citing poor communication and unresponsive ML threshold adjustments.
  • Users often feel overwhelmed by alert overload due to ineffective ML threshold adjustments, leading to numerous false errors.
  • Users experience an inefficient alert system with Monte Carlo, leading to missed updates and numerous false errors.
  • Users find the UX improvements lacking, particularly in feature accessibility and efficiency in database selections.
  • Users express frustration with Monte Carlo's limited functionality, citing lack of coding options and delayed alerts for metric monitors.

What Are Recent G2 Reviews of Monte Carlo?

What Are G2 Users Discussing About Monte Carlo?

AI can help you find the answers. G2 helps you trust them.

Connect G2 to Claude or ChatGPT for answers grounded in G2's trusted reviews, comparisons, and pricing from real user insights.

How it works

Informatica Data Quality & Observability

Informatica Data Quality is a comprehensive solution designed to help organizations ensure their data is accurate, complete, and reliable. By automating critical data quality tasks, it enables businesses to trust their data for analytics, decision-making, and customer engagement. This tool supports data cleansing, standardization, validation, and enrichment across various data sources and platforms, ensuring consistency and reliability throughout the data lifecycle. Key Features and Functionality: - Data Discovery and Profiling: Allows users to profile data and perform iterative analysis to identify relationships and detect quality issues. - Rich Set of Transformations: Offers capabilities such as standardization, validation, enrichment, and de-duplication to transform data effectively. - Reusable Rules and Accelerators: Provides prebuilt business rules and accelerators that can be reused to maintain consistent data quality standards. - Integrated Data Governance: Ensures data quality is applied automatically with integrated data governance and cataloging. - AI-Powered Automation: Utilizes AI to streamline data quality processes, enhancing productivity and efficiency. Primary Value and Solutions Provided: Informatica Data Quality addresses the challenge of maintaining high-quality data across an organization. By automating data quality tasks, it reduces manual effort and minimizes errors, leading to more accurate analytics and informed decision-making. The solution ensures that data is clean, complete, and free of duplicates, which is essential for reliable business insights. Additionally, by standardizing and validating data, organizations can deliver more relevant and personalized customer experiences, thereby enhancing customer engagement and satisfaction.

Average Rating: 4.3/5.0

Total Reviews: 62

How Do G2 Users Rate Informatica Data Quality & Observability?

  • Has the product been a good partner in doing business?: 8.8/10 (Category avg: 9.0/10)

Who Is the Company Behind Informatica Data Quality & Observability?

  • Seller: Informatica
  • Year Founded: 1993
  • HQ Location: Redwood City, CA
  • LinkedIn® Page: www.linkedin.com
    2,473 employees on LinkedIn®
  • Ownership: NYSE: INFA
  • Phone: 650-385-5000

Who Uses This Product?

  • Top Industries: Computer Software, Information Technology and Services
  • Company Size: 75% Large, 50% Medium

What Do G2 Reviewers Say About Informatica Data Quality & Observability?

AI-generated summary from verified user reviews

Pros
  • Users value the customization options of Informatica Data Quality & Observability, tailoring rules to meet specific needs.
Cons
  • Users face a difficult learning curve with Informatica Data Quality & Observability, requiring significant time to grasp functionalities.
  • Users find a learning difficulty due to the considerable time needed to understand functionalities and features of Informatica Data Quality & Observability.
  • Users face significant training requirements to fully grasp the functionalities and features of Informatica Data Quality & Observability.

What Are Recent G2 Reviews of Informatica Data Quality & Observability?

What Are G2 Users Discussing About Informatica Data Quality & Observability?

Zabbix

Zabbix is an all-in-one, open source monitoring and observability solution that makes any hardware, software, service, or web application more efficient and reliable. Available on-premise and in the cloud, Zabbix can deploy anywhere and monitor any device, system, or app in any environment – while providing comprehensive data protection, easy integration, and limitless data visualization options. Zabbix uses a wide range of data collection methods to collect metrics, defining smart problem thresholds and harnessing the power of machine learning to suppress unwanted alert storms and notify users regarding the root cause of issues. Metrics are displayed on intuitive, easy-to-understand dashboards that allow users to access issues, reports, and maps with a single click. Users can monitor anything from physical and virtual servers or containers to network infrastructure and applications. Zabbix allows users to: • Control their infrastructure by collecting any metric from any source • Detect problems instantly • Get alerted on critical issues • Gain additional insights and extend observability via powerful data visualization • Leverage a single pane of glass for an entire infrastructure • Keep track of KPI's with business service monitoring • Seamlessly deploy Zabbix within any infrastructure • Deploy with just a few clicks, either on-premise or in the cloud • Scale quickly and without limits • Do business with the peace of mind that enterprise-grade security provides Zabbix also offers a full range of professional services, including: • Technical support subscriptions • Zabbix professional training • Migration • Upgrades • Template building • Development • Integration • Consulting • Turnkey solution

Average Rating: 4.3/5.0

Total Reviews: 219

How Do G2 Users Rate Zabbix?

  • Monitoring: 8.7/10 (Category avg: 9.0/10)
  • Has the product been a good partner in doing business?: 8.1/10 (Category avg: 9.0/10)
  • Reporting: 8.3/10 (Category avg: 8.7/10)
  • Logging: 8.5/10 (Category avg: 8.6/10)

Who Is the Company Behind Zabbix?

  • Seller: Zabbix
  • Company Website:
  • Year Founded: 2005
  • HQ Location: Riga, Latvia
  • LinkedIn® Page: www.linkedin.com
    171 employees on LinkedIn®

Who Uses This Product?

  • Who Uses This: IT Manager, System Administrator
  • Top Industries: Information Technology and Services, Telecommunications
  • Company Size: 59% Medium, 27% Large

What Do G2 Reviewers Say About Zabbix?

AI-generated summary from verified user reviews

Pros
  • Users value the comprehensive monitoring capabilities of Zabbix, ensuring efficient and automated oversight of their systems.
  • Users highlight the ease of use in Zabbix, appreciating its straightforward setup and seamless integrations.
  • Users value the monitoring capabilities of Zabbix for efficiently managing diverse systems and infrastructure seamlessly.
  • Users appreciate the ease of monitoring with Zabbix, enjoying comprehensive insights across various systems and infrastructures.
  • Users praise the real-time monitoring capabilities of Zabbix, enhancing efficiency and proactive management across systems.
Cons
  • Users face a steep learning curve with Zabbix, especially when aiming for advanced customization and automation.
  • Users face dashboard limitations that hinder customization, impacting their ability to meet specific management needs.
  • Users express frustration over data limitations, as Zabbix lacks expected customizable dashboards and certain essential features.
  • Users find difficult configuration challenging, particularly during setup and for new users adapting to Zabbix.
  • Users find the difficult learning curve at the beginning challenging, impacting their experience with Zabbix.

What Are Recent G2 Reviews of Zabbix?

What Are G2 Users Discussing About Zabbix?

Avenue

Avenue is a data observability platform that helps companies monitor and analyze their data in real-time. Our platform allows users to create monitors that track specific events or conditions in their data warehouse using SQL or other database types (like Airtable or Google Sheets). Monitors generate signals, which are like tickets or individual units of work, representing a single row of data from our customers' databases. These signals can be used to trigger notifications, create incidents for tracking progress and state, and can be sent to various subscriber destinations such as Slack, SMS, Email, etc. Avenue integrates with popular tools like Slack, Zendesk, and Customer.io to help users receive alerts and execute workflows seamlessly. With Avenue, operations teams can easily monitor important business events and take proactive actions based on the insights gained from the monitored data.

Average Rating: 4.9/5.0

Total Reviews: 30

How Do G2 Users Rate Avenue?

  • Monitoring: 9.7/10 (Category avg: 9.0/10)
  • Has the product been a good partner in doing business?: 9.5/10 (Category avg: 9.0/10)
  • Reporting: 9.8/10 (Category avg: 8.7/10)
  • Logging: 9.8/10 (Category avg: 8.6/10)

Who Is the Company Behind Avenue?

  • Seller: Avenue
  • Year Founded: 2020
  • HQ Location: New York, New York
  • LinkedIn® Page: www.linkedin.com
    10 employees on LinkedIn®

Who Uses This Product?

  • Top Industries: Computer Software
  • Company Size: 87% Small, 13% Medium

What Are Recent G2 Reviews of Avenue?

Tian Lin
TL
Researched and written by Tian Lin
Updated