Best Data Visualization Tools - Page 12

How Many Data Visualization Tools Products Does G2 Track?

Total Products under this Category: 478

Category Stats (Aug 2026)

  • Average Rating: 4.43/5 The average rating of products in this category, based on all submitted ratings
  • Top Trending Product: Supersimple (+0.89%) - Among all products in this category, Supersimple recorded the largest rating increase compared to last month

Last updated: August 04, 2026

How Does G2 Rank Data Visualization Tools Products?

Why You Can Trust G2's Software Rankings:

  • 30 Analysts and Data Experts
  • 26,100+ Authentic Reviews
  • 478+ Products
  • Unbiased Rankings

G2's software rankings are built on verified user reviews, rigorous moderation, and a consistent research methodology maintained by a team of analysts and data experts. Each product is measured using the same transparent criteria, with no paid placement or vendor influence. While reviews reflect real user experiences, which can be subjective, they offer valuable insight into how software performs in the hands of professionals. Together, these inputs power the G2 Score, a standardized way to compare tools within every category.

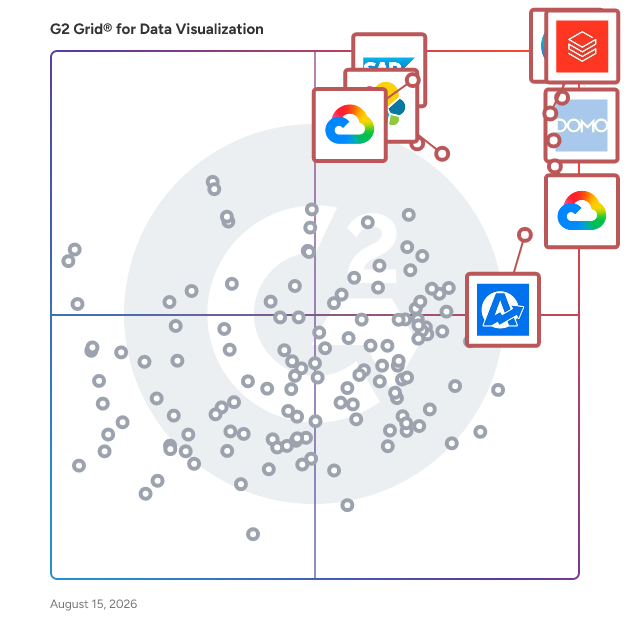
G2 Grid® for Data Visualization Tools

G2 Grid® for Data Visualization Tools plotting products by satisfaction and market presence

Highlighted products: Canva, Databricks, Domo, Looker, Data Studio, Elastic Stack, SAP HANA Cloud, and AgencyAnalytics.

Underlying data: [Grid® JSON](https://www.g2.com/categories/data-visualization-tools/grids.json?focus%5B%5D=canva&focus%5B%5D=databricks&focus%5B%5D=domo&focus%5B%5D=looker&focus%5B%5D=data-studio&focus%5B%5D=elastic-stack&focus%5B%5D=sap-hana-cloud-2025-10-01&focus%5B%5D=agencyanalytics)

Sponsored

Zenlytic

Most orgs have more data than they know what to do with. Zenlytic changes that. Zenlytic is the AI Data Analyst for your entire org. Zoë answers the hardest questions and builds the decks, memos, and Excel models to back them up. She onboards in under an hour and surfaces verified answers on demand. Companies in retail, SaaS, technology, and finance use Zenlytic to stop waiting on data and start acting on it. Business teams get answers without the backlog. Data teams get out of the weeds. Curious what that looks like for your org? Start here.

Visit website

Icaro Tech Advanced Dashboards

CONTROL PANEL FOR INFRASTRUCTURE AND OPERATIONS MANAGEMENT

Average Rating: 4.2/5.0

Total Reviews: 5

How Do G2 Users Rate Icaro Tech Advanced Dashboards?

  • Has the product been a good partner in doing business?: 9.2/10 (Category avg: 9.0/10)
  • Dashboards: 9.4/10 (Category avg: 9.0/10)
  • Steps to Answer: 9.2/10 (Category avg: 8.6/10)
  • Formats: 8.3/10 (Category avg: 8.6/10)

Who Is the Company Behind Icaro Tech Advanced Dashboards?

  • Seller: Icaro Tech
  • Year Founded: 1997
  • HQ Location: Campinas, SP
  • Twitter: @icarotech
    336 Twitter followers
  • LinkedIn® Page: www.linkedin.com
    323 employees on LinkedIn®

Who Uses This Product?

  • Company Size: 60% Small, 40% Medium

What Are Recent G2 Reviews of Icaro Tech Advanced Dashboards?

RAWGraphs

RAWGraphsis an open web tool to create custom vector-based visualizations.

Average Rating: 4.4/5.0

Total Reviews: 5

How Do G2 Users Rate RAWGraphs?

  • Has the product been a good partner in doing business?: 8.3/10 (Category avg: 9.0/10)
  • Dashboards: 10.0/10 (Category avg: 9.0/10)
  • Steps to Answer: 9.4/10 (Category avg: 8.6/10)
  • Formats: 9.4/10 (Category avg: 8.6/10)

Who Is the Company Behind RAWGraphs?

  • Seller: RAW Graphs
  • Year Founded: 2013
  • HQ Location: British Indian Ocean Territory
  • Twitter: @code4africa
    18,931 Twitter followers
  • LinkedIn® Page: www.linkedin.com
    2 employees on LinkedIn®

Who Uses This Product?

  • Company Size: 80% Small, 20% Medium

What Are Recent G2 Reviews of RAWGraphs?

Rayven

What is Rayven? Rayven is an operational software platform that delivers an AI data fabric - connecting every system, data source, and data stream across a business into a single managed environment, then letting teams build custom apps, AI agents, workflow automations, dashboards, and MCP servers for direct AI model connectivity on top. It is the platform for organisations that need to act on operational data in real-time, deploy AI that actually works in production + build software that fits the way their business operates - without replacing existing systems or waiting 18 months for results. The Problem Rayven Solves Most organisations already have the systems and data they need. The challenge is fragmentation. ERP systems, SCADA platforms, IoT devices, databases, cloud tools, and files all generate valuable data - but it sits in silos, impossible to act on in real-time. The result: manual reporting, disconnected workflows, and AI projects that fail before reaching production. Industry research shows 95% of AI projects never ship - most because the underlying data layer is not clean, connected, or ready. Rayven builds that foundation first, then activates it. The Rayven Platform Rayven operates across five unified layers, delivered as a single managed environment: - Integration: More than 600 pre-built connectors pull data from IT, OT, IoT, files, APIs, databases, and data streams - bidirectionally, in real-time. Connects industrial protocols (OPC UA, Modbus, MQTT, BACnet) alongside cloud platforms, business systems, and proprietary tools. - Data: All connected data lands in a single managed platform - structured, governed + AI-ready. Real-time processing, ETL pipelines, data lakes, and AI model training handled in one place. - Execution: Automation rules, predictive models + agentic AI run directly on live operational data. Rules-based logic, machine learning, and goal-seeking autonomous agents all operate in one execution environment. - Presentation: Custom apps, dashboards, portals, conversational interfaces, and mobile applications deployed from the same platform - built for specific workflows, not generic reporting. - Security, Governance + Hosting: Role-based access control, data lineage, audit trails, AES-256 encryption, data residency controls, and enterprise-grade infrastructure - included as standard. AI Capabilities Rayven includes ten native AI capabilities built directly into the platform: 1. Custom AI agents (goal-seeking, action-taking) 2. Predictive analytics and machine learning 3. Conversational analytics 4. Real-time and continuous model training 5. AI-led workflow automation 6. Multimodal processing (documents, video, images, audio) 7. Anomaly and risk detection 8. Forecasting and optimisation 9. Vision and edge AI inference 10. Generative operational summaries MCP server support enables direct connectivity for AI models including Claude, GPT, and others. What Gets Built Rayven customers build and deploy: - Custom operational apps and field applications. - AI agents that monitor conditions, detect anomalies + take corrective action autonomously. - Predictive maintenance and performance models running on live plant data. - Real-time dashboards and executive reporting tools. - Workflow automations spanning IT and OT systems. - Customer and partner portals. - Data pipelines and integration layers. - White-label software products delivered under partner brands. Key Differentiators vs. Point solutions (Zapier, MuleSoft, Power BI, DataRobot): point solutions do one thing well but force teams to stitch together five separate tools to cover integration, data, AI, presentation, and governance. Rayven replaces the stack. vs. Traditional enterprise platforms (SAP, Oracle, Palantir): enterprise platforms take 12-18 months and seven figures to implement. Rayven deploys in two to 12 weeks at fixed scope and fixed price. vs. Low-code app builders (Mendix, OutSystems): app builders handle the presentation layer but do not solve the underlying data and integration problem. Rayven covers the full stack. Technology Compatibility Rayven is fully technology-agnostic and works alongside existing systems: - Cloud platforms: Microsoft Azure, Google Cloud + AWS - Business systems: SAP, Salesforce, Oracle, and Microsoft 365 - OT platforms: Siemens, Rockwell, Schneider Electric, and Ignition - Industrial protocols: OPC UA, Modbus, MQTT, BACnet, and EtherNet/IP - IoT devices: any device with a data output - Custom and proprietary systems via API, webhook, or direct connector Nothing needs to be replaced. Every existing investment is preserved. Who Uses Rayven Rayven serves businesses from growth-stage to large enterprise across 24+ industries globally - manufacturing, mining, construction, infrastructure, logistics, utilities, financial services, healthcare, agriculture, government, and more. Customers across Australia, Europe, North America, South America, and Africa. Named customers include Anglo American, Fulton Hogan, Glencore, Vodafone, NSW Ports, CSIRO, Collective Intelligence, Ramjack, and AngloGold Ashanti. Delivery Options - DIY: Full platform access. Internal teams build and deploy independently. - Done-For-You: Australia-based delivery team. Fixed scope, fixed price, two to 12 weeks from brief to go-live. - Hybrid: Guided delivery first, with the customer's team taking increasing ownership over time. By the Numbers - More than 600 pre-built connectors. - Ten native AI capabilities. - More than 240 deployments live globally. - Rated 5/5 across more than 140 independent reviews. - Deploys 66% faster than traditional development. - Two to 12 weeks to first working solution. - Rayven exists to close the gap: 95% of AI projects never reach production (industry average).

Average Rating: 4.9/5.0

Total Reviews: 29

Who Is the Company Behind Rayven?

  • Seller: Rayven
  • Year Founded: 2016
  • HQ Location: Sydney, AU
  • Twitter: @RayvenIOT
    56 Twitter followers
  • LinkedIn® Page: www.linkedin.com
    33 employees on LinkedIn®

Who Uses This Product?

  • Top Industries: Retail
  • Company Size: 69% Medium, 52% Small

What Do G2 Reviewers Say About Rayven?

AI-generated summary from verified user reviews

Pros
  • Users commend Rayven's ease of use, highlighting effortless automation and streamlined integration through intuitive drag-and-drop features.
  • Users appreciate Rayven's robust handling of large-scale data and advanced AI capabilities, enhancing operational efficiency and flexibility.
  • Users praise Rayven for its exceptional automation capabilities, significantly streamlining data workflows and enhancing operational efficiency.
  • Users appreciate Rayven's customization capabilities, allowing tailored solutions that enhance integration and streamline operations efficiently.
  • Users appreciate Rayven's robust data management, enabling real-time processing and integration across complex systems with ease.
Cons
  • Users find the learning curve steep initially, requiring time and guidance to fully grasp all features.
  • Users find difficult learning curves with Rayven's features, requiring time and guidance for smoother onboarding experiences.
  • Users experience a steep learning curve initially, requiring time and additional resources to fully understand the platform.
  • Users find the complex setup challenging, especially with advanced features and multi-site deployments requiring careful planning.
  • Users note the setup complexity of Rayven, requiring assistance for advanced integrations and lengthy initial configurations.
What Are Recent G2 Reviews of Rayven?

Revintel

Driven by Power BI, Revintel provides total revenue analysis that transforms your disparate datasets into actionable business intelligence. Spend more time on analysis and strategy rather than acquiring data. With 55 standard out-of-the-box reports and Revintel’s BI solution, Compose, seamlessly create your own custom brand-matched interactive visualizations in a variety of formats. The easy-to-use interface promotes cross-team collaboration. Marketing can view real-time campaign performance; sales can monitor negotiated accounts by tracking performance at the rate code level; and, of course, revenue managers can view the full picture of ancillary and room revenue at the agency, corporate and portfolio level. The easy drag & drop functionality for reports makes it simple for anyone on your team to build and analyze custom dashboards and reports in just minutes – no complex spreadsheets or programming required.

Average Rating: 3.8/5.0

Total Reviews: 5

How Do G2 Users Rate Revintel?

  • Has the product been a good partner in doing business?: 6.7/10 (Category avg: 9.0/10)
  • Dashboards: 7.0/10 (Category avg: 9.0/10)
  • Steps to Answer: 7.0/10 (Category avg: 8.6/10)
  • Formats: 8.3/10 (Category avg: 8.6/10)

Who Is the Company Behind Revintel?

  • Seller: Cendyn
  • Year Founded: 1996
  • HQ Location: Boca Raton, FL
  • Twitter: @Cendyn
    2,943 Twitter followers
  • LinkedIn® Page: www.linkedin.com
    734 employees on LinkedIn®

Who Uses This Product?

  • Company Size: 80% Small, 20% Medium

What Do G2 Reviewers Say About Revintel?

AI-generated summary from verified user reviews

Pros
  • Users appreciate the user-friendly interface of Revintel, simplifying the creation of dashboards and insightful reports.
  • Users appreciate the easy creation feature of Revintel, enabling quick and efficient dashboard and report customization.
  • Users value the user-friendly interface of Revintel, which simplifies dashboard creation and enhances data visualization.
  • Users love the user-friendly interface of Revintel, making custom dashboards and reports a breeze to create.
  • Users love the easy-to-use visualization tools in Revintel, enabling swift creation of insightful dashboards and reports.
Cons
  • Users note that the product's high pricing may deter smaller businesses from utilizing its powerful features.
  • Users find the pricing to be high, potentially limiting access for smaller businesses looking for powerful tools.
  • Users find the poor customer support of Revintel frustrating, as queries often take too long to resolve.

What Are Recent G2 Reviews of Revintel?

SalesVisual

SalesVisual lets you visualize your Salesforce relationships. Simply install it and discover how your contacts, accounts, opportunities, users, campaigns and products relate to each other.

Average Rating: 4.6/5.0

Total Reviews: 5

How Do G2 Users Rate SalesVisual?

  • Has the product been a good partner in doing business?: 10.0/10 (Category avg: 9.0/10)
  • Dashboards: 10.0/10 (Category avg: 9.0/10)
  • Steps to Answer: 10.0/10 (Category avg: 8.6/10)
  • Formats: 10.0/10 (Category avg: 8.6/10)

Who Is the Company Behind SalesVisual?

  • Seller: IntellectSpace
  • HQ Location: Seattle, WA
  • Twitter: @IntellectSpace
    132 Twitter followers
  • LinkedIn® Page: www.linkedin.com
    1 employees on LinkedIn®

Who Uses This Product?

  • Company Size: 80% Small, 20% Medium

What Are Recent G2 Reviews of SalesVisual?

What Are G2 Users Discussing About SalesVisual?

TELUS Trade Promotion Management

TELUS Trade Promotion Management’s offerings (formerly Blacksmith Applications and Exceedra) are delivered via a SaaS platform specifically engineered to streamline both retail and foodservice trade planning, execution and analysis in a single, auditable system of record. The solution empowers consumer packaged goods (CPG) manufacturers to move beyond manual oversight by centralizing promotion planning, financial reconciliation and advanced optimization. By integrating these critical functions, the platform ensures that every dollar of trade spend is backed by real-time P&L visibility and precision-driven forecasting to maximize total return on investment (ROI). For manufacturers navigating the fragmented data landscapes of the CPG industry, TELUS TPM serves as a primary driver of operational efficiency. It directly tackles the common challenges faced by sales, finance and revenue growth management teams. The platform bridges these gaps by simplifying the complexities of deduction management while simultaneously enhancing the reliability of inventory and demand planning through real-time baselines and volume phasing. A core pillar of the technology is its purpose-built framework that supports foodservice and retail trade in a single platform. TELUS TPM manages direct shipment data alongside indirect redistribution sales and helps reduce administrative effort by automating deduction matching and accruals, featuring native data integration with industry giants like Sysco, US Foods, and DOT. This specialized visibility into contracts and promotions allows teams to collapse analysis cycles from one week down to just 30 minutes and achieve 30% better forecasting through AI-enhanced demand modeling. Furthermore, its advanced proxy planning capabilities allow brands to maintain data accuracy for new launches or non-syndicated retailers even when traditional POS or syndicated data is unavailable. Beyond execution, the platform provides deep financial intelligence through a fully-configured, always-live P&L and automated accrual management. This transparency enables leadership to make proactive pricing decisions and prevent overspend before it impacts the bottom line. By leveraging an AI assistant, users can interact with their data in plain language to uncover hidden performance drivers and reallocate resources to the most productive programs. Scale with confidence: TELUS TPM is a seven-time Promotion Optimization Institute Best-in-Class award winner with a legacy of delivering measurable results, including recovering $2.1M in lost revenue in two years for a single partner. With over 25 years of industry experience and a global footprint of more than 300 clients, TELUS solutions are trusted by 15 of the top 20 CPG companies. Industry leaders such as Smithfield Foods, Lindt Canada, and T. Marzetti rely on TELUS TPM to drive superior promotional performance and achieve sustainable growth. For more information on TELUS TPM results visit TELUS.com/consumergoods.

Average Rating: 3.9/5.0

Total Reviews: 17

How Do G2 Users Rate TELUS Trade Promotion Management?

  • Has the product been a good partner in doing business?: 8.3/10 (Category avg: 9.0/10)
  • Dashboards: 9.2/10 (Category avg: 9.0/10)
  • Steps to Answer: 10.0/10 (Category avg: 8.6/10)
  • Formats: 9.2/10 (Category avg: 8.6/10)

Who Is the Company Behind TELUS Trade Promotion Management?

  • Seller: Telus
  • Company Website:
  • Year Founded: 1990
  • HQ Location: Vancouver, CA
  • Twitter: @TELUS
    120,594 Twitter followers
  • LinkedIn® Page: www.linkedin.com
    38,106 employees on LinkedIn®

Who Uses This Product?

  • Top Industries: Food Production
  • Company Size: 47% Medium, 29% Large

What Do G2 Reviewers Say About TELUS Trade Promotion Management?

AI-generated summary from verified user reviews

Pros
  • Users appreciate the business efficiency of TELUS Trade Promotion Management, enhancing their workflow and prioritization.
  • Users appreciate the ease of use of TELUS Trade Promotion Management, allowing effortless prioritization of tasks.
  • Users appreciate the planning efficiency of TELUS Trade Promotion Management, allowing for easy prioritization of tasks.
  • Users appreciate the security features of TELUS Trade Promotion Management, enhancing their confidence in the platform's safety.
Cons
  • Users feel the outdated interface of TELUS Trade Promotion Management needs modernization for better usability and experience.

What Are Recent G2 Reviews of TELUS Trade Promotion Management?

TRUECHART

With ultra-demanding corporate performance tasks such as forecasting and analysis getting in the way of doing business and creating unnecessary overhead, TRUECHART streamlines the entire process across your organization.

Average Rating: 4.2/5.0

Total Reviews: 5

How Do G2 Users Rate TRUECHART?

  • Has the product been a good partner in doing business?: 8.3/10 (Category avg: 9.0/10)

Who Is the Company Behind TRUECHART?

Who Uses This Product?

  • Company Size: 40% Large, 40% Small

What Are Recent G2 Reviews of TRUECHART?

Altair Flow HyperGraph

Altair® HyperGraph® is a comprehensive data analysis and visualization tool designed to streamline computer-aided engineering (CAE processes. It offers an intuitive interface and a sophisticated math engine capable of processing complex mathematical expressions, enabling users to extract meaningful insights from intricate datasets. HyperGraph supports a wide range of data formats and solvers, facilitating seamless integration into various engineering workflows. Its advanced automation features, including an automatic plot builder and customizable report templates, enhance productivity by minimizing manual tasks. With high-quality presentation outputs and extensive customization options, HyperGraph empowers engineers and analysts to make data-driven decisions efficiently. Key Features and Functionality: - Powerful 2D and 3D Data Analysis and Plotting: HyperGraph provides robust tools for analyzing and visualizing both 2D and 3D data, accommodating complex datasets with ease. - Broad Solver Compatibility: The software supports a wide array of solvers, including those from Altair's portfolio and others like Abaqus, Ansys, and more, ensuring flexibility across different engineering applications. - Extensive Data Format Support: HyperGraph can read over 130 data formats, including various test data formats, ensuring seamless data import and analysis. - Automatic Plot Builder: This feature generates fully annotated plots directly from engineering data, automatically assigning axes, headers, footers, legends, and curve properties for clear and comprehensible charts. - Customizable Math Library: Users can add custom-defined math functions to Altair’s robust math library, facilitating advanced CAE analysis tailored to specific needs. - Reusable Report Templates: HyperGraph allows the creation of standardized report templates, capturing channels, filter frequencies, and annotation text as parameters, which streamlines data analysis and results dashboarding. - Seamless Integration with Altair Products: The software integrates smoothly with other Altair products, such as Altair Compose® and Altair® HyperView®, enhancing its capabilities and providing a comprehensive analysis ecosystem. - Process Automation Tools: HyperGraph includes tools like command recording and playback, enabling users to automate repetitive tasks and ensure consistent results across analyses. Primary Value and User Solutions: HyperGraph addresses the challenges engineers and analysts face when dealing with complex datasets by providing an efficient and user-friendly platform for data analysis and visualization. Its automation capabilities reduce manual effort, allowing users to focus on interpreting results and making informed decisions. The software's extensive compatibility with various solvers and data formats ensures it can be seamlessly integrated into existing workflows, enhancing productivity and accuracy. By offering high-quality presentation outputs and customizable features, HyperGraph enables users to effectively communicate their findings, facilitating collaboration and innovation within engineering teams.

Average Rating: 3.9/5.0

Total Reviews: 4

How Do G2 Users Rate Altair Flow HyperGraph?

  • Dashboards: 10.0/10 (Category avg: 9.0/10)
  • Steps to Answer: 9.2/10 (Category avg: 8.6/10)
  • Formats: 8.3/10 (Category avg: 8.6/10)

Who Is the Company Behind Altair Flow HyperGraph?

  • Seller: Altair
  • Year Founded: 1985
  • HQ Location: Troy, MI
  • LinkedIn® Page: www.linkedin.com
    2,774 employees on LinkedIn®
  • Ownership: NASDAQ:ALTR
  • Total Revenue (USD mm): $458

Who Uses This Product?

  • Company Size: 50% Small, 50% Medium

What Do G2 Reviewers Say About Altair Flow HyperGraph?

AI-generated summary from verified user reviews

Pros
  • Users find data visualization capabilities of Altair Flow HyperGraph invaluable for analyzing complex engineering simulations effectively.
  • Users find that Altair Flow HyperGraph offers ease of use, streamlining the analysis and illustration of complex simulation data.
  • Users find Altair Flow HyperGraph extremely useful for comprehensive analysis and visualization of complex simulation data.
Cons
  • Users find the poor visualization of Altair Flow HyperGraph makes sharing findings tedious and inefficient across departments.
  • Users find it difficult to share visuals on Altair Flow HyperGraph, making presentations to other departments tiresome.

What Are Recent G2 Reviews of Altair Flow HyperGraph?

Chartist Js

Chartist.Js is a charting library. Provides with a simple configuration override mechanism based on media queries, simple responsive charts.

Average Rating: 3.9/5.0

Total Reviews: 4

Who Is the Company Behind Chartist Js?

Who Uses This Product?

  • Company Size: 50% Large, 25% Medium

What Are Recent G2 Reviews of Chartist Js?

What Are G2 Users Discussing About Chartist Js?

DashboardFox

DashboardFox is self-service business intelligence and dashboard software for teams that need to turn their data into interactive dashboards and reports — and deliver them to clients, departments, or locations under their own brand. Unlike most BI tools, DashboardFox is priced by monthly active users (MAU) instead of per seat, so you pay for a tier rather than for every login, and accounts that don't sign in cost nothing. Row-level security, white-label branding, and custom domains are included in every plan starting at $99/month — not gated behind an expensive enterprise tier — making it a lower-cost alternative to Power BI, Tableau, and Metabase, and a modern replacement for Crystal Reports and SSRS. Business users build unlimited dashboards and reports with a no-code builder and 20+ chart types, then schedule automated delivery or share them with teammates and external clients. Admins connect to 30+ data sources — including PostgreSQL, SQL Server, MySQL, Snowflake, BigQuery, Redshift, and REST APIs — with no ETL and no per-connector fees, and control exactly which tables and fields each group can access. Security is enterprise-grade: dedicated per-customer databases, AES-256 encryption at rest, TLS in transit, audit logs, and HIPAA-, FERPA-, and GDPR/CCPA-ready deployments. DashboardFox runs in the cloud or self-hosted on your own Windows, Linux, or Docker servers via a one-time license from $4,995. It's built and supported by 5000fish, a bootstrapped company shipping BI software since 1999 — so you work directly with the team behind the product.

Average Rating: 4.9/5.0

Total Reviews: 4

How Do G2 Users Rate DashboardFox?

  • Dashboards: 10.0/10 (Category avg: 9.0/10)
  • Steps to Answer: 10.0/10 (Category avg: 8.6/10)
  • Formats: 10.0/10 (Category avg: 8.6/10)

Who Is the Company Behind DashboardFox?

  • Seller: 5000fish, Inc
  • Year Founded: 2009
  • HQ Location: Henderson, US
  • Twitter: @5000fish
    525 Twitter followers
  • LinkedIn® Page: www.linkedin.com
    1 employees on LinkedIn®

Who Uses This Product?

  • Company Size: 50% Small, 25% Medium

What Are Recent G2 Reviews of DashboardFox?

emite

Unleash the Power of emite Advanced CX Analytics: Elevate Your Customer Experience! Discover the game-changing potential of emite Advanced CX Analytics. Gain deep insights into customer interactions, enhance satisfaction, and drive business growth—uncover more insights by combining all key data sources and migrate to the cloud with ease. Monitor in real-time, analyze omni-channel data, uncover sentiments, and make data-driven decisions effortlessly. With seamless integration and scalability, emite empowers you to revolutionize your customer experience and unlock the hidden value in the data you generate continuously. Elevate your business with emite—unleash the power of CX analytics in the cloud today!

Average Rating: 4.7/5.0

Total Reviews: 5

How Do G2 Users Rate emite?

  • Has the product been a good partner in doing business?: 10.0/10 (Category avg: 9.0/10)
  • Dashboards: 8.8/10 (Category avg: 9.0/10)
  • Steps to Answer: 5.8/10 (Category avg: 8.6/10)
  • Formats: 8.3/10 (Category avg: 8.6/10)

Who Is the Company Behind emite?

  • Seller: eMite
  • Year Founded: 2003
  • HQ Location: Sydney, AU
  • Twitter: @eMitedotcom
    183 Twitter followers
  • LinkedIn® Page: www.linkedin.com
    21 employees on LinkedIn®

Who Uses This Product?

  • Company Size: 40% Small, 40% Large

What Are Recent G2 Reviews of emite?

What Are G2 Users Discussing About emite?

everviz

everviz is an online visualization tool that helps you create interactive charts and maps. Embed your interactive visualizations on your website, blog or intranet - export them as images or PDF. We believe that telling stories with beautiful interactive visualizations makes the message easier to understand and more engaging. Our mission is to make it easy for anyone to create and publish stunning visualizations to tell compelling stories. Enter data directly, drop a CSV file into the editor, copy & paste from Excel, or connect to live data via our Google Sheet inte­gration. Our intuitive editor lets you choose chart type, edit text, fonts and colors to make your data stand out.

Average Rating: 4.8/5.0

Total Reviews: 4

How Do G2 Users Rate everviz?

  • Has the product been a good partner in doing business?: 10.0/10 (Category avg: 9.0/10)
  • Dashboards: 9.4/10 (Category avg: 9.0/10)
  • Steps to Answer: 10.0/10 (Category avg: 8.6/10)
  • Formats: 9.4/10 (Category avg: 8.6/10)

Who Is the Company Behind everviz?

  • Seller: everviz
  • Year Founded: 2020
  • HQ Location: Bergen, NO
  • LinkedIn® Page: www.linkedin.com
    8 employees on LinkedIn®

Who Uses This Product?

  • Company Size: 50% Medium, 25% Large

What Are Recent G2 Reviews of everviz?

FineReport

FineReport business intelligence and reporting tool is an Excel-analogous and Excel + Binding Data Column operation interface which greatly reduces learning costs.

Average Rating: 4.1/5.0

Total Reviews: 4

How Do G2 Users Rate FineReport?

  • Dashboards: 10.0/10 (Category avg: 9.0/10)
  • Steps to Answer: 9.4/10 (Category avg: 8.6/10)
  • Formats: 8.9/10 (Category avg: 8.6/10)

Who Is the Company Behind FineReport?

Who Uses This Product?

  • Company Size: 75% Medium, 25% Large

What Are Recent G2 Reviews of FineReport?

Flourish

Flourish is a powerful data visualization platform, proudly part of Canva, that makes it easy to turn complex data into interactive, engaging visuals - no coding required. From animated charts to interactive maps and data stories, Flourish gives you the tools to design and share dynamic visual content in just a few clicks. With a rich library of customizable templates and simple publishing options, it’s built for anyone who needs to communicate with data - fast. Trusted by teams, businesses, educators, and newsrooms worldwide, Flourish helps bring your data to life and tell stories that stick.

Average Rating: 4.9/5.0

Total Reviews: 4

How Do G2 Users Rate Flourish?

  • Dashboards: 10.0/10 (Category avg: 9.0/10)
  • Steps to Answer: 10.0/10 (Category avg: 8.6/10)
  • Formats: 9.2/10 (Category avg: 8.6/10)

Who Is the Company Behind Flourish?

  • Seller: Flourish
  • Year Founded: 2016
  • HQ Location: London, GB
  • LinkedIn® Page: www.linkedin.com
    40 employees on LinkedIn®

Who Uses This Product?

  • Company Size: 50% Small, 25% Medium

What Do G2 Reviewers Say About Flourish?

AI-generated summary from verified user reviews

Pros
  • Users enjoy the excellent customer support and ease of use that Flourish provides, enhancing their overall experience.
  • Users value the excellent customer support from Flourish, which enhances their experience and confidence in using the tool.
  • Users rave about the excellent data visualization capabilities of Flourish, making it a top choice for showcasing information.
  • Users appreciate the ease of use of Flourish, making interactive charts simple and enjoyable to create and manage.
  • Users find the setup impressively easy, enhancing confidence and making Flourish a pleasure to use from the start.

What Are Recent G2 Reviews of Flourish?

GoSimplo

: a zero-cost dashboard that saves you time and effort by visualizing all of your Forecast and financial data. Forecast is great. But we believe it’s even better with our easy-to-use dashboard. With GoSimplo, all of your financial, employee performance, and client revenue data is in one place. We integrate with platforms like WorkBook, Fortnox, Timelog, EazyProject, and others to provide you with an all-in-one reporting solution.

Average Rating: 4.9/5.0

Total Reviews: 4

How Do G2 Users Rate GoSimplo?

  • Has the product been a good partner in doing business?: 8.3/10 (Category avg: 9.0/10)
  • Dashboards: 9.4/10 (Category avg: 9.0/10)
  • Steps to Answer: 9.4/10 (Category avg: 8.6/10)
  • Formats: 9.4/10 (Category avg: 8.6/10)

Who Is the Company Behind GoSimplo?

  • Seller: GoSimplo
  • Year Founded: 2020
  • HQ Location: Copenhagen, DK
  • LinkedIn® Page: www.linkedin.com
    2 employees on LinkedIn®

Who Uses This Product?

  • Company Size: 50% Medium, 50% Small

What Are Recent G2 Reviews of GoSimplo?

Bijou Barry
BB
Researched and written by Bijou Barry
Updated June 24, 2026