Top Free Data Visualization Tools - Page 15

How Many Data Visualization Tools Products Does G2 Track?

Total Products under this Category: 754

Category Stats (Nov 2026)

  • Average Rating: 4.44/5 The average rating of products in this category, based on all submitted ratings
  • Top Trending Product: Upsolve AI (+1.75%) - Among all products in this category, Upsolve AI recorded the largest rating increase compared to last month

Last updated: November 01, 2026

How Does G2 Rank Data Visualization Tools Products?

Why You Can Trust G2's Software Rankings:

  • 30 Analysts and Data Experts
  • 40,600+ Authentic Reviews
  • 754+ Products
  • Unbiased Rankings

G2's software rankings are built on verified user reviews, rigorous moderation, and a consistent research methodology maintained by a team of analysts and data experts. Each product is measured using the same transparent criteria, with no paid placement or vendor influence. While reviews reflect real user experiences, which can be subjective, they offer valuable insight into how software performs in the hands of professionals. Together, these inputs power the G2 Score, a standardized way to compare tools within every category.

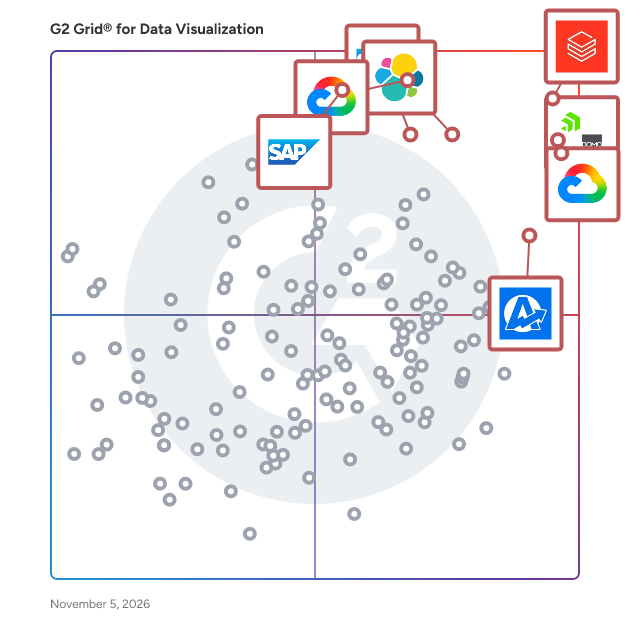
G2 Grid® for Data Visualization Tools

G2 Grid® for Data Visualization Tools plotting products by satisfaction and market presence

Highlighted products: Databricks, Domo, Looker, Data Studio, Elastic Stack, AgencyAnalytics, SAP HANA Cloud, and SAP Analytics Cloud.

Underlying data: [Grid® JSON](https://www.g2.com/categories/data-visualization-tools/grids.json?focus%5B%5D=databricks&focus%5B%5D=domo&focus%5B%5D=looker&focus%5B%5D=data-studio&focus%5B%5D=elastic-stack&focus%5B%5D=agencyanalytics&focus%5B%5D=sap-hana-cloud-2025-10-01&focus%5B%5D=sap-analytics-cloud)

Strategy One (formerly MicroStrategy ONE)

🚀 Strategy One – the AI+BI Platform for Enterprise Analytics at Scale What is Strategy One? Strategy One is the enterprise AI + BI platform that powers data-driven decision-making at scale. Built for complex enterprises, it unifies business intelligence, advanced analytics, and governed data modeling into a single, open platform. With native AI-powered workflows, pixel-perfect dashboards, modern self-service tools, and seamless integrations with Excel, Power BI, and Tableau, Strategy One delivers trusted insights wherever decisions are made. Why Strategy One? Unlike fragmented BI stacks or limited legacy tools, Strategy One provides an end-to-end platform with one trusted semantic core. Business users get governed self-service. Analysts get powerful modeling tools. Executives get real-time answers they can trust. And IT retains full control over data access, definitions, and lineage. Whether you’re creating executive dashboards, deploying embedded analytics, scaling AI copilots, or consolidating BI tools—Strategy One meets the moment with: ✅ Cloud-native architecture ✅ Open integrations with 200+ data sources ✅ Enterprise-grade security and governance ✅ Industry-leading performance and scale ✅ Built-in support for AI copilots, agents, and models Strategy One is trusted by global enterprises in banking, retail, healthcare, and government to turn data into decisions—fast, securely, and at scale.

Average Rating: 4.2/5.0

Total Reviews: 532

How Do G2 Users Rate Strategy One (formerly MicroStrategy ONE)?

  • Has the product been a good partner in doing business?: 7.7/10 (Category avg: 9.0/10)

Who Is the Company Behind Strategy One (formerly MicroStrategy ONE)?

Who Uses This Product?

  • Who Uses This: Business Intelligence Developer, Manager
  • Top Industries: Retail, Financial Services
  • Company Size: 62% Large, 29% Medium

What Do G2 Reviewers Say About Strategy One (formerly MicroStrategy ONE)?

AI-generated summary from verified user reviews

Pros
  • Users enjoy the ease of use in Strategy One, appreciating its straightforward setup and quick data access.
  • Users commend the constant innovation of Strategy One, appreciating its AI enhancements and advanced dashboard capabilities.
  • Users find the initial setup easy, making it impressive compared to other BI tools like Tableau and Power BI.
  • Users appreciate the high customization options of Strategy One, allowing tailored reports and dashboards for better insights.
  • Users appreciate the flexible dashboard customization in Strategy One, enabling easy data management and insightful analysis.
Cons
  • Users highlight the learning difficulty with Strategy One, especially when integrating Microsoft Excel files into dashboards.
  • Users report a steep learning curve with Strategy One, making initial navigation and proficiency challenging.
  • Users note the missing features and integrations in Strategy One, particularly with Copilot compared to competitors.
  • Users find the complex usage of Strategy One overwhelming, leading to a steep learning curve and navigation challenges.
  • Users feel that access restrictions limit availability, requiring an enterprise version for full functionality and customization.

What Are Recent G2 Reviews of Strategy One (formerly MicroStrategy ONE)?

What Are G2 Users Discussing About Strategy One (formerly MicroStrategy ONE)?

Stratifyd

Stratifyd is the only next-gen experience analytics platform powered by Smart AI™ that empowers people of all skill levels to move beyond traditional customer experience analytics. By surfacing insights that existing approaches may miss, Stratifyd Smart AI™ takes the burden of manual analytics off teams, proactively surfacing hidden signals and themes 24/7 to ensure you never miss another insight. Today, many organizations have tons of data but lack the ability, time, resources, or budget to truly expose the insights that matter most to them. This is where Stratifyd stands out. With these challenges in mind, we have purpose-built the Stratifyd platform that will unify data from all your different sources and, through Smart AI™, automatically uncover the actionable insights you didn't know you were missing to: - Hit mission critical KPIs - Grow revenue - Drive loyalty - Reduce costs - Improve efficiency

Average Rating: 4.3/5.0

Total Reviews: 18

How Do G2 Users Rate Stratifyd?

  • Has the product been a good partner in doing business?: 10.0/10 (Category avg: 9.0/10)

Who Is the Company Behind Stratifyd?

  • Seller: Stratifyd
  • Year Founded: 2015
  • HQ Location: Charlotte, US
  • LinkedIn® Page: www.linkedin.com
    14 employees on LinkedIn®

Who Uses This Product?

  • Company Size: 70% Large, 20% Medium

What Are Recent G2 Reviews of Stratifyd?

What Are G2 Users Discussing About Stratifyd?

Style Arcade

For fashion and apparel brands who want to grow faster, Style Arcade is a retail analytics platform that turns merchandising into a competitive advantage.​ Instead of relying on inaccessible systems; manual processes; and unreliable projections – Style Arcade unlocks merchandise data and proactively guides retailers on how to realize their untapped revenue potential.

Average Rating: 4.5/5.0

Total Reviews: 118

How Do G2 Users Rate Style Arcade?

  • Has the product been a good partner in doing business?: 9.4/10 (Category avg: 9.0/10)

Who Is the Company Behind Style Arcade?

  • Seller: Style Arcade
  • Company Website:
  • Year Founded: 2018
  • HQ Location: New York City, New York
  • LinkedIn® Page: au.linkedin.com
    34 employees on LinkedIn®

Who Uses This Product?

  • Top Industries: Retail, Apparel & Fashion
  • Company Size: 49% Medium, 39% Small

What Do G2 Reviewers Say About Style Arcade?

AI-generated summary from verified user reviews

Pros
  • Users appreciate the ease of use of Style Arcade, making data access and manipulation simple and intuitive.
  • Users find Style Arcade's insightful reporting and planning tools invaluable for effective assortment and marketing strategies.
  • Users value the dynamic reporting and visual insights in Style Arcade, enhancing product planning and decision-making.
  • Users value the user-friendly interface of Style Arcade, making it easy and intuitive for all team members.
  • Users appreciate the visual presentation of Style Arcade, enhancing product management and team collaboration effectively.
Cons
  • Users experience data inaccuracy in Style Arcade, encountering glitches and minor errors during data export and integration.
  • Users experience integration issues with Style Arcade, resulting in inaccurate data and glitches during export/import processes.
  • Users find metrics issues frustrating as settings often reset and filters do not carry over between tabs.
  • Users often experience slow performance with Style Arcade, leading to longer load times and inefficient reporting.
  • Users experience a 1-day delay in data retrieval and limitations in selecting specific time periods, affecting usability.

What Are Recent G2 Reviews of Style Arcade?

What Are G2 Users Discussing About Style Arcade?

AI can help you find the answers. G2 helps you trust them.

Connect G2 to Claude or ChatGPT for answers grounded in G2's trusted reviews, comparisons, and pricing from real user insights.

How it works

Supermetrics

Supermetrics helps marketers go AI-first - from insight to action. Founded in 2013 and headquartered in Helsinki, Finland, Supermetrics unifies the marketing workflow, connecting the full breadth of marketing and advertising data sources through to AI-powered analysis and activation, so businesses spend less time wrangling data and more time on strategic growth. Built for marketers, analysts, and BI professionals, Supermetrics serves organizations from small startups to large enterprises that rely on multiple data sources such as Google Analytics, Facebook Ads, HubSpot and Shopify - consolidating everything into the destination of their choice - spreadsheets, data warehouses, or AI assistants via native MCP support. Teams can connect and automate their marketing and advertising reporting without deep technical expertise, cutting the manual work and errors that come with pulling data by hand, and freeing up time for analysis and strategy instead of data collection. Supermetrics pairs a user-friendly interface with a library of templates and pre-built reports, making it fast to visualize data and get to an answer. The platform is trusted by 200,000+ organizations globally, including L’Oréal, BBC, and Heineken, across 120 countries. Supermetrics serves organizations of every size, from small and mid-sized businesses that need enterprise-grade reporting without enterprise overhead, to global brands such as Nestlé, Warner Bros, and Dyson, to agencies managing dozens of client accounts. The platform is SOC 2 Type II and ISO 27001 certified, GDPR and CCPA compliant, and backed by 24/5 global support. Its recognition as one of G2’s Top 50 Best EMEA Software Companies reflects an ongoing investment in innovation for data-driven marketing teams looking to move from manual reporting to AI-powered decisions.

Average Rating: 4.4/5.0

Total Reviews: 819

How Do G2 Users Rate Supermetrics?

  • Has the product been a good partner in doing business?: 8.2/10 (Category avg: 9.0/10)

Who Is the Company Behind Supermetrics?

  • Seller: Supermetrics
  • Company Website:
  • Year Founded: 2013
  • HQ Location: Helsinki, Uusimaa
  • LinkedIn® Page: www.linkedin.com
    427 employees on LinkedIn®

Who Uses This Product?

  • Who Uses This: Digital Marketing Manager, CEO
  • Top Industries: Marketing and Advertising, Retail
  • Company Size: 55% Small, 35% Medium

What Do G2 Reviewers Say About Supermetrics?

AI-generated summary from verified user reviews

Pros
  • Users commend the ease of use of Supermetrics, facilitating quick data connections and efficient reporting processes.
  • Users appreciate the seamless integrations of Supermetrics, benefiting from frequent updates and an excellent support team.
  • Users praise Supermetrics for its excellent customer support, making data integration and reporting straightforward and efficient.
  • Users appreciate the easy integrations with various platforms, streamlining data extraction and visualization effortlessly.
  • Users value the time-saving capabilities of Supermetrics, significantly reducing manual data extraction and reporting efforts.
Cons
  • Users find Supermetrics expensive, wishing for more flexible pricing options tailored to individual needs.
  • Users find missing features like GA4 funnel events and product feed integration hinder their reporting capabilities.
  • Users feel that the pricing is high and would prefer more flexible options tailored for individual needs.
  • Users experience data limitations with Supermetrics, missing crucial funnel events and having issues with product feeds.
  • Users find product limitations frustrating, noting constraints on data access and slow feature updates.

What Are Recent G2 Reviews of Supermetrics?

What Are G2 Users Discussing About Supermetrics?

SymmetricDS

SymmetricDS is the most advanced data replication and synchronization software solution for databases and filesystems. Easily integrate data using continuous change data capture in near real-time so you can focus on your application. SymmetricDS is proven in use cases that require fast and reliable database replication across local and wide area networks. Our data capture solution excels in the cloud and conditions where network bandwidth is limited or connectivity is intermittent. Core features include: ✓ Cross-platform data capture solution ✓ Sync any database to any database ✓ Distribute, filter, and transform ✓ Replicate from on-premise to cloud ✓ Scale to thousands of databases ✓ Automatic recovery ✓ Easy setup and configuration ✓ Powerful extension API

Average Rating: 5.0/5.0

Total Reviews: 1

How Do G2 Users Rate SymmetricDS?

  • Has the product been a good partner in doing business?: 10.0/10 (Category avg: 9.0/10)

Who Is the Company Behind SymmetricDS?

  • Seller: Jumpmind
  • Year Founded: 2008
  • HQ Location: Columbus, US
  • LinkedIn® Page: www.linkedin.com
    58 employees on LinkedIn®

Who Uses This Product?

  • Company Size: 100% Large

What Are Recent G2 Reviews of SymmetricDS?

TolaData

TolaData is a monitoring and evaluation (M&E) software for NGOs and Social Enterprises. Built by a team of experienced NGO professionals, data scientists and tech innovators, TolaData harnesses the latest in technology to make M&E simpler, effective and accessible for all. Our versatile tools enable organisations to manage the complete indicator workflow in one platform - from data collection, management and analysis to designing a results framework and indicator plan to reporting progress in real time. Organisations are thus empowered to measure project performance, demonstrate results on the ground and create positive impact.

Who Is the Company Behind TolaData?

Tugger

Tugger is the AI-powered data platform that connects your business systems to the analytics and AI tools you want to use. Most businesses are sitting on a goldmine of data locked inside the platforms they use every day - job management systems, accounting software, CRM tools, and more. Getting that data out, combining it, and turning it into real answers has traditionally meant expensive developers, complex API work, and months of setup. Tugger changes that. How it works Tugger connects to your business platforms - Simpro, Xero, HubSpot, QuickBooks, and more - and automatically pulls your data into a secure, managed cloud data warehouse. No coding. No API configuration. No data warehouse setup required. We handle all of that so you don't have to. Once your data is in the warehouse, you've got two powerful ways to get answers. Ask your data anything Connect your Tugger warehouse to Claude, ChatGPT, or Gemini via our built-in MCP server and ask questions in plain English. No SQL. No formulas. No waiting for someone to build a report. Just type a question and get a real, data-backed answer in seconds. Ask things like "which jobs made money last month?" or "what's my quote conversion rate by salesperson?" - instantly, across all your connected systems at once. Power BI and Tableau dashboards For teams that want visual dashboards, Tugger connects directly to Power BI and Tableau. Pre-built report templates for the most popular connectors mean you can hit the ground running without building everything from scratch. Who uses Tugger Field service businesses use Tugger to track job profitability, technician utilisation, and quote conversion. Finance teams use it to get instant answers from Xero and QuickBooks without manual exports. Sales teams connect HubSpot for pipeline visibility and performance reporting. Accountancy practices use it to give clients self-serve access to their own data across multiple entities. Why customers choose Tugger Simple to set up - most customers are up and running in minutes, not months. Secure by design - ISO 27001 aligned, built on Microsoft Azure, with enterprise-grade data storage included in every plan. No contracts, transparent pricing, and a support team customers consistently describe as outstanding.

Average Rating: 4.8/5.0

Total Reviews: 5

How Do G2 Users Rate Tugger?

  • Has the product been a good partner in doing business?: 10.0/10 (Category avg: 9.0/10)

Who Is the Company Behind Tugger?

  • Seller: Tugger
  • Year Founded: 2021
  • HQ Location: Bollington, GB
  • LinkedIn® Page: www.linkedin.com
    16 employees on LinkedIn®

Who Uses This Product?

  • Company Size: 60% Small, 40% Medium

What Do G2 Reviewers Say About Tugger?

AI-generated summary from verified user reviews

Pros
  • Users commend Tugger's exceptional customer support, highlighting their dedication and expertise in resolving issues efficiently.
  • Users value Tugger's easy accessibility to insightful reports, enhancing their data experience effortlessly across platforms.
  • Users value the expertise in data extraction and BI reporting from Tugger, enhancing report accessibility and reliability.
  • Users praise Tugger for its ease of use, simplifying data integration and reporting with intuitive templates and support.
  • Users appreciate Tugger's ease of use and excellent support for seamless Power BI integration and report creation.

What Are Recent G2 Reviews of Tugger?

Veezoo

Veezoo is an Agentic Analytics platform engineered for trust and reliability, purpose-built to empower every business user — regardless of technical background — to ask questions about their data and receive accurate, governed, and auditable answers. Founded in 2016 as a spin-off from ETH Zurich, Veezoo has been building AI-native analytics long before large language models became mainstream, combining Agentic AI with a proprietary Knowledge Graph architecture. At the core of Veezoo is the Knowledge Graph: a semantic layer that captures a company's business ontology, KPI definitions, metrics, governance rules, and authorization logic. Unlike conventional AI analytics tools that allow language models to write SQL directly — leading to hallucinated metrics and inconsistent results — Veezoo's AI translates every natural language question into Veezoo Query Language (VQL), which is then compiled to SQL through a deterministic, rule-based process. This means the AI never touches raw database tables, business logic is always applied consistently, and every result is fully traceable and auditable. Business users interact with Veezoo through a conversational chat interface, asking questions in plain language and receiving instant, verified answers with charts, tables, and dashboards. Veezoo interprets the data, suggests next steps, and summarizes key insights. Monitoring agents can investigate anomalies and alert teams when something requires action. Every chart title, filter, and label is rendered directly from VQL — not generated by an AI — so users can verify exactly what the data shows and hover over any term to see its governed definition. For data teams, Veezoo provides a Knowledge Graph IDE for modeling semantic layers from scratch using AI, leveraging existing documentation. The platform supports version control, BI-as-Code workflows, development branches, and automated tests — following best practices of modern analytics engineering. The Knowledge Graph lives in Git, making it versioned, reviewable, and auditable without vendor lock-in. Veezoo integrates natively with 17+ databases and data warehouses including Snowflake, Google BigQuery, Databricks, Amazon Redshift, PostgreSQL, MySQL, Microsoft SQL Server, Oracle, SAP HANA, and more. It also integrates with dbt Cloud to import models, metrics, and documentation, and delivers scheduled results and alerts directly to Slack and Microsoft Teams. An MCP server allows other AI tools such as Claude, ChatGPT, and Gemini to query the governed Knowledge Graph, and a public REST API enables custom integrations, embedded analytics, and CI/CD automation. Veezoo supports embedded analytics, allowing organizations to integrate the conversational analytics experience directly into their own applications in multi-tenant environments. The platform also features customizable branding, collaborative dashboards, and export capabilities to PDF, PNG, JPEG, SVG, and Excel. Recognized as a 2024 Gartner Cool Vendor in AI Models and Natural Language Technologies, Veezoo is trusted by thousands of users at companies including AXA, Bayer, Baloise, Breitling, Valora, and Air Up. The platform is headquartered in Zurich, Switzerland, and serves organizations ranging from innovative startups to Fortune 500 enterprises across industries including insurance, retail, consumer goods, and financial services.

Average Rating: 5.0/5.0

Total Reviews: 1

How Do G2 Users Rate Veezoo?

  • Has the product been a good partner in doing business?: 10.0/10 (Category avg: 9.0/10)

Who Is the Company Behind Veezoo?

  • Seller: Veezoo
  • Company Website:
  • Year Founded: 2016
  • HQ Location: Zurich, CH
  • LinkedIn® Page: www.linkedin.com
    19 employees on LinkedIn®

Who Uses This Product?

  • Company Size: 100% Small

What Are Recent G2 Reviews of Veezoo?

Versio.io Platform

Versio.io is an enterprise software solution based on historicized IT monitoring data to optimize and support your IT operations. With Versio.io you can historize your IT monitoring data extracting additional value from it. This allows you to reduce IT deployment costs and to use existing IT resources more efficiently. Optimization solutions require information from the history provided by Versio.io. This enables you to reduce hardware and license costs, ensure auditability of your IT, automate governance and compliance rule monitoring, ensure fair distribution of IT cost allocation, and further more.

Average Rating: 5.0/5.0

Total Reviews: 1

Who Is the Company Behind Versio.io Platform?

Who Uses This Product?

  • Company Size: 67% Small, 33% Large

What Are Recent G2 Reviews of Versio.io Platform?

What Are G2 Users Discussing About Versio.io Platform?

Viberate

Viberate Analytics provides structured music data for industry professionals. It enables A&R teams, managers, labels, and artists to discover talent, analyze audiences, track playlists, and evaluate performance across Spotify stats, YouTube analytics, and radio airplay — all connected in one system.

Average Rating: 5.0/5.0

Total Reviews: 1

Who Is the Company Behind Viberate?

  • Seller: Viberate
  • Year Founded: 2015
  • HQ Location: London, GB
  • LinkedIn® Page: www.linkedin.com
    43 employees on LinkedIn®

Who Uses This Product?

  • Company Size: 100% Small

What Are Recent G2 Reviews of Viberate?

Visyond

Turn your Excel into an insights machine anybody can drive. Visualize your spreadsheets as predictive dashboards, automate financial statements, and collaborate on what-if and risk analyses while protecting the model, sensitive data, and controlling exactly how much each and every person can interact with it. Keep the flexibility of a spreadsheet - use the familiar syntax of Excel — including dynamic arrays and XLOOKUPs — and quickly analyze the model, its scenarios, and create interactive visualizations for your team. Be in control - boost your team’s capabilities to get insights from and contribute information to the central spreadsheet in a secure and organized way that you control. Get answers in minutes - establish a visualization layer for your team to ask the central model ‘what-if’ questions, analyze scenarios and risks, and share interactive insights in minutes. Fewer errors, better security - improve data accuracy, reduce the risk of errors, protect sensitive information, and make better decisions, faster.

Average Rating: 4.8/5.0

Total Reviews: 6

How Do G2 Users Rate Visyond?

  • Has the product been a good partner in doing business?: 10.0/10 (Category avg: 9.0/10)

Who Is the Company Behind Visyond?

Who Uses This Product?

  • Company Size: 67% Small, 33% Medium

What Are Recent G2 Reviews of Visyond?

What Are G2 Users Discussing About Visyond?

Vizta

Vizta is a next-generation business intelligence (BI) and data visualization platform designed to empower organizations of all sizes to make smarter, faster, and more data-driven decisions. Built to overcome the limitations of traditional spreadsheets and outdated BI systems, Vizta provides a seamless, intuitive interface for handling large-scale transactional databases with ease. Key features include: Drag-and-Drop Analytics Real-Time Data Integration AI-Powered Insights Custom Visualizations High Performance With Vizta, decision-makers no longer need to rely on limited reporting tools or face Excel's row restrictions. Its intuitive design, powerful analytics, and seamless integration make it the ultimate solution for transforming raw data into impactful business strategies.

Who Is the Company Behind Vizta?

  • Seller: Viz Labs
  • Year Founded: 2023
  • HQ Location: Gurgaon, IN
  • LinkedIn® Page: www.linkedin.com
    7 employees on LinkedIn®

Waydev

Waydev is the leading Software Engineering Intelligence platform, trusted by Fortune 500 companies to measure engineering performance and accelerate delivery. We go beyond basic DORA metrics by providing over 130+ actionable insights across productivity, quality, DevOps performance, process hygiene, and team health. Our platform integrates seamlessly with Git, Jira, and CI/CD tools, giving engineering leaders full visibility into how their teams deliver software. With predictive analytics, benchmarking, and AI-powered recommendations, Waydev helps organizations improve velocity, reduce bottlenecks, and align engineering with business outcomes. Founded in 2017 and backed by Y Combinator, Waydev is the only scalable solution built for enterprises that need reliable, data-driven insights into software delivery. Companies like American Express, Dropbox, and Citibank trust Waydev to turn engineering data into business impact.

Average Rating: 4.7/5.0

Total Reviews: 63

How Do G2 Users Rate Waydev?

  • Has the product been a good partner in doing business?: 9.7/10 (Category avg: 9.0/10)

Who Is the Company Behind Waydev?

  • Seller: Waydev
  • Company Website:
  • Year Founded: 2017
  • HQ Location: San Francisco, California
  • LinkedIn® Page: www.linkedin.com
    41 employees on LinkedIn®

Who Uses This Product?

  • Who Uses This: CTO
  • Top Industries: Computer Software, Information Technology and Services
  • Company Size: 65% Small, 29% Medium

What Do G2 Reviewers Say About Waydev?

AI-generated summary from verified user reviews

Pros
  • Users appreciate the ease of integration with existing tools, enhancing performance tracking and visibility in engineering teams.
  • Users value the clear visibility into team performance offered by Waydev, enabling data-driven decisions and improved efficiency.
  • Users value the excellent visibility into engineering operations provided by Waydev, enhancing team performance insights.
  • Users value Waydev for its clear visibility into engineering performance, enabling actionable insights and enhanced workflow efficiency.
  • Users appreciate the clear visibility into performance that Waydev offers, enhancing tracking and decision-making across teams.
Cons
  • Users note metrics issues in Waydev, finding individual developer metrics cluttered and DevEx surveys needing flexibility.
  • Users find the individual developer metrics cluttered and not useful, detracting from the overall experience of Waydev.
  • Users find that access control requires more updates and improvements to align with industry standards effectively.
  • Users find the dashboard flexibility lacking, suggesting improvements for better integration and user experience.
  • Users find the difficult learning curve of Waydev to be more time-consuming than expected when getting started.

What Are Recent G2 Reviews of Waydev?

What Are G2 Users Discussing About Waydev?

Whaly

We believe that analytics should benefit everyone. Whaly is an integrated, self-service business intelligence platform that enables data teams and business teams to work better together. Business teams are empowered to access, analyze, and share data from the tools they already use every day - HubSpot, Salesforce, Google Analytics, and more - with no technical expertise required. This means no more waiting on data teams for answers to every question. In parallel, data teams get some time back to focus on fewer menial tasks. With Whaly, you can connect, model, visualize and share your data - all from one place. Our mission is to boost adoption and foster company-wide trust in data, so that your company can make better, more informed decisions. Time to make your data work harder for you - not the other way around.

Average Rating: 4.8/5.0

Total Reviews: 25

How Do G2 Users Rate Whaly?

  • Has the product been a good partner in doing business?: 9.5/10 (Category avg: 9.0/10)

Who Is the Company Behind Whaly?

  • Seller: Whaly
  • Year Founded: 2020
  • HQ Location: Paris, FR
  • LinkedIn® Page: www.linkedin.com
    15 employees on LinkedIn®

Who Uses This Product?

  • Top Industries: Computer Software
  • Company Size: 44% Medium, 40% Small

What Are Recent G2 Reviews of Whaly?

WireBoard.io

WireBoard is a modern web analytics platform built for teams or solo website owners that need real-time insights without the steep learning curve of Google Analytics 4. Unlike traditional analytics tools that force you to choose between live data and historical reporting, WireBoard combines both in a single interface. Monitor traffic as it happens, compare today's performance to last week or last year, and drill into detailed reports: all from one customizable dashboard. Key capabilities include: - Real-time analytics with sub-second time resolution - Multi-site aggregation: view all your websites in a single, unified dashboard - 20+ real-time widgets and 11 report widgets, fully customizable - Custom event tracking that takes minutes to set up — no developer required - Funnels, user journey visualization, and conversion tracking - Period-over-period comparisons (yesterday, last week, last month, last year) - Per-widget timezone configuration - Scheduled data exports to S3 and automated email reports - Privacy-conscious data handling with no third-party sharing WireBoard is built for marketing teams, e-commerce operators, news publishers, and agencies managing multiple sites — anyone who needs to act on data immediately rather than wait for reports to load. Pricing starts free, with paid plans from $9 to $399/month.

Who Is the Company Behind WireBoard.io?

Bijou Barry
BB
Researched and written by Bijou Barry
Updated June 24, 2026